
Active Scotland Policy in to Practice Emma Broadhurst
Active Scotland Policy in to Practice Emma Broadhurst Local Authority and Legacy Manager
ACTIVE SCOTLAND • Background – what do we mean by physical activity? • What does the evidence say? • How do we translate that to policy? • What is the current national picture? • Where does Aberdeenshire fit?
Stand Up – Sit Down
Physical Activity - What is it? Physical activity is any active movement of the body that is produced by muscular contractions and that results in the expenditure of energy Ie Any movement of the body that uses energy

Dimensions and Domains Dimensions of physical activity Domains of physical activity • Intensity: effort required (low, moderate, vigorous) • Leisure time (eg sports, recreational walking ) • Duration: length of time activity carried out • Household activities (eg cleaning, gardening) • Frequency: number of sessions over a fixed period (usually per week) • Occupational/school (activity at work or school eg PE) • Active transport ( walking, cycling as transport)

The Active Scotland spectrum… VISION – A MORE ACTIVE SCOTLAND Physical activity is about getting people moving. Daily walking, playing in a park, going to a gym, training with a team or aspiring to win a gold medal- it doesn’t really matter how people get active, it just matters that we do. Being physically active contributes to our personal, community and national wellbeing. Our vision is of a Scotland where more people are more active more often.
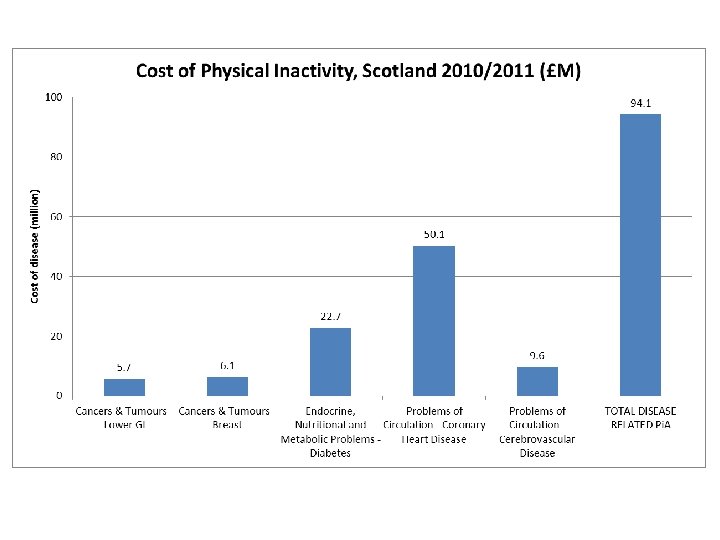
Why the Fuss? Seminal studies linking PA to health Contribution to health Costs of inactivity – Global, UK, Scotland
• Seminal studies – CVD/cardiorespiratory fitness (late 1950 s) links PA to health • Worldwide, estimate that physical inactivity causes – 6% (ranging from 3· 2% in southeast Asia to 7· 8% in the eastern Mediterranean region) of the burden of disease from coronary heart disease – 7% (3· 9– 9· 6) of type 2 diabetes, – 10% (5· 6– 14· 1) of breast cancer – 10% (5· 7– 13· 8) of colon cancer [(Lee et al 2012) ]
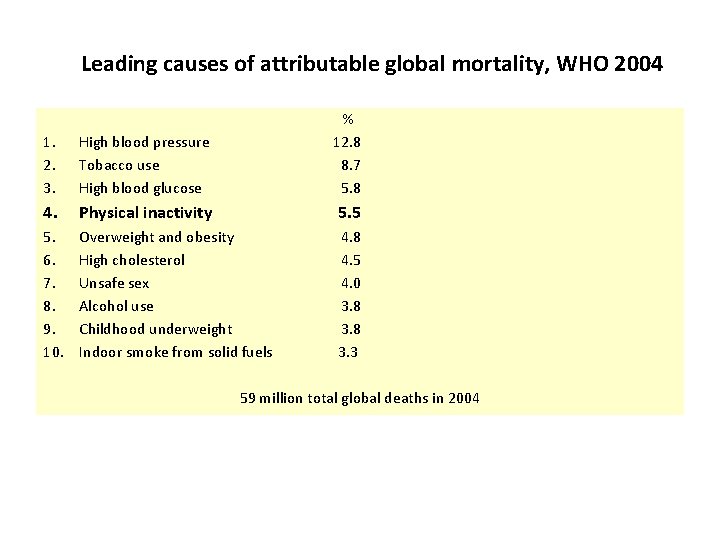
Leading causes of attributable global mortality, WHO 2004 1. 2. 3. High blood pressure Tobacco use High blood glucose % 12. 8 8. 7 5. 8 4. Physical inactivity 5. 5 5. 6. 7. 8. 9. 10. Overweight and obesity High cholesterol Unsafe sex Alcohol use Childhood underweight Indoor smoke from solid fuels 4. 8 4. 5 4. 0 3. 8 3. 3 59 million total global deaths in 2004
UK – 2006/7 • Comparative level of importance varies depending of figures used – message is the same – physical inactivity is a major issue – In 2006– 07, costs to NHS in UK for behaviour related ill health: • • • poor diet £ 5. 8 billion Smoking £ 3. 3 billion alcohol £ 3. 3 billion overweight and obesity cost £ 5. 1 billion physical inactivity was £ 0. 9 billion [Scarborough et al 2011, http: //www. ias. org. uk/uploads/pdf/Economic%20 impacts%20 docs/pubmed. f dr 033. full. pdf ] • 2002 study commissioned by the UK Department for Culture, Media and Sport which summed direct and indirect costs to the NHS, including loss of earnings due to inability to work and premature death. This produced a total estimated cost of physical inactivity of £ 8. 2 billion • Unhelpful always to compare - Lifestyle behaviours usually co-exist so all co-related
Government Roots of guidelines Current guidelines
Government and Physical Activity Guidelines (PAGs) • American College of Sports Medicine (ACSM) and American Heart Association – first guidelines • Others followed suit including WHO • New UK-wide 2011, based on latest evidence
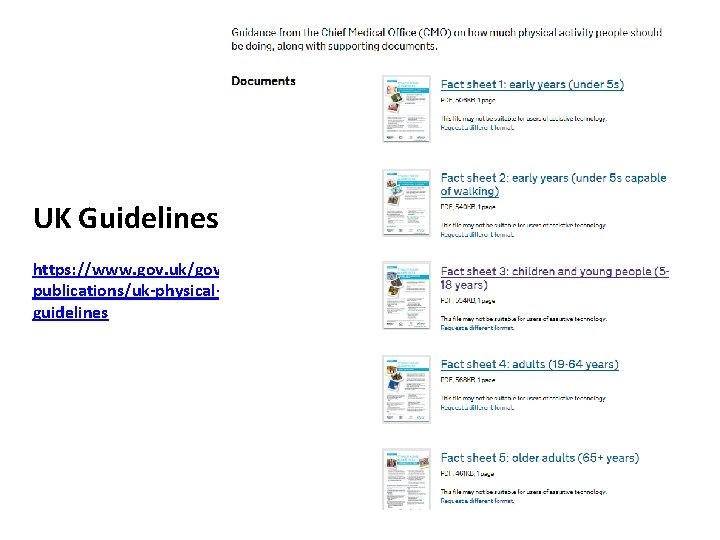
UK Guidelines 2011 https: //www. gov. uk/government/ publications/uk-physical-activityguidelines
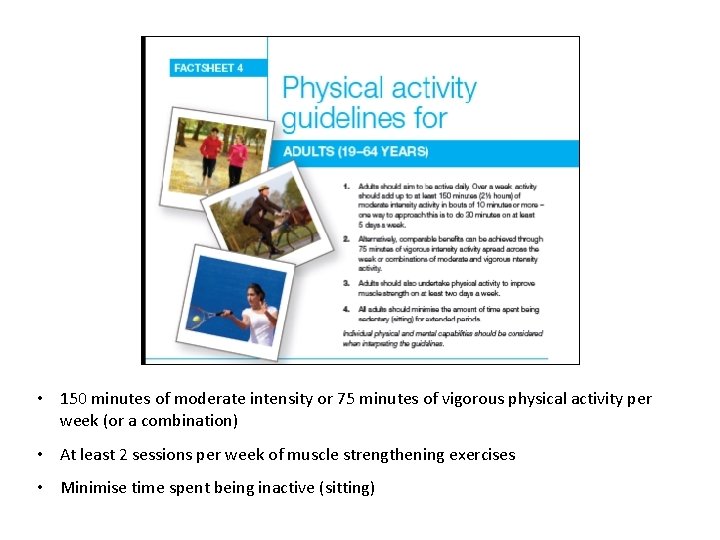
• 150 minutes of moderate intensity or 75 minutes of vigorous physical activity per week (or a combination) • At least 2 sessions per week of muscle strengthening exercises • Minimise time spent being inactive (sitting)
Policy Landscape Recent research trend leading to widening of responsibility and gain across multiple policy areas Current policy landscape in Scotland
Not just about Health – Impacts and Influence • IMPACT - Research widened into costs and benefits of PA beyond health – environment, education, economy etc • INFLUENCE - socio-ecological perspective and role of environment - move away from focus on the individual and realisation of role for other policy areas to promote PA
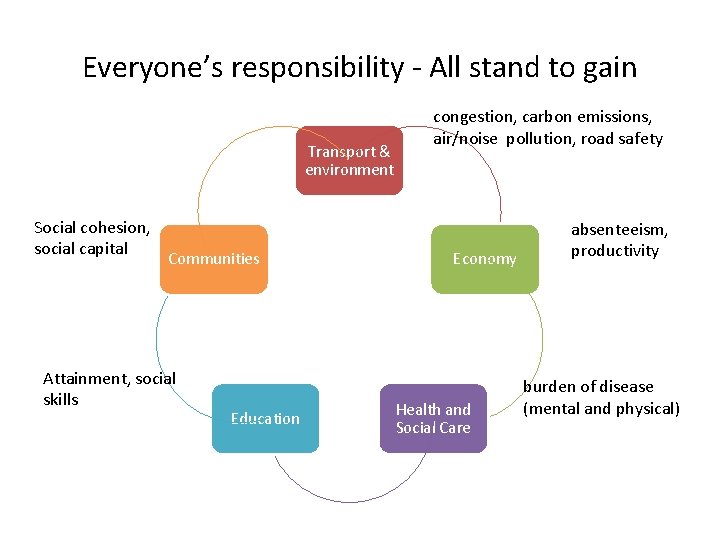
Everyone’s responsibility - All stand to gain Transport & environment Social cohesion, social capital Communities Attainment, social skills Education congestion, carbon emissions, air/noise pollution, road safety Economy Health and Social Care absenteeism, productivity burden of disease (mental and physical)
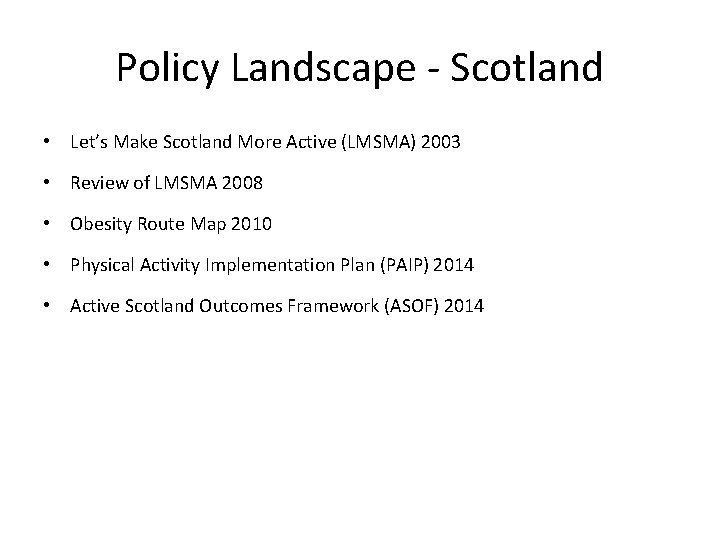
Policy Landscape - Scotland • Let’s Make Scotland More Active (LMSMA) 2003 • Review of LMSMA 2008 • Obesity Route Map 2010 • Physical Activity Implementation Plan (PAIP) 2014 • Active Scotland Outcomes Framework (ASOF) 2014
So what about Scotland?
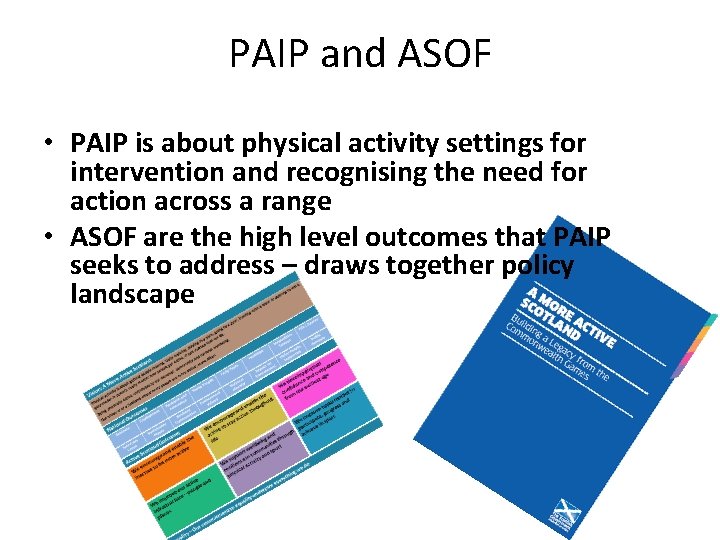
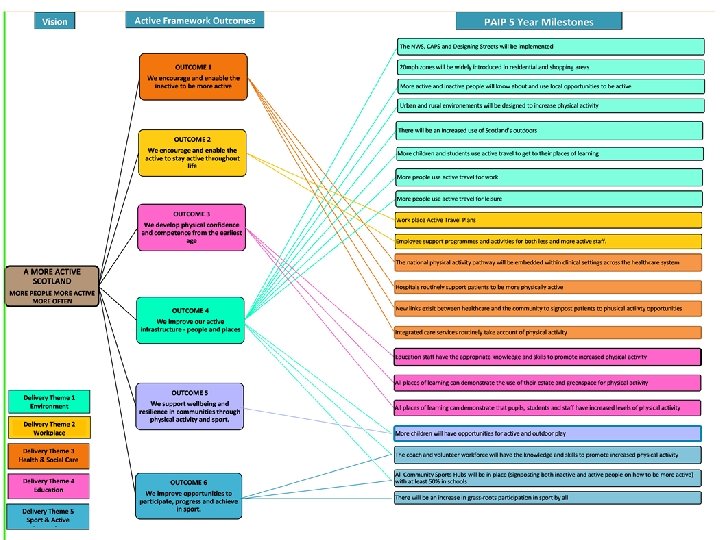
PAIP and ASOF • PAIP is about physical activity settings for intervention and recognising the need for action across a range • ASOF are the high level outcomes that PAIP seeks to address – draws together policy landscape
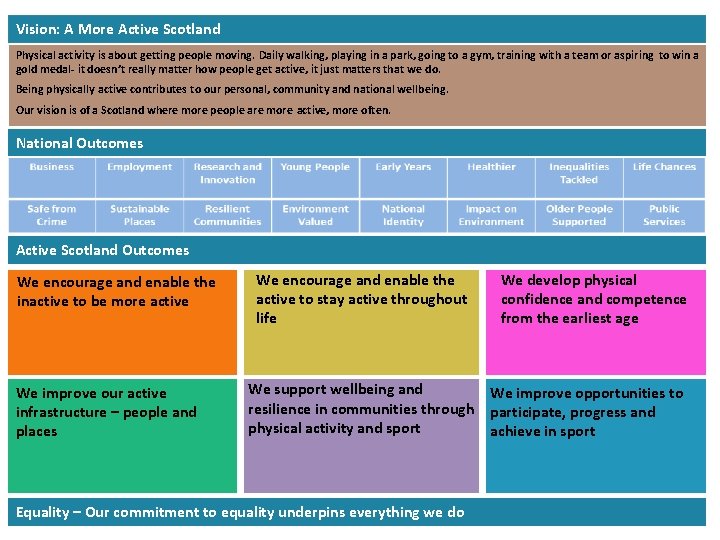
Vision: A More Active Scotland Physical activity is about getting people moving. Daily walking, playing in a park, going to a gym, training with a team or aspiring to win a gold medal- it doesn’t really matter how people get active, it just matters that we do. Being physically active contributes to our personal, community and national wellbeing. Our vision is of a Scotland where more people are more active, more often. National Outcomes Active Scotland Outcomes We encourage and enable the inactive to be more active We improve our active infrastructure – people and places We encourage and enable the active to stay active throughout life We develop physical confidence and competence from the earliest age We support wellbeing and We improve opportunities to resilience in communities through participate, progress and physical activity and sport achieve in sport Equality – Our commitment to equality underpins everything we do
The way ahead Current PA situation and trends in Scotland Positives – PA, walking, freq of sport Challenges – inactive, more into sport, inequalities Where stand to gain the most (doesresponse/numbers)
Picture in Scotland? • Tentative increase in physical activity, recreational walking, frequency of sports participation • No change inactive and proportion participating in sport • Indication that active getting more active • Increase in physical activity is those doing some moving into meeting the guidelines
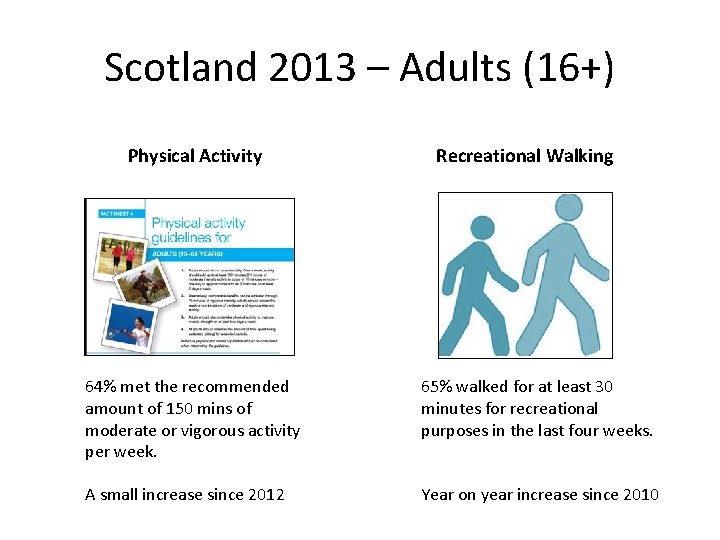
Scotland 2013 – Adults (16+) Physical Activity Recreational Walking 64% met the recommended amount of 150 mins of moderate or vigorous activity per week. 65% walked for at least 30 minutes for recreational purposes in the last four weeks. A small increase since 2012 Year on year increase since 2010
Scotland 2013 – Adults (16+) Sports participation Frequency of sports participation 52% reported participating in sport in the last four weeks. 48% of participants took part in sport and exercise regularly (15 or more days) in the four weeks prior to interview. Relatively stable 2010 to 2013 Increased yearly since 2010
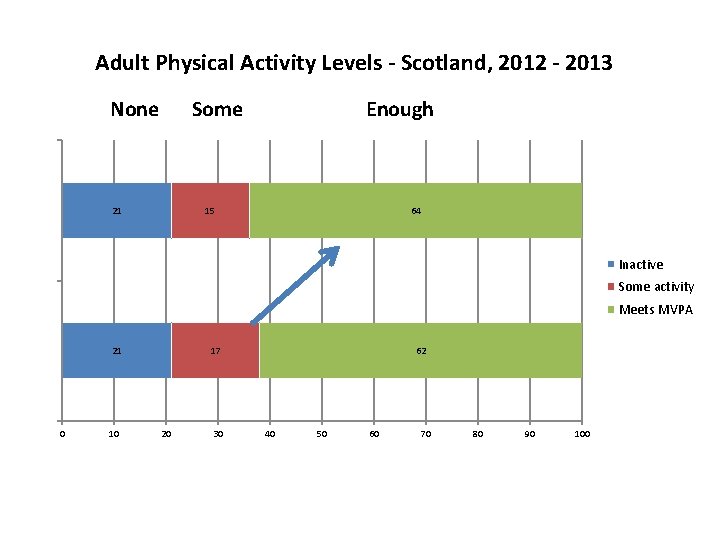
Adult Physical Activity Levels - Scotland, 2012 - 2013 None Some 21 Enough 15 64 Inactive Some activity Meets MVPA 21 0 10 17 20 30 62 40 50 60 70 80 90 100
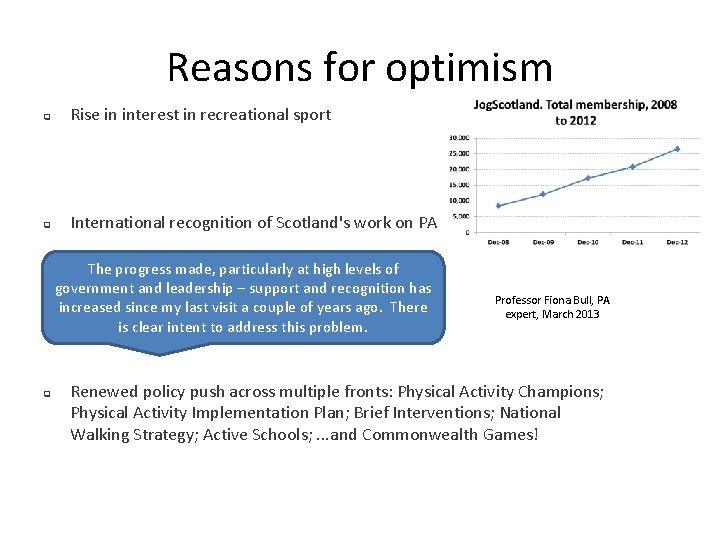
Reasons for optimism q Rise in interest in recreational sport q International recognition of Scotland's work on PA The progress made, particularly at high levels of government and leadership – support and recognition has increased since my last visit a couple of years ago. There is clear intent to address this problem. q Professor Fiona Bull, PA expert, March 2013 Renewed policy push across multiple fronts: Physical Activity Champions; Physical Activity Implementation Plan; Brief Interventions; National Walking Strategy; Active Schools; . . . and Commonwealth Games!
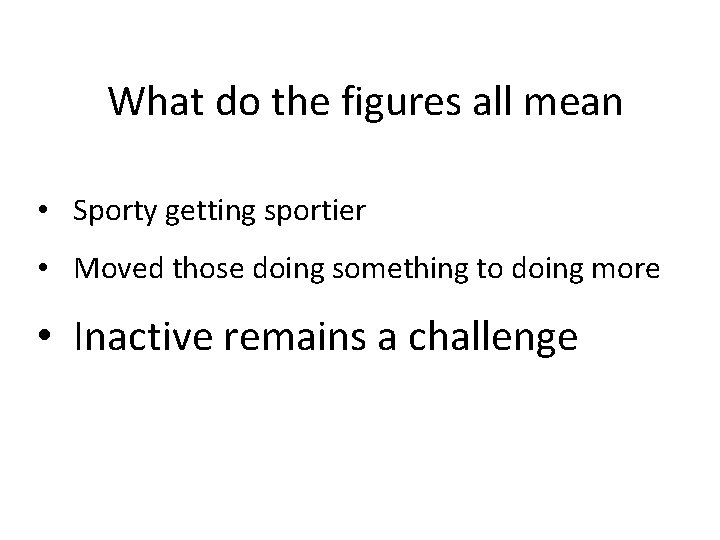
What do the figures all mean • Sporty getting sportier • Moved those doing something to doing more • Inactive remains a challenge
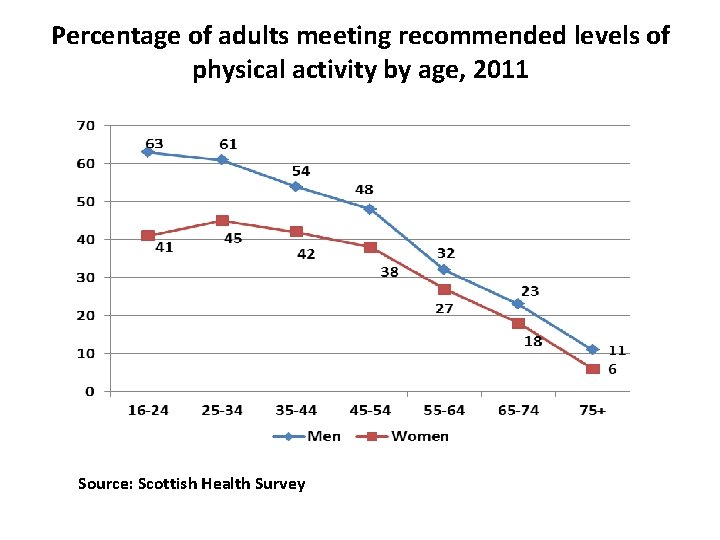
Percentage of adults meeting recommended levels of physical activity by age, 2011 Source: Scottish Health Survey
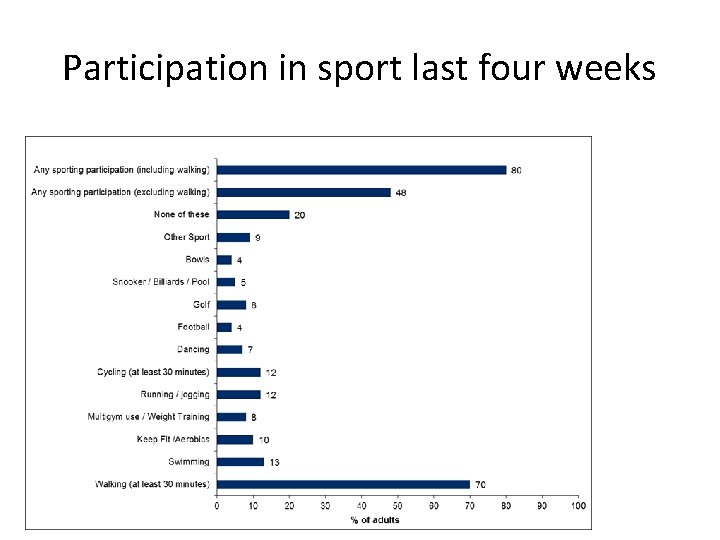
Participation in sport last four weeks
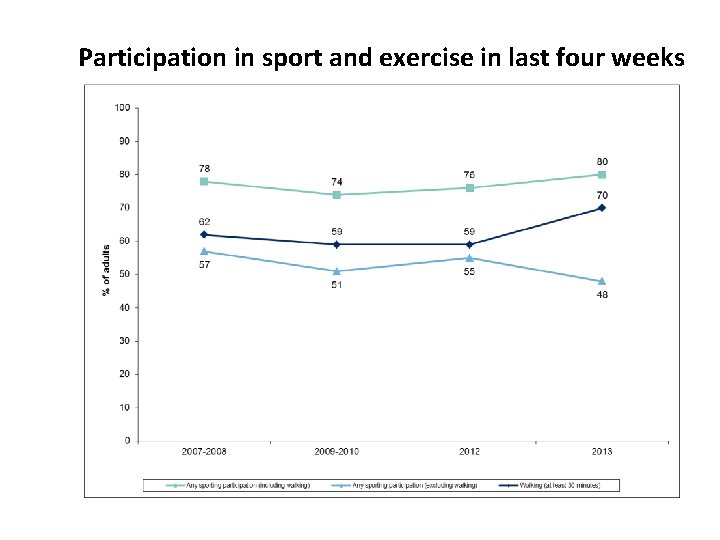
Participation in sport and exercise in last four weeks
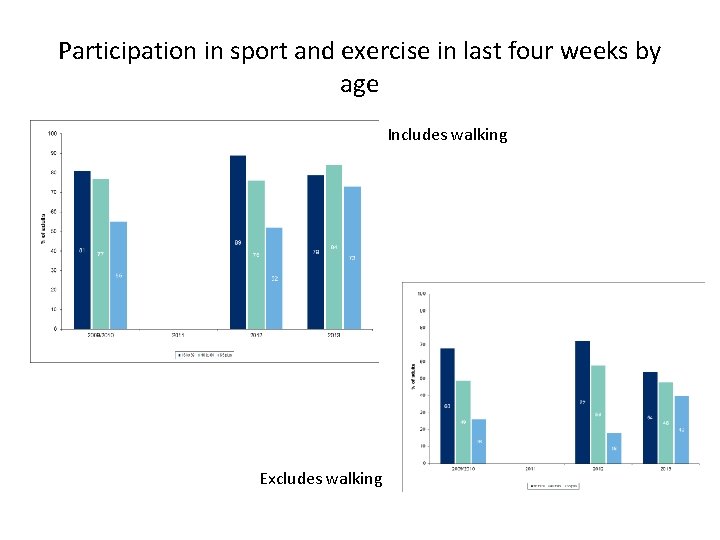
Participation in sport and exercise in last four weeks by age Includes walking Excludes walking
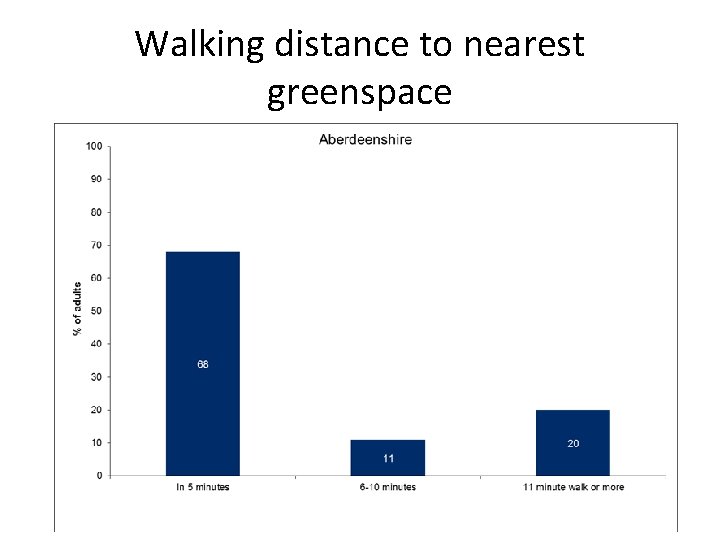
Walking distance to nearest greenspace
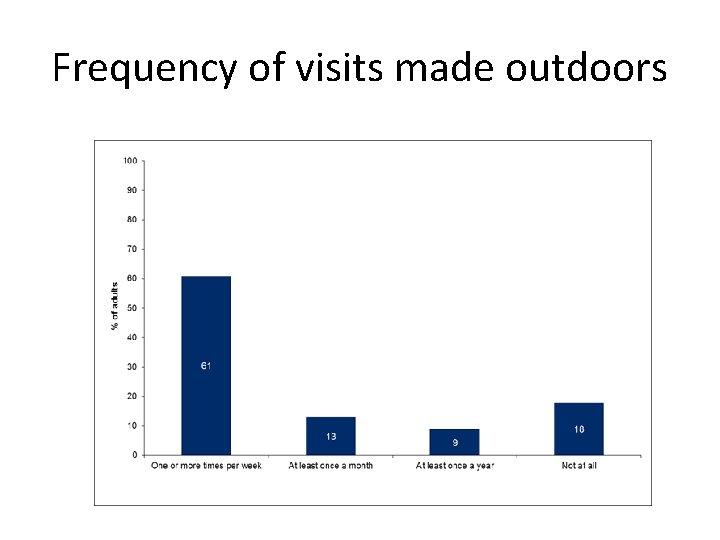
Frequency of visits made outdoors
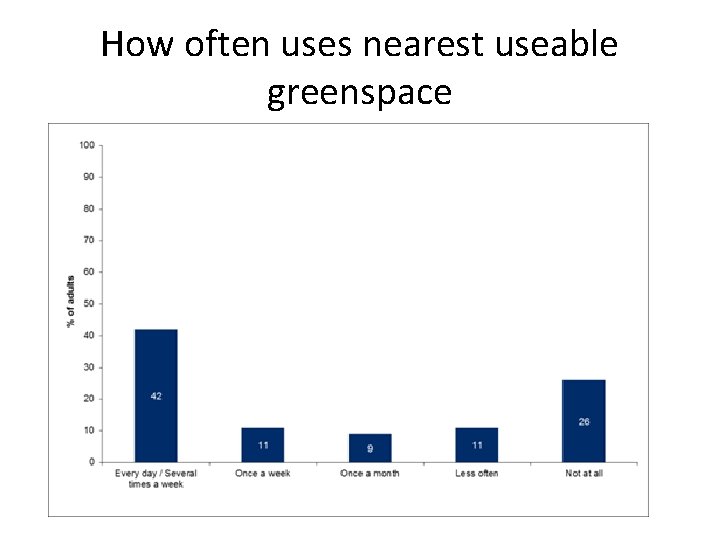
How often uses nearest useable greenspace
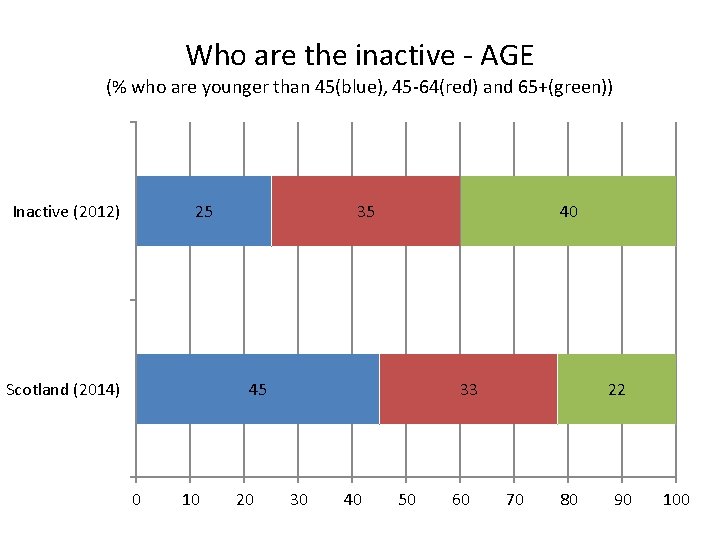
Who are the inactive - AGE (% who are younger than 45(blue), 45 -64(red) and 65+(green)) Inactive (2012) 25 Scotland (2014) 35 40 45 0 10 20 33 30 40 50 60 22 70 80 90 100
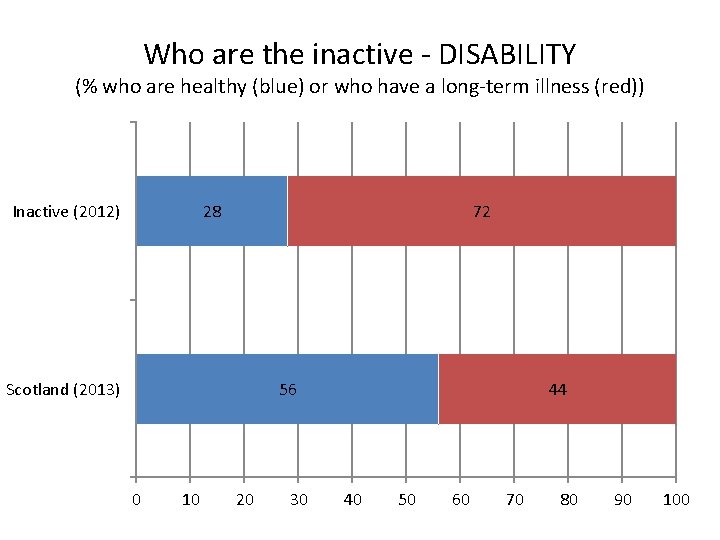
Who are the inactive - DISABILITY (% who are healthy (blue) or who have a long-term illness (red)) Inactive (2012) 28 72 Scotland (2013) 56 0 10 20 30 44 40 50 60 70 80 90 100
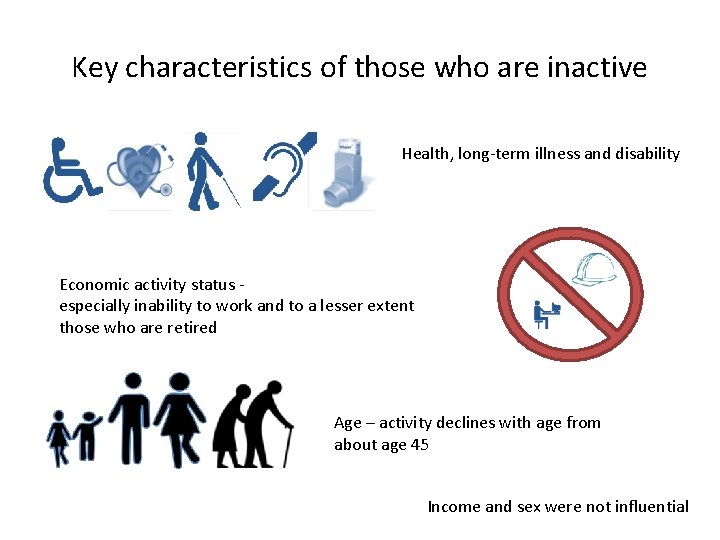
Key characteristics of those who are inactive Health, long-term illness and disability Economic activity status especially inability to work and to a lesser extent those who are retired Age – activity declines with age from about age 45 Income and sex were not influential
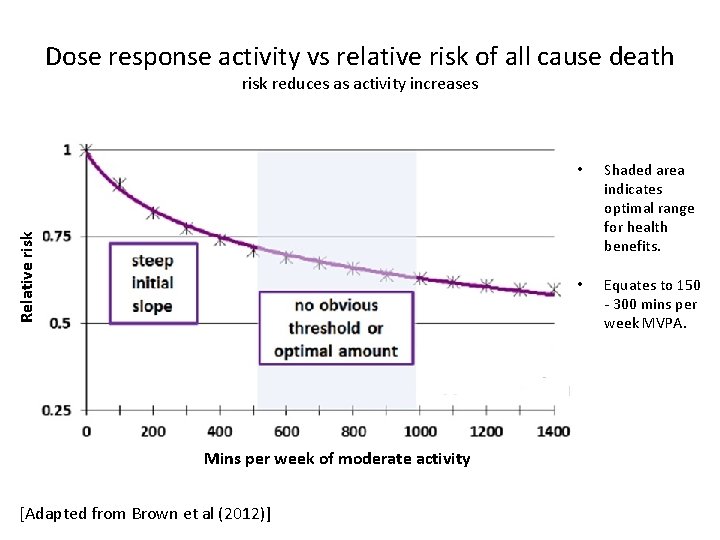
Dose response activity vs relative risk of all cause death Relative risk reduces as activity increases Mins per week of moderate activity [Adapted from Brown et al (2012)] • Shaded area indicates optimal range for health benefits. • Equates to 150 - 300 mins per week MVPA.
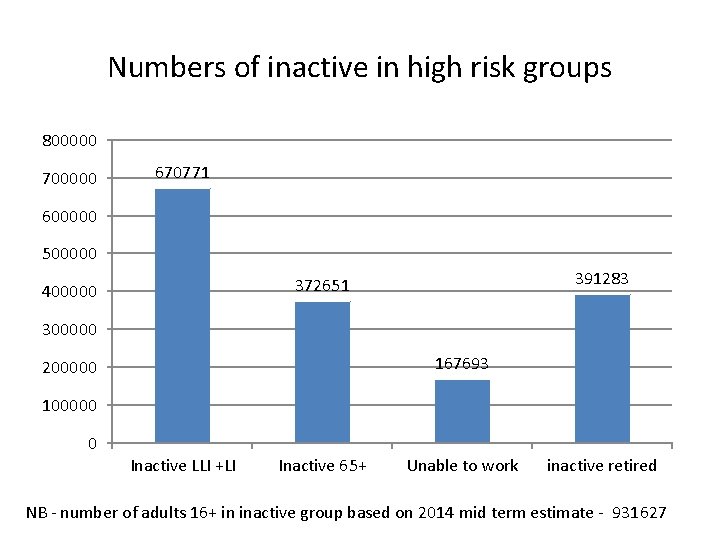
Numbers of inactive in high risk groups 800000 700000 670771 600000 500000 391283 372651 400000 300000 167693 200000 100000 0 Inactive LLI +LI Inactive 65+ Unable to work inactive retired NB - number of adults 16+ in inactive group based on 2014 mid term estimate - 931627
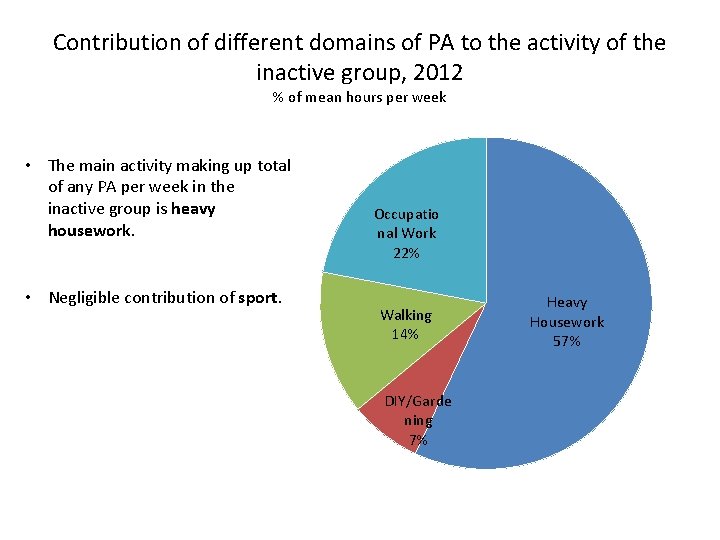
Contribution of different domains of PA to the activity of the inactive group, 2012 % of mean hours per week • The main activity making up total of any PA per week in the inactive group is heavy housework. • Negligible contribution of sport. Occupatio nal Work 22% Walking 14% DIY/Garde ning 7% Heavy Housework 57%
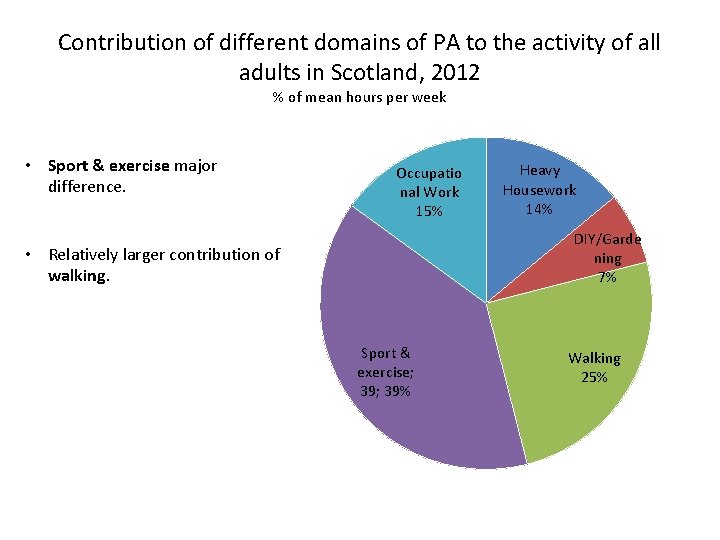
Contribution of different domains of PA to the activity of all adults in Scotland, 2012 % of mean hours per week • Sport & exercise major difference. Occupatio nal Work 15% Heavy Housework 14% DIY/Garde ning 7% • Relatively larger contribution of walking. Sport & exercise; 39% Walking 25%
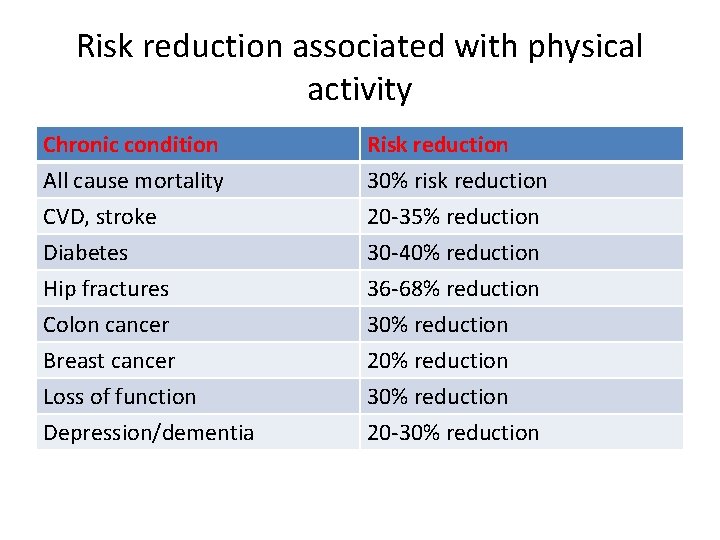
Risk reduction associated with physical activity Chronic condition All cause mortality CVD, stroke Diabetes Risk reduction 30% risk reduction 20 -35% reduction 30 -40% reduction Hip fractures Colon cancer Breast cancer Loss of function Depression/dementia 36 -68% reduction 30% reduction 20 -30% reduction
Next Steps - nationally • Driving policy across SG • Delivery of PAIP • Gathering LA /CPP information
Next steps locally Current SOA outcome Physical activity increased across the population including those who are vulnerable through shifts in culture, improvements in infrastructure, opportunities and community empowerment
My questions to you • Who are your inactive? • What are the priorities? • How will you get them active? How will you keep people active? • How will you deliver this to help make that step change in an environment of shrinking resources?
- Slides: 50