Active and passive microwave remote sensing of precipitation


- Slides: 34

Active and passive microwave remote sensing of precipitation at high latitudes R. Bennartz - M. Kulie - C. O’Dell (1) S. Pinori – A. Mugnai (2) (1) University of Wisconsin – AOS – Madison, WI - USA (2) Institute of Atmospheric Science and Climate, National Research Council, Rome, Italy

Outline n Introduction n n Modeling Strategy Light snow/rain validation database Case study n n n High latitudes and why study light rain snow Light snowfall event from radar Satellite-model comparison UW-NMS mesoscale model comparison Sensitivity of the MW frequencies to perturbation in the IWC Outlook n n Towards GPM IPWG

SNOW AT MID-TO-HIGH LATITUDES (Figures from P. Yoe, J. Koistinen) Snowfall Accumulation Snow to Total Precipitation Ratio At mid-to-high latitudes, snowfall represents a substantial portion of the precipitation. From higher latitudes at least 90% of the precipitation occurs at rates less than 3 mm/hr and 60 % at less than 1 mm/h

What we can observe Radar reflectivity (vertically resolved) Passive MW brightness temperatures (vertical integral)

What we can NOT observe: Drop size distribution Ice particle density Index of refraction. . .

What we can NOT observe: Drop size distribution Ice particle density Index of refraction. . . We need models to relate the microphysics to microwave optical properties

What we can NOT observe: Drop size distribution Ice particle density Index of refraction. . . We need models to relate the microphysics to microwave optical properties And those models have to agree with all available information

How can we trust our modeling assumptions?

How can we trust our modeling assumptions? Radar reflectivites Environmental data Precip microphysics model Change microphysics Radiative transfer model Simulated TBs Compare Observed TBs

One Microphysics Model (Bennartz & Petty 2001) Adjustable parameters: Ice density Size of ice relative to liquid particles Consistent description of Radar Refl/ Fall Speed/ Particle number concentration X = 0. 5 Frozen Liquid X=1 X=2

High latitude light snow/rain database (2002 -ongoing) Radar data BALTRAD radar composites BALTRAD gauge adjustments Gotland radar volume scans Satellite data NOAA 15, 16, 17 AMSU-A/B AQUA AMSR-E SSMIS (if/when available) Global/regional model data: global NCEP/GFS data UW-NMS model (for selected cases)

CASE STUDY Light snowfall over the Baltic Sea the 12 -13 January, 2003. Comparing different groundbased, satellite and modelling data MODIS 15 March 2003

2003 -01 -12 0130 UTC Gotland radar reflectivity (lowest scan)

2003 -01 -12 0130 UTC

2003 -01 -12 0130 UTC

2003 -01 -12 0130 UTC Radar composite (gauge adjusted surface rain rate)

2003 -01 -12 AMSU 89 GHz and 150 GHz 0130 UTC NOAA-17 0107 UTC

2003 -01 -12 AMSU 89 - 150 GHz 0130 UTC NOAA-17 0107 UTC

2003 -01 -12 0130 UTC AMSR 89 GHz AQUA 01: 31 UTC

RT : Reverse 3 D Monte-Carlo with Henyey-Greenstein Phase Function, on a 2 km x 1 km grid with 10 vertical levels. FASTEM-2 Ocean emissivity model, everywhere. 89 GHz (a) channel, at radar resolution 89 GHz (a) channel, at 36 GHz resolution

Model vs. Observation Comparison: Little bias, reasonably good correlation. Only areas where there is precip

UW-NMS MODEL SETUP 3 two-way nested grids 18 hr simulation: from 12 UTC 11 January to 06 UTC 12 January 2003 3 rd grid: 6 hours from 00 UTC 12 Jan 6 category bulk microphysics: Cloud droplets, Rain, Pristine crystals, Snow (rimed crystals/low density graupel), Aggregated crystals, High density graupel Mixing ratios of total water and 5 hydrometeors categories are predicted: rain, graupel, snow, pristine crystals, and aggregates. Cloud water is diagnosed [Tripoli 1992]

RADAR-MODEL COMPARISON Selected two areas of similar environmental parameters (LWP, WVP). d. BZ Take into account the radar beam width at ~100 km from the radar site

SCATTERING INDEX FOR PRECIPITATING AREA Relation between scattering index and 89 GHz brightness temperature for model (blue) and AMSR (red) for x=1; Relation between scattering index and 89 GHz brightness temperature for radar (red) and AMSR (black) for x=1. Red: radar Black: satellite Radar and model datasets are in good agreement, with the scattering index ranging from -5 and 20 K.

AMSU–MODEL COMPARISON Relation between TB 89 -TB 150 and the surface precipitation for different size ratio x for observed AMSU-B data (red) and simulated data (blue). X=1

Where are we? Microphysics model agrees with radar observations Microphysics model agrees with passive mw observation at various scattering frequencies Surface rain rates are comparable to gaugeadjusted radar

Channel definition for new sensors The Jacobian is defined as the partial derivative of a function: The increase the IWC of ε allow us to see the sensitivity of TBs to perturbations in hydrometeor contents.

K / (g/m 3) 150 GHz 89 GHz 150 GHz is more sensitive to the IWC perturbation than the 89 GHz especially in the upper levels. Ø

118± 8. 5 GHz 118± 4. 2 GHz 118± 2. 3 GHz K / (g/m 3) Potential of the O 2 -sounding channels for frozen precipitation detection

Conclusions/Outlook • Use all observable Tb d. BZ to ensure consistency of microphysical assumptions in observation space • Need for coordination of different groups working towards snowfall/high lat precip. using different microphysics schemes (intercomparison) -> IPWG

Conclusions/Outlook • Use all observable Tb d. BZ to ensure consistency of microphysical assumptions in observation space • Need for coordination of different groups working towards snowfall/high lat precip. using different microphysics schemes (intercomparison) -> IPWG • Dedicated experiments necessary to better understand cloud microphysics

Conclusions/Outlook • Use all observable Tb d. BZ to ensure consistency of microphysical assumptions in observation space • Need for coordination of different groups working towards snowfall/high lat precip. using different microphysics schemes (intercomparison) -> IPWG • Dedicated experiments necessary to better understand cloud microphysics • BUT on a global scale we have to go with simple solutions for retrieval algorithms etc…

Two more things for high latitudes • We need channels that are surface blind • We need GPM like radars

Thanks
 Active passive remote sensing
 Microwave remote sensing lecture notes
 Introduction to microwave remote sensing
 Active and passive components in microwave
 Steps of gravimetric analysis
 Co precipitation and post precipitation
 Ifov and fov in remote sensing
 National authority for remote sensing and space sciences
 Limitations of remote sensing
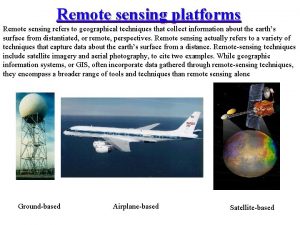
 Remote sensing platforms
 Limitations of remote sensing
 Digital number remote sensing
 Limitations of remote sensing
 Idealized remote sensing system
 Geospatial data definition ap human geography
 Remote sensing
 Parallax bar
 Strip camera in remote sensing
 Remote sensing image
 Geometry of aerial photography
 Canada centre for remote sensing
 Distortion ap human geography
 Remote sensing applications center
 Remote sensing applications center
 Remote sensing physics
 Remote sensing in precision agriculture
 Aerial photography in remote sensing pdf
 Remote sensing physics
 Geometric errors in remote sensing
 Remote sensing
 Lidar
Lidar Remote-sensing
 Applied remote sensing training program
 Advantages of remote sensing
 Remote sensing
