Activation Barrier to Reaction Process Kinetic Molecular Theory

Activation Barrier to Reaction Process

Kinetic Molecular Theory In a reaction, there must be a chemical changes • • Reactant bonds are broken Product bonds are formed Factors influence reaction rate: Rate [Collision • frequency Orientation • of molecules Activation] & Catalyst Energy

1. Collision Frequency 4 particle system 4 collision 6 particle system 4 o and 2 8 collision 8 particle system 4 o and 4 16 collision In general: n • n = number collisions Z = collision frequency = z • [A] [B] rate collision / time

2. Steric Factor For collision to lead to products, the orientation of the molecules must be correct for bonds to break No reaction Product formation

Activation Energy • According to the Kinetic Molecular Theory; any molecule in motion possesses kinetic energy (1/2 mv 2). Faster the motion, the more likely reactants will fragment upon collision. • Consider the Car Analogy: Cars will not disintegrate by itself. However at low speeds, collision between car will cause little to no damage. But at high speeds, there will be major damages.

Eact - Activation Energy • If the k. E. is large enough, then upon collision molecules will vibrate so vigorously as to break bonds which can lead to new products. • Energetically, there must be some minimum collision energy that must be exceeded before a reaction occurs. Svante Arrhenius Suggested that molecules must possess a minimum amount of K. E. in order to react. In other words, energy must be available to the reactant for the reaction to occur SVANTE AUGUST ARRHENIUS http: //www. Nobel. se/laureates/chemistry-1903 -1 bio. html

Reaction Coordinate Diagram Consider the following reaction coordinate diagram in which NOCl is decomposed to NO and Cl 2. The reactant NOCl has a certain initial energy. In order for products to form, an activation barrier must be overcome, this activation barrier is a the energy of the transition state, or the activated complex. Ea Activation Energy; The minimum energy and conditions necessary for reactant to be converted to products. Activated Complex The intermediate specie that is forms or produced [intermediate]. Eact In the end, the NO and Cl 2 products formed is more energetic than NOCl, the reaction is endothermic. H (+)
![Reaction Coordinate Diagram: Detailed View A(react) +B(react) [A B]* AB (prod)](http://slidetodoc.com/presentation_image_h2/71a5043669d9b40393220858b83df5a9/image-8.jpg "Reaction Coordinate Diagram: Detailed View A(react) +B(react) [A B]* AB (prod)")
Reaction Coordinate Diagram: Detailed View A(react) +B(react) [A B]* AB (prod)

Energy-Level Diagram: Exothermic Vs Endothermic • Consider the reaction two step reaction. Rxn A is exothermic, Rxn B is endothermic. Note that in both examples, it is a two step reaction in which reactant converts to product. The faster step is the one with the lower Eact. The valley in the reaction coordinate correspond to a stable intermediate.

Reaction Rate and Eact • The rate of a reaction is directly correlated to the height of the activation barrier. The higher the Eact, the slower the reaction. Reactions with very low Eact, tend to go very fast In the reaction coordinate diagram: Rxn A is endothermic with a high Eact. Rxn B is exothermic with a lower Eact, and Rxn C is exothermic with a very low Eact. This reaction is very fast. The number of molecules with the minimum kinetic energy large enough to initiate a reaction is related to temperature.

Maxwell-Boltzman Distribution • Recall from the gas laws that an energy profile for molecules can be describe by the Maxwell-Boltzman distribution diagram. As the temperature goes up, the population of molecules with more energy also increases. Fraction of molecules with given speed Maxwell-Boltzmann Simulator Energy Eact The increase of temperature yields to more molecules exceeding the Eact , the minimum energy required to overcome the activation barrier for a reaction to occur. Eact e -Ea/RT

Boltzman Distribution and Rxn Coord. Diagram • The energy of a collection of reactants and the minimum energy necessary to overcome the activation barrier An energy-level diagram of the fraction of collision reaching the activated state. In either direction, the fraction of collision exceeding Eact is greater at higher temperature In general, in an exothermic reaction at any temperature, the fraction of collision exceeding Eact(f) is greater than the fraction exceeding Eact(r). Once the temperature is raised for an exothermic reaction, however the percentage increase of the product molecules overcoming the activation barrier is higher than that of the reactant and therefore Keq decreases and the reaction shifts to the left.

Boltzman Distribution: Endothermic • Similarly, increasing the temperature for an endothermic reaction result in a greater proportion of molecules of the reactant exceeding the activation energy, therefore the rate for becomes more significant than the rate rev. • The temperature increase is more significant for the reactant. Endo: Rate f > Rate r

Boltzman Distribution: Exothermic • Increasing the temperature for an exothermic reaction result in a greater proportion of molecules of the product exceeding the activation energy, therefore the rate rev becomes more significant than the rate for. • The temperature increase is more significant for the product. Temp increase R + Energy Exo: Rate r > Rate f P
 - Expressed the three factors responsible for a reaction")
Arrhenius Equation Savant Arrhenius (1889) - Expressed the three factors responsible for a reaction into an equation (Arrhenius Equation). Factors influence reaction rate: Rate [Collision • Orientation • frequency of molecules Activation ] Energy A - pre-exponential term therefore, Rate = A e -{Ea/RT} • [Conc(react)] = k [Rct] x Where, K - rate constant = A e -{Ea/RT} ‘ Eact = e -{Ea/RT} K = A e -{Ea/RT} ln K = ln A - Ea /RT ln K = - Ea/R (1/T) + ln A y m x b

Graphic Representation: Arrhenius Equation • ln K = - Ea • 1 + ln A • R T where, plot of ln K vs 1/T yields m = -Ea/R m yields Eact ln [A] Ea - Activation Energy R = 8. 314 J/mol • K T = Absolute Temp A = Collision freq. factor ln [K] 1/T Note that as the magnitude of Eact ( ), the K becomes smaller, or the rate constant is smaller. ln K - Ea (minus Ea) The reaction rate decreases as the energy barrier increases For a graph: Eact large, K also large Ln K’ = Ea[1 - 1 ] Eact small, K also small K R [T T’]
![Catalysis Factor • Rate [Collision • • Orientation • frequency Activation Energy] of molecules](http://slidetodoc.com/presentation_image_h2/71a5043669d9b40393220858b83df5a9/image-17.jpg "Catalysis Factor • Rate [Collision • • Orientation • frequency Activation Energy] of molecules")
Catalysis Factor • Rate [Collision • • Orientation • frequency Activation Energy] of molecules • Increase rate by making collision effective: • • Decrease Eact for the reaction • • Increase the steric factor • Catalyst: • A catalyst can serve this purpose in which an external chemical changes the reaction pathway without being consumed. • • • Uncatalyzed reaction Catalyzed reaction A catalyzed reaction proceeds by a different set of steps which involves lowering the Eact. Results: Reaction proceeds at a faster forward rate.

Heterogeneous Catalysis • Catalysis in action: Heterogeneous • In the combustion of gasoline, the reaction • Cx. Hx + N 2 + O 2 2 NO + CO 2 + H 2 O • In addition : • Clean air Act `70 Require • minimum emission. • Possible Mechanism: • 2 NO + 2 CO 2 + N 2 O 2 2 NO 2 (g) (Smog)

Homogeneous Catalysis • Decomposition of Acetic Acid: • • R”COOR’ + H 2 O RCOOH + R’OH R”COOR’ + H 2 O -H+ RCOOH + R’OH Note: The initial and final state (energies) are the same since the energies of compounds are state function. The catalyzed reaction has a lower overall Eact. The decomposition is catalyzed by acid.

Introduction to Molecular Adsorption 1. Diffusional transport of reactants from bulk phase to external catalyst surface 2. Pore diffusion of reactants to internal surface Surface boundary layer Bulk phase reactants 3. Adsorption of reactants 1 3, 4, 5 Catalyst pore 4. Chemical reaction 5. Desorption of products 7 6 2 6. Pore diffusion of products to external surface 3, 4, 5 7. Diffusional transport of products to bulk phase External catalyst surface

Transport phenomena Stagnant gas film Pores Solid Intrareactor transport Interphase transport Porous solid Intrapellet transport Stagnant gas film Flowing bulk gas

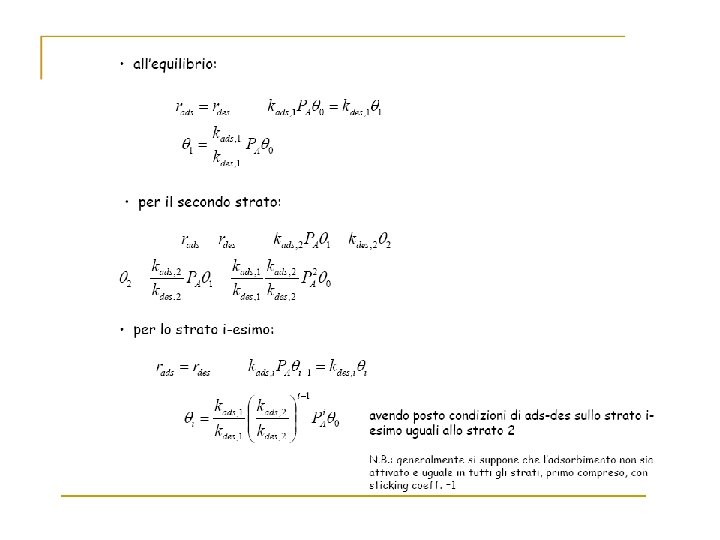
Many surface reactions can be treated successfully on the basis of the following assumptions: 1) the r. d. s. is a reaction of adsorbed molecules; 2) the reaction rate per unit surface area is proportional to , the fraction of surface covered by reactant.

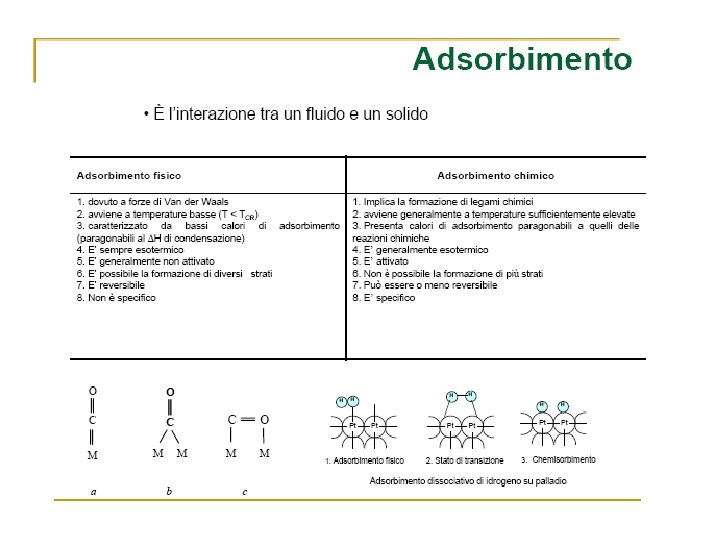
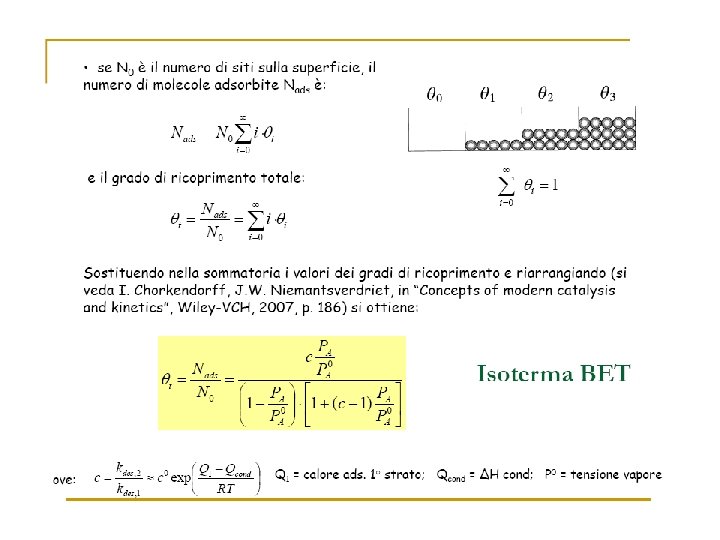
Adsorption and Reaction at Surfaces Adsorption PHYSISORPTION CHEMISORPTION WEAK, LONG RANGE BONDING Van der Waals interactions (e. g. London dispersion, dipole-dipole). . STRONG, SHORT RANGE BONDING Chemical bonding involving orbital overlap and charge transfer. NOT SURFACE SPECIFIC Physisorption takes place between all molecules on any surface providing the temperature is low enough. SURFACE SPECIFIC Marked variation between crystal planes E. g. Chemisorption of hydrogen takes place on transition metals but not on gold or mercury. Hads = 5 …. . 50 k. J mol-1 Related to factors like molecular mass and polarity (i. e. ~ heat of liquefaction) Hads = 50 …. . 500 k. J mol-1 Wide range (related to the chemical bond strength) Non activated with equilibrium achieved relatively quickly. Increasing temperature always reduces surface coverage. Can be activated, in which case equilibrium can be slow and increasing temperature can favour adsorption. No surface reactions. Surface reactions may take place: - Dissociation, reconstruction, catalysis. MULTILAYER ADSORPTION BET Isotherm used to model adsorption equilibrium. MONOLAYER ADSORPTION Langmuir Isotherm used to model adsorption equilibrium. .

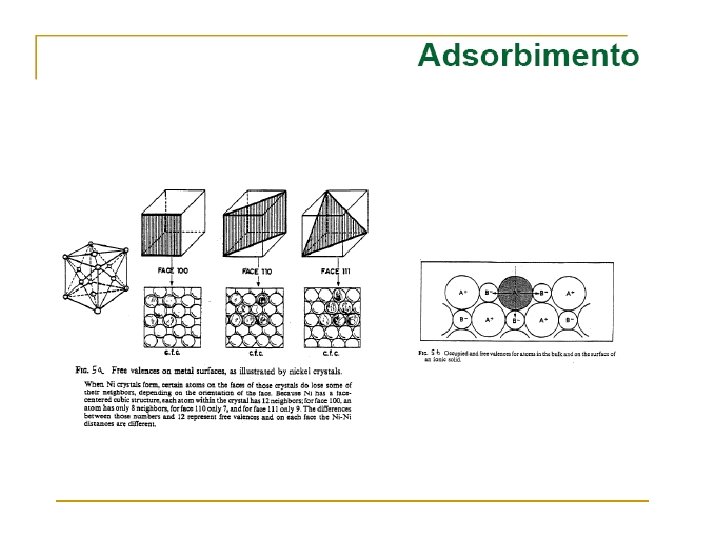
PE Curves & Energetics of Adsorption Simplistic but useful model • the angular orientation of the molecule • changes in the internal bond angles and bond lengths of the molecule • the position of the molecule parallel to the surface plane • presence of any existing adsorbed species (impurities or simply pre-adsorbed molecules).

CASE I - Physisorption e. g. Ar / metals Weak interaction (van der Waals forces) shallow minimum in the PE curve at a relatively large distance from the surface (typically d > 0. 3 nm) before the strong repulsive forces arising from electron density overlap cause a rapid increase in the total energy. There is no barrier to prevent the atom or molecule which is approaching the surface from entering this physisorption well, i. e. the process is not activated and the kinetics of physisorption are invariably fast.

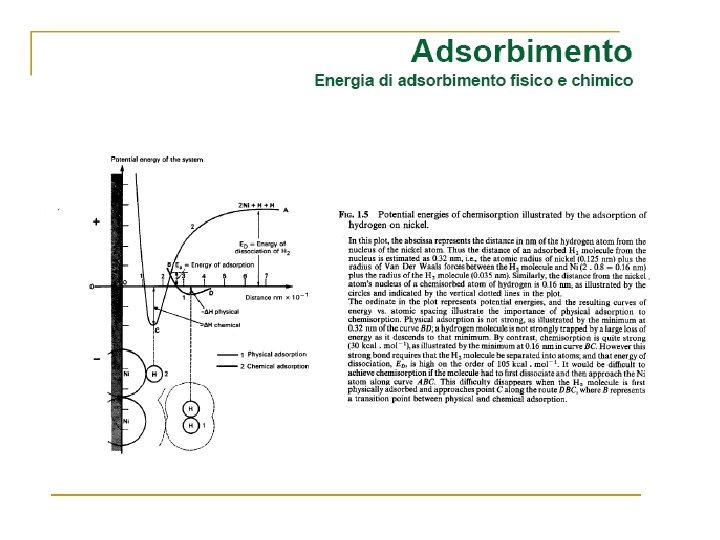
CASE II - Physisorption + Molecular Chemisorption The weak physical adsorption forces and associated long-range attraction will be present to varying degrees in all adsorbate / substrate systems. However, in cases where chemical bond formation between the adsorbate and substrate can also occur, the PE curve is dominated by a much deeper chemisorption minimum at shorter values of d. The graph above shows the PE curves due to physisorption and chemisorption separately - in practice, the PE curve for any real molecule capable of undergoing chemisorption is best described by a combination of the two curves, with a curve crossing at the point at which chemisorption forces begin to dominate over those arising from physisorption alone.

The depth of the chemisorption well is a measure of the strength of binding to the surface - in fact it is a direct representation of the energy of adsorption, whilst the location of the global minimum on the horizontal axis corresponds to the equilibrium bond distance (re ) for the adsorbed molecule on this surface. The energy of adsorption is negative, and since it corresponds to the energy change upon adsorption it is better represented as DE(ads) or DEads. However, you will also often find the depth of this well associated with the enthalpy of adsorption, DH(ads). the "heat of adsorption" , Q , is taken to be a positive quantity equal in magnitude to the enthalpy of adsorption ; i. e. Q = -DH(ads) In this particular case, there is clearly no barrier to be overcome in the adsorption process and there is no activation energy of adsorption (i. e. Eaads = 0 , but do remember the previously mentioned limitations of this simple 1 D model).

There is of course a significant barrier to the reverse, desorption process - the red arrow in the diagram below represents the activation energy for desorption. The magnitudes of the energy of adsorption and the activation energy for desorption can also be equated i. e. Eades = DE (ads) or Eades ~ -DH (ads)
")
CASE III - Physisorption + Dissociative Chemisorption H 2 H + H [ D(H-H) ] = 435 k. J mol-1 or 4. 5 e. V.

Transient physisorption - a state from which it can then either desorb back as a molecule into the gas phase or cross over the barrier into the dissociated, chemisorptive state. In this latter case, the molecule can be said to have undergone "precurs -mediated" chemisorption.

No direct activation barrier to dissociative adsorption - the curve crossing is below the initial "zero energy" of the system. There is a substantial barrier to chemisorption. Such a barrier has a major influence on the kinetics of adsorption.
")
Relationship between the activation energies for adsorption and desorption, and the energy (or enthalpy) of adsorption. Eades - Eaads = - DEads but, since the activation energy for adsorption is nearly always very much smaller than that for desorption, and the difference between the energy and enthalpy of adsorption is also very small, it is still quite common to see the relationship Eades ~ -DHads
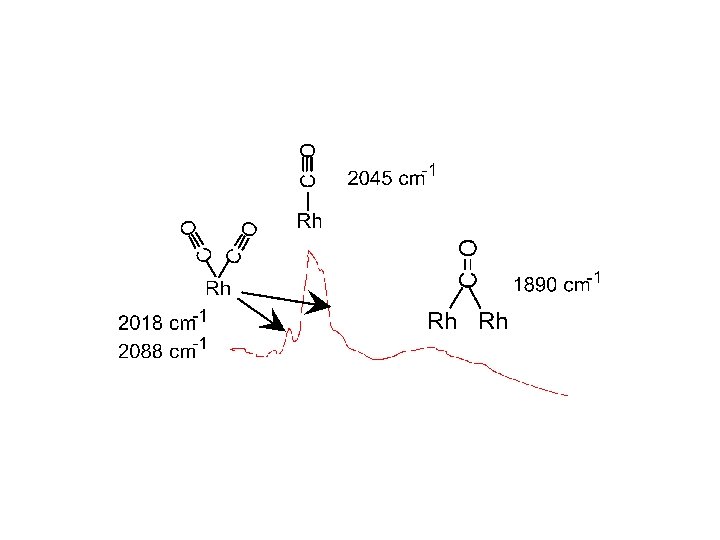
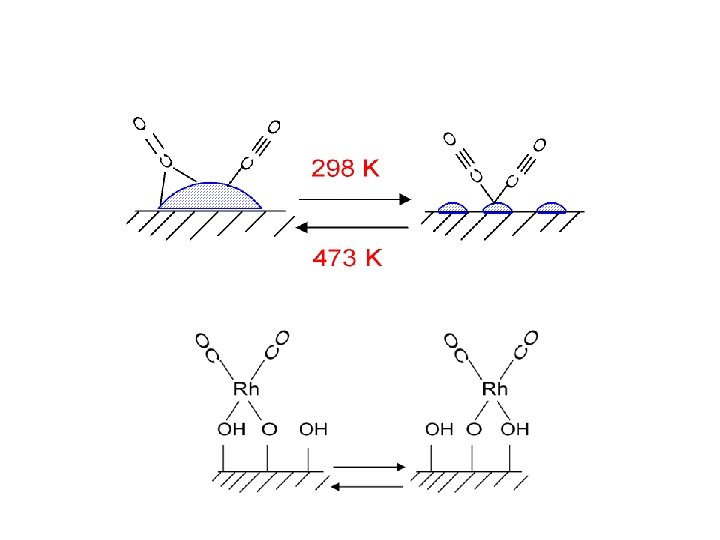
 Adsorption of CO on Metal Surfaces. • orientation of the molecule • coordinated")
(1) Adsorption of CO on Metal Surfaces. • orientation of the molecule • coordinated to one, two or three metal atoms Terminal "Linear" (all surfaces) Bridging 2 f site (all surfaces) Bridging 3 f hollow ( fcc(111) ) Bridging 4 f hollow (rare fcc(100) ? ) • interactions between the adsorbed CO molecules at high coverages. • dissociation / temperature
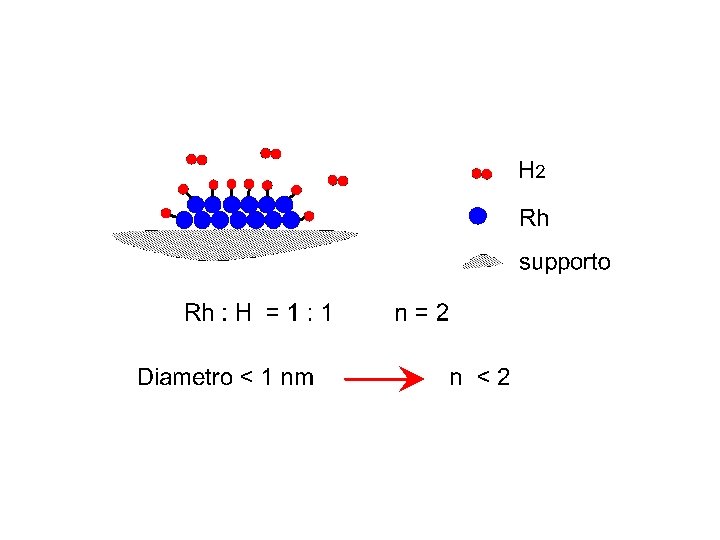
 Adsorption of Hydrogen on W(100) • the chemisorption of hydrogen on tungsten is")
(2) Adsorption of Hydrogen on W(100) • the chemisorption of hydrogen on tungsten is entirely dissociative and, as noted previously, the physisorption well is extremely shallow. • the ideal (100) surface plane of tungsten (a bcc metal) has a regular square array of tungsten atoms. and we will only look at the zero coverage limit (i. e. adsorption on the clean surface) with the molecule approaching along the surface normal. We will, however, now extend the 1 D model to consider the effect of two additional variables as the molecule approaches the surface 1. the angular orientation of the molecule (with the limitation that the molecular axis will only be permitted to be either parallel or perpendicular to the surface plane) 2. the lateral position on the surface (with the limitation that the molecule will be considered either to be approaching directly towards a W atom (approaching the "atop site") or directly towards a "bridging site" located between two surface W atoms)

A. Hydrogen molecule approaching the W Surface end-on A 1. When the hydrogen molecule approaches end -on to an atop site (i. e. from directly above a W atom) the potential energy increases rapidly for a molecule/surface separation of less than 2. 3 Å. The molecule is therefore repelled from the surface. When the hydrogen molecule approaches endon to a bridging site the potential energy increases slowly and although some lengthening of the H-H bond may occur with little corresponding increase in energy, there is no facile dissociation channel and the molecule is weakly repelled from the surface.

B. Hydrogen molecule approaching the W Surface broadside -on. B 1. When the hydrogen molecule approaches broadside-on to an atop site then the molecule may dissociate with considerable energy gain and there is no activation barrier to this process (i. e. the potential energy surface is strongly attractive). The deep well in the lower right corner corresponds to the hydrogen atoms produced by dissociation entering the bridge sites of the W surface. B 2. When the hydrogen molecule approaches broadside-on to a bridge site then the molecule may again dissociate but the energy gain as the hydrogen atoms enter the atop sites is less marked than in the previous case (B 1) and there is an activation barrier of ca. 0. 2 e. V that must be overcome for dissociation to occur.

The molecular orientation and the point of impact on the surface can have a dramatic effect on the nature of the molecule-surface interaction and hence the dissociation probability. In the case of the H 2 -W system they indicate that the most favoured channel to dissociative adsorption is for a molecule approaching broadside on to an atop site, with dissociation of the hydrogen into the adjacent bridging sites.
. Molecular adsorption state the")
Oxygen Generally dissociative adsorption Molecular adsorption (e. g. Ag, Pt). Molecular adsorption state the interaction between the molecule and the surface is relatively weak. Molecules aligned such that the internuclear axis is parallel to the surface plane may bond to a single metal atom of the surface via both 1. s-donor interaction, in which the charge transfer is from the occupied molecular p-bonding molecular orbital of the molecule into vacant orbitals of s-symmetry on the metal (i. e. M O 2 ), and 2. p-acceptor interaction, in which an occupied metal d-orbital of the correct symmetry overlaps with empty p* orbitals of the molecule and the charge transfer is from the surface to the molecule (i. e. M O 2 ).

Although the interaction of the molecule with the surface is generally weak, one might expect that there might be a substantial barrier to dissociation due to the high strength (and high dissociation enthalpy) of the O=O bond. Nevertheless on most metal surfaces, dissociation of oxygen is observed to be facile which is related to the manner in which the interaction with the surface can mitigate the high intrinsic bond energy and thereby facilitate dissociation. Once formed, oxygen atoms are strongly bound to the surface and, as noted previously, will tend to occupy the highest available co-ordination site. The strength of the interaction between adsorbate and substrate is such that the adjacent metal atoms are often seen to undergo significant displacements from the equilibrium positions that they occupy on the clean metal surface. This displacement may simply lead to a distortion of the substrate surface in the immediate vicinity of the adsorbed atom (so that, for example, the adjacent metal atoms are drawn in towards the oxygen and the metal-oxygen bond distance is reduced) or to a more extended surface reconstruction.

Dissociative oxygen adsorption is frequently irreversible - rather than simply leading to desorption, heating of an adsorbed oxygen overlayer often results in either the gradual removal of oxygen from the surface by diffusion into the bulk of the substrate (e. g. Si(111) or Cu(111)) or to the formation of a surface oxide compound. Even at ambient temperatures, extended oxygen exposure often leads to the nucleation of a surface oxide. Depending on the reactivity of the metal concerned, further exposure at low temperatures may result either in a progressive conversion of the bulk material to oxide or the oxidation process may effectively stop after the formation of a passivating surface oxide film of a specific thickness (e. g. Al).

Chemisorption of Ammonia and other Group V/VI Hydrides Ammonia has lone pairs available for bonding on the central nitrogen atom and may bond without dissociation to a single metal atom of a surface, acting as a Lewis base, to give a pseudo-tetrahedral co-ordination for the nitrogen atom. Alternatively, progressive dehydrogenation may occur to give surface NHx (x = 2, 1, 0) species and adsorbed hydrogen atoms, i. e. NH 3 ® NH 2(ads) + H(ads) ® NH(ads) + 2 H(ads) ® N(ads) + 3 H(ads) As the number of hydrogens bonded to the nitrogen atom is reduced, the adsorbed species will tend to move into a higher co-ordination site on the surface (thereby tending to maintain the valence of nitrogen).
 surface Other Group V and Group VI")
Decomposition fragments of ammonia on an fcc(111) surface Other Group V and Group VI hydrides (e. g. PH 3 H 2 O, H 2 S) exhibit similar adsorption characteristics to ammonia ,
 all tend")
Chemisorption of Unsaturated Hydrocarbons Unsaturated hydrocarbons (alkenes, alkynes, aromatic molecules etc. ) all tend to interact fairly strongly with metal atom surfaces. At low temperatures (and on less reactive metal surfaces) the adsorption may be molecular, albeit perhaps with some distortion of bond angles around the carbon atom. Ethene, for example, may bond to give both a p-complex (A) or a di-s adsorption complex (B): (A) Chemisorbed Ethene (B)
 Studies of ethylene (ethene) and acetylene")
Models of chemisorbed ethene and ethyne on Cu(111) Studies of ethylene (ethene) and acetylene (ethyne) chemisorbed on Cu(111), a surface with which they interact relatively weakly, have led to the following proposed structures for the molecular adsorption complexes. A. Plan view of the Cu(111) surface showing the adsorption geometry of athylene and acetylene molecules at low temperatures.
 surface with an adsorbed acetylene molecule, illustrating the")
B. Perspective view of the Cu(111) surface with an adsorbed acetylene molecule, illustrating the rehybridisation of the carbon centres to a geometry more closely associated with a C=C double-bond configuration.

As the temperature is raised, or even at low temperatures on more reactive surfaces (in particular those that bind hydrogen strongly), a stepwise dehydrogenation may occur. One particularly stable surface intermediate found in the dehydrogenation of ethene is the ethylidyne complex, whose formation also involves H-atom transfer between the carbon atoms. Ethylidyne : this adsorbate preferentially occupies a 3 -fold hollow site to give pseudo-tetrahedral coordination for the carbon atom. The ultimate product of complete dehydrogenation, and the loss of molecular hydrogen by desorption, is usually either carbidic or graphitic surface carbon.

Adsorption Kinetics - The Rate of Adsorption Rads = k C x Rads = k' P x x - kinetic order k - rate constant k' - rate constant C - gas phase concentration P - partial pressure of molecule Rads = A C x exp ( -Ea / RT ) Ea is the activation energy for adsorption A the pre-exponential (frequency) factor

The Desorption Process An adsorbed species present on a surface at low temperatures may remain almost indefinitely in that state. As the temperature of the substrate is increased, however, there will come a point at which thermal energy of the adsorbed species is such that one of several things may occur : 1. a molecular species may decompose to yield either gas phase products or other surface species. 2. an atomic adsorbate may react with the substrate to yield a specific surface compound, or diffuse into the bulk of the underlying solid. 3. the species may desorb from the surface and return into the gas phase. The last of these options is the desorption process. In the absence of decomposition the desorbing species will generally be the same as that originally adsorbed but this is not necessarily always the case.

Desorption Kinetics The rate of desorption, Rdes , of an adsorbate from a surface can be expressed in the general form : Rdes = k N x x - kinetic order of desorption k - rate constant for the desorption process N - surface concentration of adsorbed species The order of desorption can usually be predicted because we are concerned with an elementary step of a "reaction" : specifically, I. Atomic or Simple Molecular Desorption A(ads) A(g) M(ads) M(g) - will usually be a first order process ( i. e. x = 1 ). Examples include … W / Cu (ads) W (s) + Cu (g) ; desorption of Cu atoms from a W surface Cu / CO (ads) Cu (s) + CO (g) ; desorption of CO molecules from a Cu surface
 A 2 (g) - will usually be")
II. Recombinative Molecular Desorption 2 A (ads) A 2 (g) - will usually be a second order process ( i. e. x = 2 ). Examples include … Pt / O (ads) Pt (s) + O 2 (g) ; desorption of O atoms as O 2 from a Pt surface Ni / H (ads) Ni (s) + H 2 (g) ; desorption of H atoms as H 2 from a Ni surface

The rate constant for the desorption process may be expressed in an Arrhenius form, kdes = A exp ( -Eades / RT ) where Eades is the activation energy for desorption

Langmuir 1 Langmuir Isotherm An isotherm describes the dependence of volume, concentration , or in the case of a surface, coverage q, on pressure p at constant temperature T at equilibrium. q = [ƒ(p)]T In the equilibrium between the gas phase and the adsorbed phase, Le. Chatelier's Principle predicts that at constant temperature an increase in pressure will increase the number of molecules adsorbed on the surface since the volume occupied by the molecules at the surface (per mole) is smaller. This can, however, reach a limiting value. The number of molecules adsorbed at any pressure p will also depend on the strength of the adsorbate bond to the surface. p q

Langmuir 2 Langmuir Isotherm The Langmuir Adsorption Isotherm was derived by Irving Langmuir in 1918 in an attempt to describe the chemisorption of atoms or molecules at a surface: “In general, we should look upon the surface as consisting of a checkerboard. . . . ” “finite number of equivalent adsorption sites”

Langmuir 3 Langmuir Isotherm Langmuir’s “checkerboard” model of chemisorption assumes that a surface is composed of a finite number of equivalent adsorption sites. So the maximum coverage is obtained when all sites are filled. The coverage is expressed in terms of the number of molecules adsorbed in relation to the number of available sites. i. e. When all sites are filled, = 1. p Consider the equilibrium: Agas kads Aadsorbed The Rate of adsorption is proportional to: 1) The number of surface collisions n from the gas phase per second, which is proportional to the pressure p. 2) area of bare surface available for adsorption (1 - ). ie. rate of adsorption = kads p (1 - )

Langmuir 4 Langmuir Isotherm Langmuir’s “checkerboard” model of chemisorption assumes that a surface is composed of a finite number of equivalent adsorption sites. So the maximum coverage is obtained when all sites are filled. The coverage is expressed in terms of the number of molecules adsorbed in relation to the number of available sites. i. e. When all sites are filled, = 1. p Consider the equilibrium: Agas Aadsorbed kdes Rate of desorption proportional to: 1) the fraction of surface covered by adsorbate . i. e rate of desorption = kdes

Langmuir 5 At equilibrium =1 Rate of adsorption = Rate of desorption kads p (1 - ) = kdes b = 100 b = 50 b = 10 If we write b = kads / kdes p = bp / (1+bp) ………. . The Langmuir Isotherm Since b = kads / kdes , this is the same as an equilibrium constant K And since ln K = - G/RT one can write: b = exp (- G/RT ), i. e b reflects the strength of the adsorbate bond to the surface.

Langmuir 6 At equilibrium =1 Rate of adsorption = Rate of desorption kads p (1 - ) = kdes b = 100 b = 50 b = 10 If we write b = kads / kdes p = bp / (1+bp) ………. . The Langmuir Isotherm The equation above can be linearised for testing of experimental data by inversion ; Since = nads / nmax p / nads = 1 / b nmax + p / nmax

Langmuir-limit Langmuir Isotherm Limitations and approximations “finite number of equivalent adsorption sites” X different surface adsorbate structures surface reconstruction

Langmuir-limit Langmuir Isotherm Limitations and approximations “finite number of equivalent adsorption sites” X lateral interactions between adsorbates Enthalpy of adsorption Hads depends on site/coverage

Precursor kinetics Langmuir Isotherm Limitations and approximations rate of adsorption = kads p (1 - ) X rate of adsorption i. e. sticking probability (S) assumes collision at a vacant site is required for adsorption precursor kinetics S a (1 - )

Transition State Model and Catalyst Activity The Volcano Plot transition state #hom Langmuir-Hinshelwood Kinetics Adsorption of reactants and desorption of products are very fast. Eads and Edes very small. #het Ehom potential energy Surface Reaction is RDS: Ehet Eads reactants Ehet products adsorbed reactants Edes adsorbed products reaction co-ordinate

Langmuir-Hinshelwood I: unimolecular surface reactions rate = khet QA = khet Langmuir-Hinshelwood p. A B A b. Ap. A / (1+b. Ap. A) fast RDS khet QA rate QA = 1 Limit Low pressure (p) low enthalpy of adsorption (b) b. Ap. A << 1 rate = khet b. A p. A kexp ……. . first order p. A Limit High pressure (p) high enthalpy of adsorption (b) b. Ap. A >> 1 rate = khet kexp ……. . zero order fast

Langmuir-Hinshelwood II: bimolecular surface reactions Langmuir-Hinshelwood p. A rate = khet A B AB p A B fast A RDS Q k het fast B rate For constant PB Rate limited by surface concentration of A B Rate limited by surface concentration of B p. A B >> A B << A

Eley-Rideal bimolecular surface reactions Eley-Rideal p. A An adsorbed molecule may react directly with an impinging gas molecule by a collisional mechanism A B B RDS khet A rate = khet A p. B = khet b. Ap. A p. B / (1+b. Ap. A) AB p fast Note: For constant p. A, the rate is always first order wrt p. B rate A = 1 Limit Low pressure (p) low enthalpy of adsorption (b) For constant PB p. A Limit High pressure (p) high enthalpy of adsorption (b) b. Ap. A << 1 rate = khet b. A p. B ……. . first order in A kexp b. Ap. A >> 1 rate = khet p. B ……. . zero order in A kexp

Volcano Plot 1 Transition State Model and Catalyst Activity The Volcano Plot There is often a relationship between CATALYTIC ACTIVITY ( Ehet ) and strength of chemisorption of reactants Hads. potential energy #het Eads reactants Ehet Hads products adsorbed reactants Edes adsorbed products reaction co-ordinate
 16")
Volcano Plot 3 The Volcano Plot Rootsaert & Sachtler: Zphys. Chem. 26 (1960) 16 Ir 400 Pt Tr /K Ru Pd Rh Ag Ni Cu 500 Fe Co Au W 600 40 60 80 When - Hads is small bp << 1 Q = bp a exp ( - Gads/RT ) a exp ( - Hads/RT ) Increasing – Hads will increase Q and hence rate. Ehet remains unchanged. 100 - Hads 120 When - Hads is large bp >> 1, and Q = 1 Increasing – Hads starts to increase Ehet and rate decreases (adsorbates too stable to react.

Volcano Plot 2 Transition State Model and Catalyst Activity The Volcano Plot Formic Acid Decomposition potential energy HCOOHa reactants #het Ehet Hads Ehet CO 2 + H 2 products Limit of weak chemisorption Limit of strong chemisorption CO 2 a + 2 Ha HCOOa + Ha reaction co-ordinate Ehet
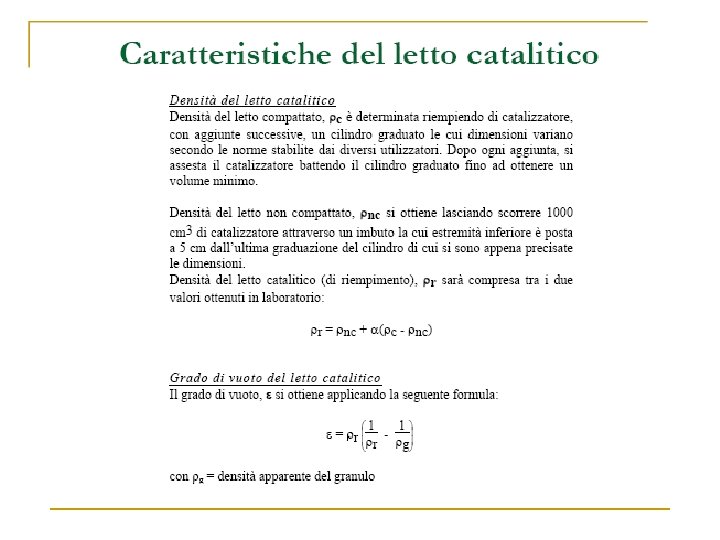
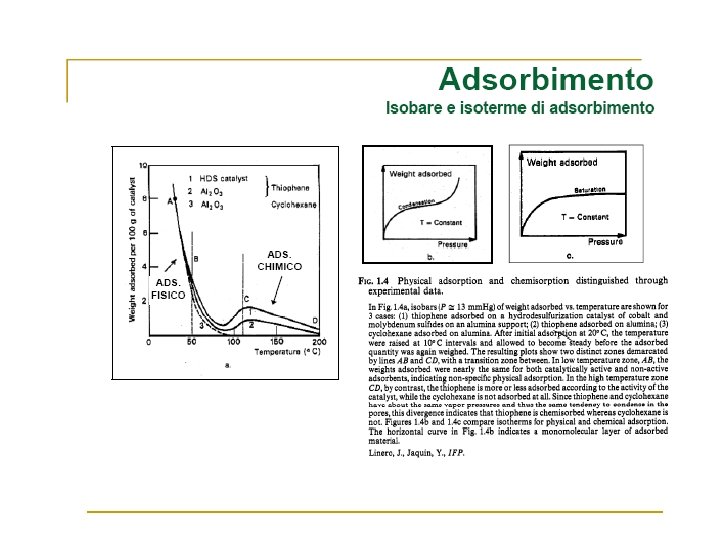
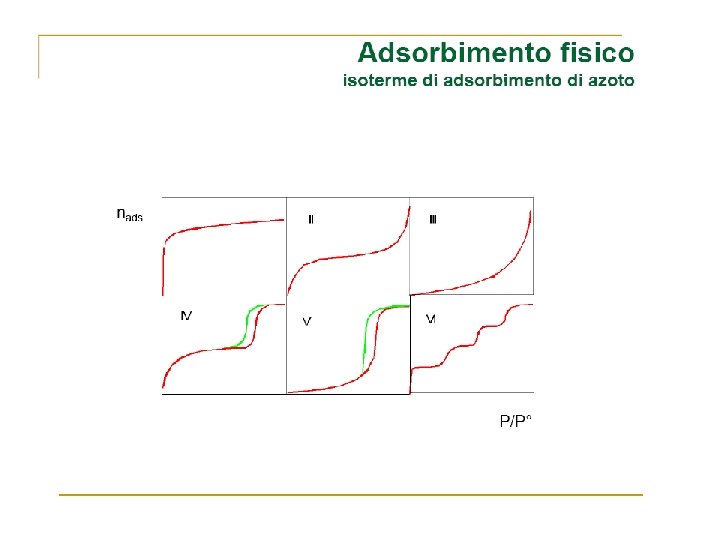
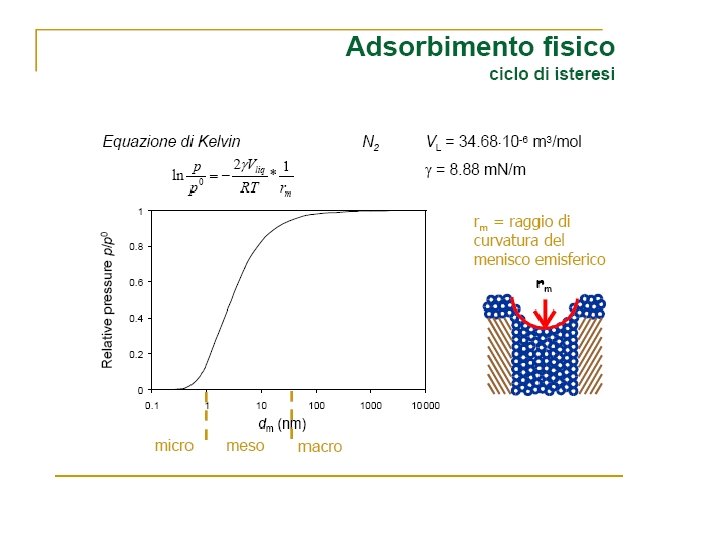
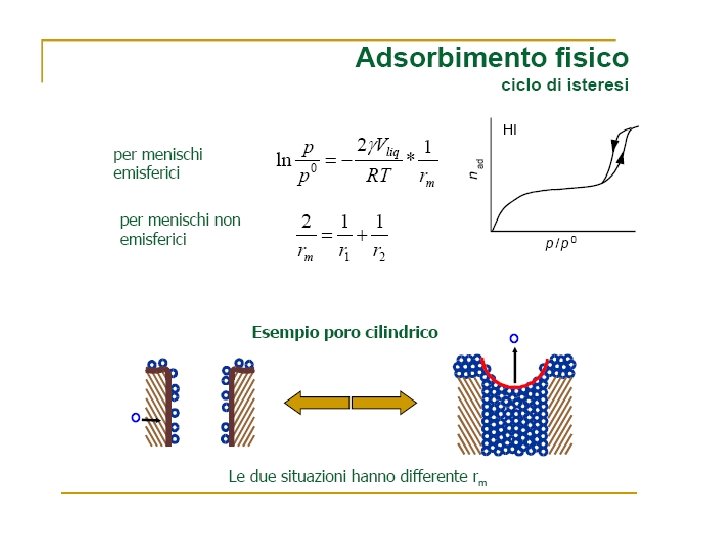

Volume Gas adsorbito Zona di saturazione Pressione

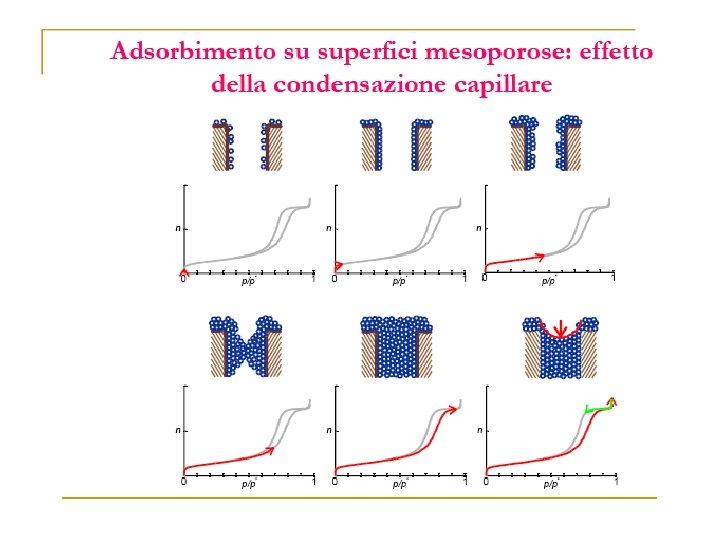
Adsorbimento sul supporto

Adsorbimento sul supporto

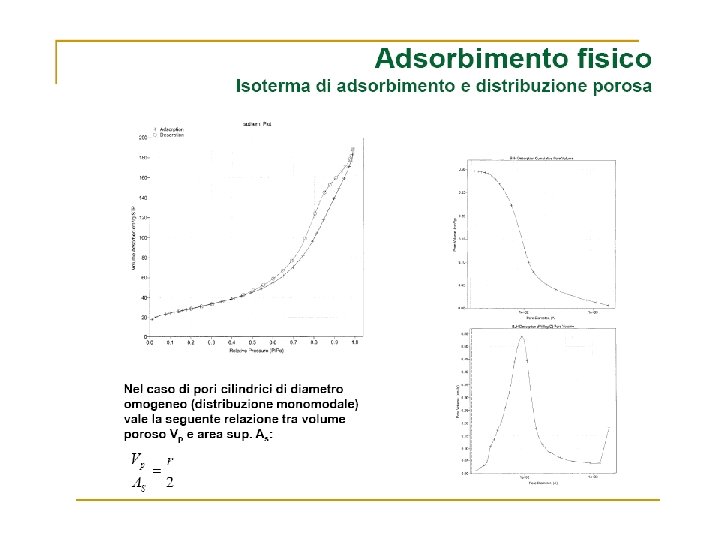
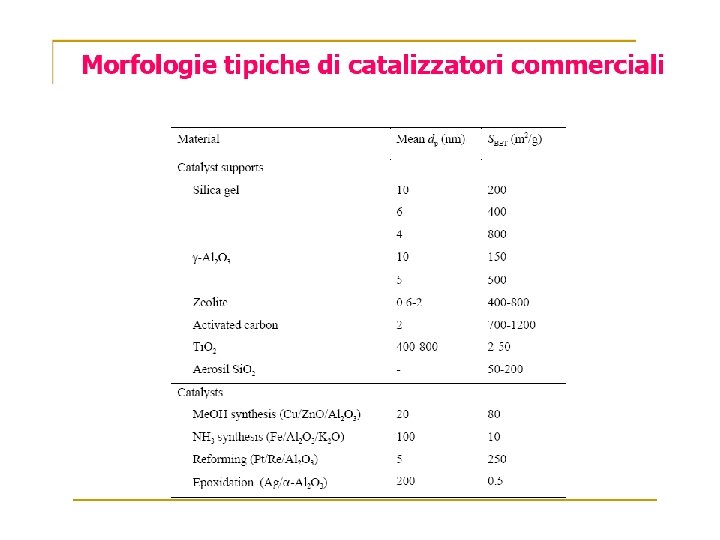
1. 1% Pt/g-Al 2 O 3 Adsorbimento a 573 K di H 2. Curva (a) adsorbimento su 2. 031 g di catalizzatore, (c) adsorbimento su 1. 00 g di Al 2 O 3, (d) adsorbimento su quantità di supporto corrispondente a quella del campione (2. 00 g) ed espressa nella stessa scala della curva (a), (b) differenza tra la curva a e d.

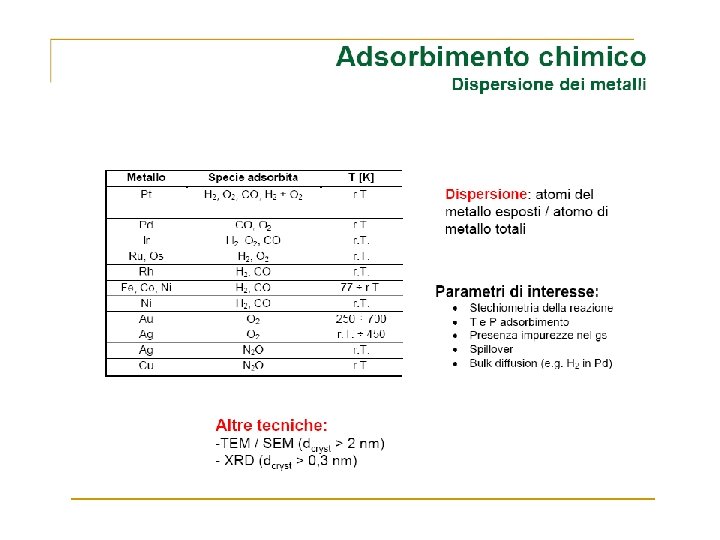
Dispersione metallica numero di atomi superficiali di metallo numero totale di atomi di metallo. Diametro medio delle particelle metalliche ( geometria sferica) = 6 V/A l'area media occupata da un atomo di metallo è il volume di un atomo di metallo nel "bulk". peso atomico del metallo, la sua densità numero di Avogadro.
- Slides: 107