
Acoustic emission as physical phenomenon basic knowledge physical
Acoustic emission as physical phenomenon: basic knowledge, physical aspects and methodology Kristián Máthis Department of Physics of Materials Faculty of Mathematics and Physics, Charles University, Prague, Czech Republic

Charles University • • • Founded in 1348 17 faculties (incl. Faculty of Mathematics and Physics) Approx. 55. 000 students (the largest university in Czech Republic) 3 alumni were awarded by Nobel-prize (1 x chemistry, 2 x medicine) Famous teachers: Christian Doppler, Ernst Mach, Albert Einstein, Bernard Bolzano, Jaroslav Heyrovský Faculty of Mathematics and Physics • Approx. 2000 students • It has the highest scientific output in Czech Republic
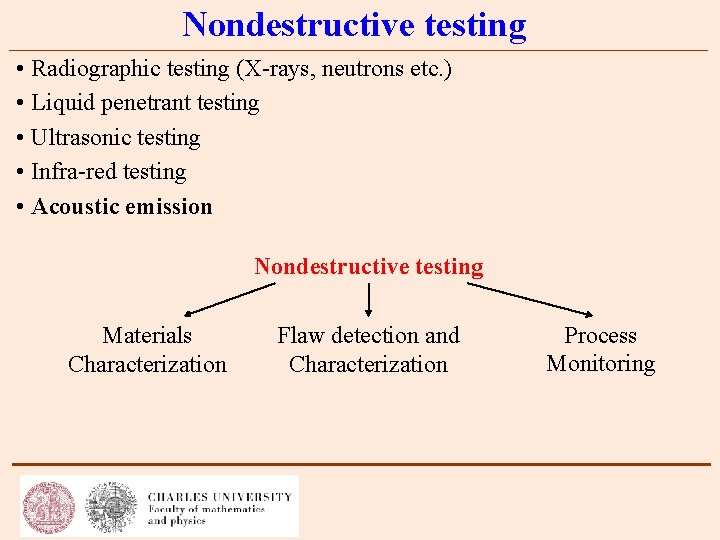
Nondestructive testing • Radiographic testing (X-rays, neutrons etc. ) • Liquid penetrant testing • Ultrasonic testing • Infra-red testing • Acoustic emission Nondestructive testing Materials Characterization Flaw detection and Characterization Process Monitoring

What is acoustic emission? Acoustic emissions are transient elastic waves generated by the rapid release of energy from localized sources within the material. (ASTM E 610 -82) Source: http: //www. ndt-ed. org/
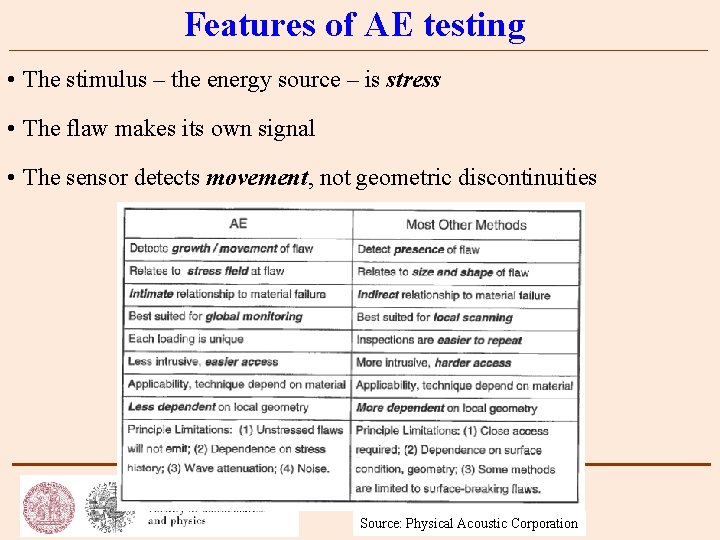
Features of AE testing • The stimulus – the energy source – is stress • The flaw makes its own signal • The sensor detects movement, not geometric discontinuities Source: Physical Acoustic Corporation

Why acoustic emission? Advantages • Real-time, non-destructive method • Suited for global monitoring – information from the entire volume • Detects movement/growth of defects (e. g. dislocations, twins, cracks) • Intimate relationship to material failure Limitations • Dependence on stress history • Unstressed defects will not emit • Wave attenuation and noise

Audible AE in nature SOUND OF DANGER earthquake, avalanche, landslide, ice cover cracking Ice cracking source: Youtube Earthquake in Japan source: Youtube
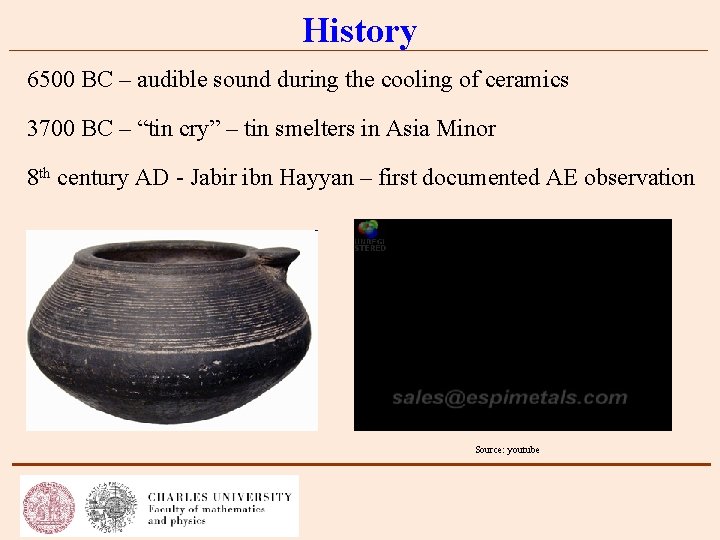
History 6500 BC – audible sound during the cooling of ceramics 3700 BC – “tin cry” – tin smelters in Asia Minor 8 th century AD - Jabir ibn Hayyan – first documented AE observation Source: youtube

Modern history 1916 – J. Czochralski – relationship between tin cry (twinning) and AE 1948 – W. P. Mason, H. J. Mc. Skimin, W. Shockley – link between moving dislocations and AE 1950 – J. Kaiser – Ph. D thesis TU München: "Results and Conclusions from Measurements of Sound in Metallic Materials under Tensile Stress” Joseph Kaiser
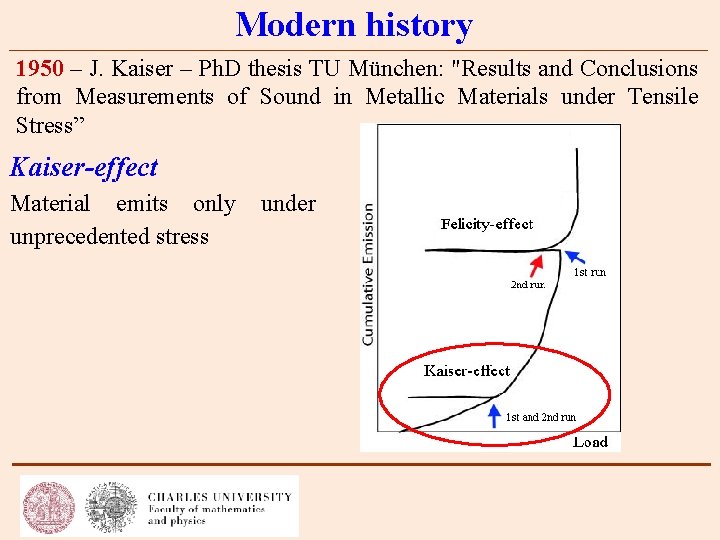
Modern history 1950 – J. Kaiser – Ph. D thesis TU München: "Results and Conclusions from Measurements of Sound in Metallic Materials under Tensile Stress” Kaiser-effect Material emits only unprecedented stress under
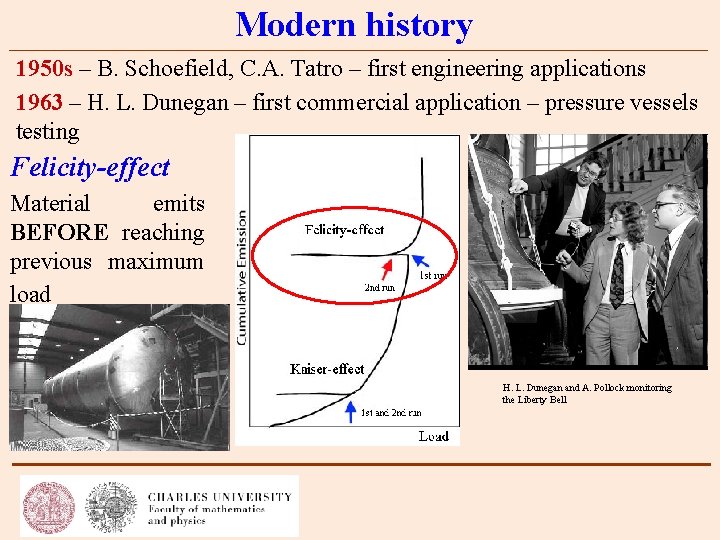
Modern history 1950 s – B. Schoefield, C. A. Tatro – first engineering applications 1963 – H. L. Dunegan – first commercial application – pressure vessels testing Felicity-effect Material emits BEFORE reaching previous maximum load H. L. Dunegan and A. Pollock monitoring the Liberty Bell
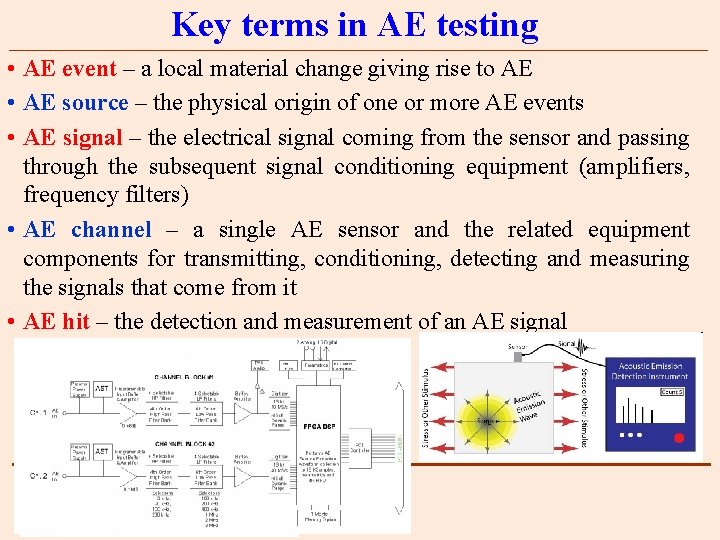
Key terms in AE testing • AE event – a local material change giving rise to AE • AE source – the physical origin of one or more AE events • AE signal – the electrical signal coming from the sensor and passing through the subsequent signal conditioning equipment (amplifiers, frequency filters) • AE channel – a single AE sensor and the related equipment components for transmitting, conditioning, detecting and measuring the signals that come from it • AE hit – the detection and measurement of an AE signal
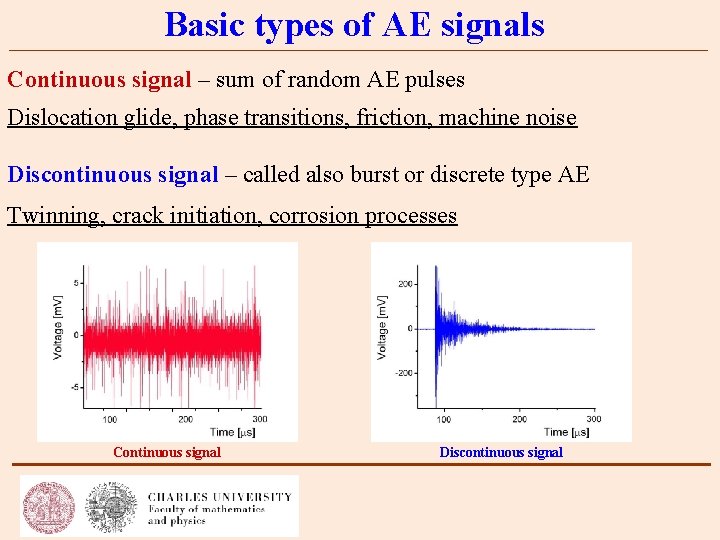
Basic types of AE signals Continuous signal – sum of random AE pulses Dislocation glide, phase transitions, friction, machine noise Discontinuous signal – called also burst or discrete type AE Twinning, crack initiation, corrosion processes Continuous signal Discontinuous signal
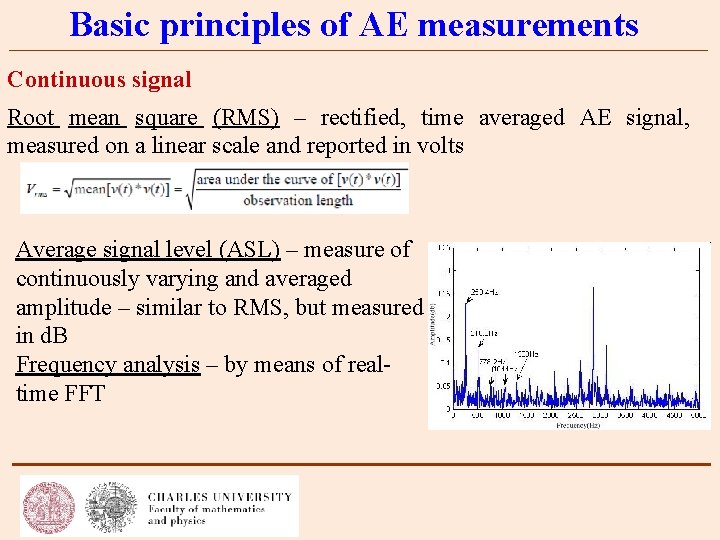
Basic principles of AE measurements Continuous signal Root mean square (RMS) – rectified, time averaged AE signal, measured on a linear scale and reported in volts Average signal level (ASL) – measure of continuously varying and averaged amplitude – similar to RMS, but measured in d. B Frequency analysis – by means of realtime FFT
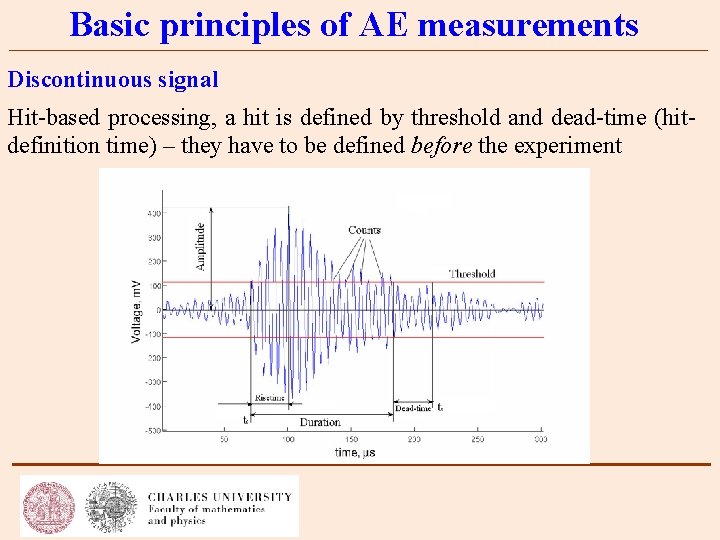
Basic principles of AE measurements Discontinuous signal Hit-based processing, a hit is defined by threshold and dead-time (hitdefinition time) – they have to be defined before the experiment
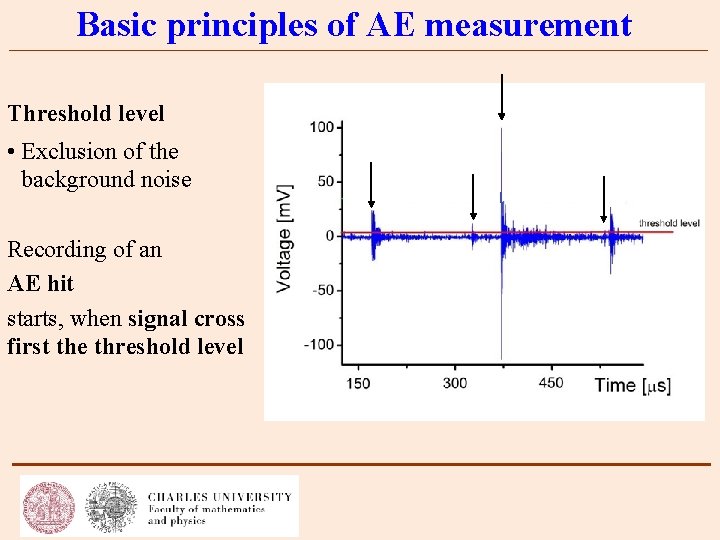
Basic principles of AE measurement Threshold level • Exclusion of the background noise Recording of an AE hit starts, when signal cross first the threshold level
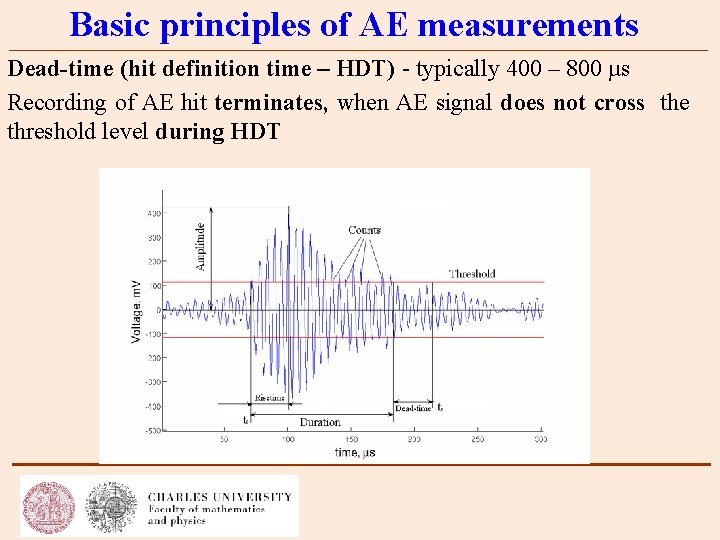
Basic principles of AE measurements Dead-time (hit definition time – HDT) - typically 400 – 800 µs Recording of AE hit terminates, when AE signal does not cross the threshold level during HDT
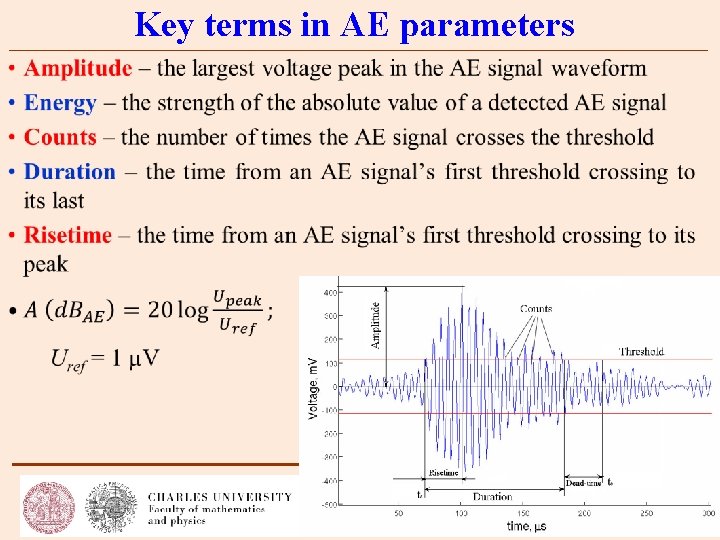
Key terms in AE parameters •
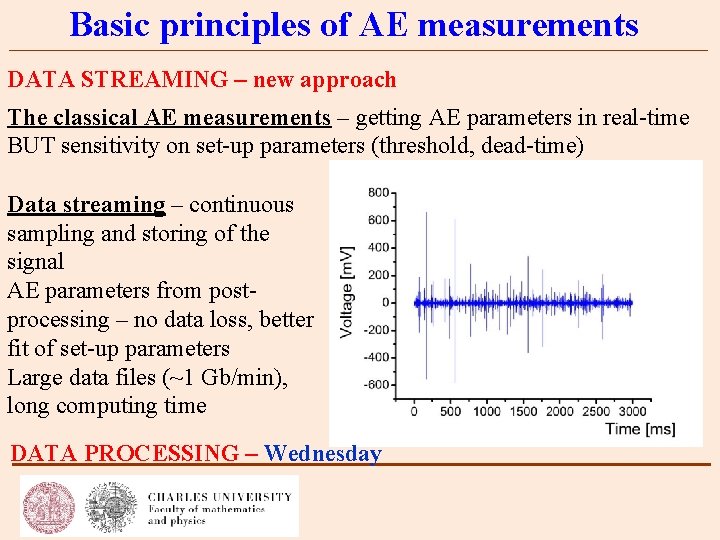
Basic principles of AE measurements DATA STREAMING – new approach The classical AE measurements – getting AE parameters in real-time BUT sensitivity on set-up parameters (threshold, dead-time) Data streaming – continuous sampling and storing of the signal AE parameters from postprocessing – no data loss, better fit of set-up parameters Large data files (~1 Gb/min), long computing time DATA PROCESSING – Wednesday
AE sources • Material sources – dislocation movement – twinning – fracture; phase transformation (martensite – austenite) • Corrosion sources – gas evolution (bubbles breaking away) – hydrogen induced cracking – corrosion products breaking, disbonding from surface • Noise – electromagnetic interference (ground loops, power switching etc. ) – acoustical (friction, impact, flow (leaks, pumps)) – electronic (in the AE device)
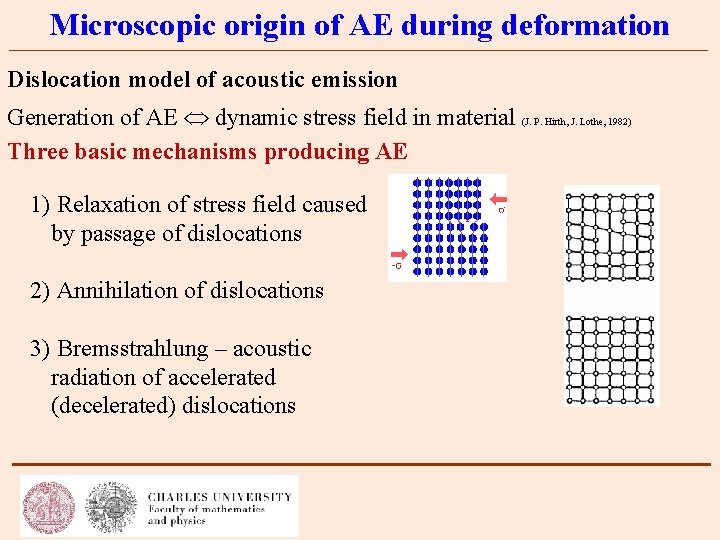
Microscopic origin of AE during deformation Dislocation model of acoustic emission Generation of AE dynamic stress field in material (J. P. Hirth, J. Lothe, 1982) Three basic mechanisms producing AE 1) Relaxation of stress field caused by passage of dislocations 2) Annihilation of dislocations 3) Bremsstrahlung – acoustic radiation of accelerated (decelerated) dislocations
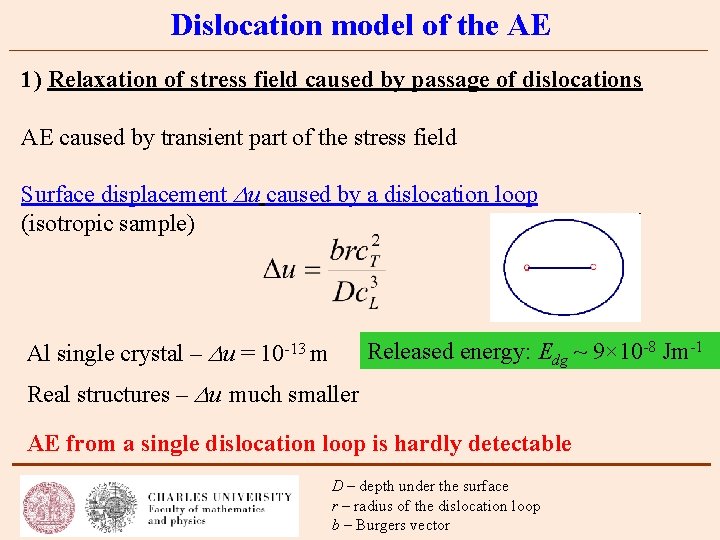
Dislocation model of the AE 1) Relaxation of stress field caused by passage of dislocations AE caused by transient part of the stress field Surface displacement u caused by a dislocation loop (isotropic sample) Al single crystal – u = 10 -13 m Released energy: Edg ~ 9× 10 -8 Jm-1 Real structures – u much smaller AE from a single dislocation loop is hardly detectable D – depth under the surface r – radius of the dislocation loop b – Burgers vector

Dislocation model of the AE 2) Annihilation of dislocations Released energy during annihilation of a dislocation pair For Al single crystal: Ean ~ 3× 10 -10 Jm-1 (c. f. E dg ~ 9× 10 -8 Jm-1) – density of the material u – velocity of the dislocations before annihilation d – grain size – =1 for screw disl. and 1+(c. T + c. L)4 for edge disl.
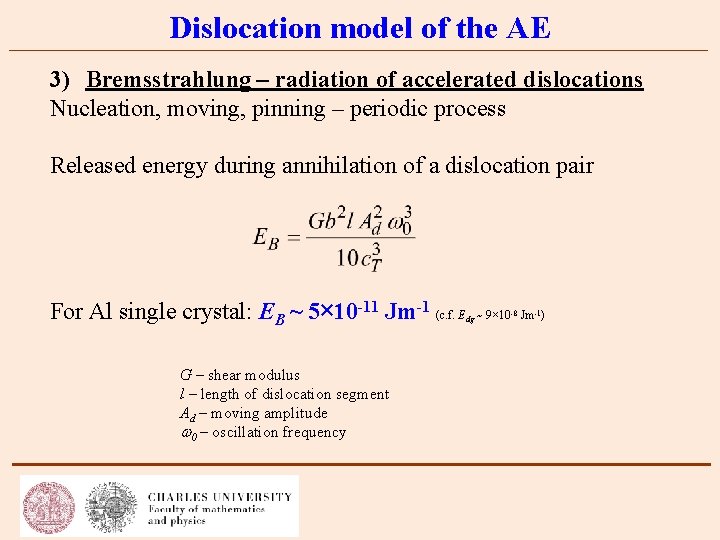
Dislocation model of the AE 3) Bremsstrahlung – radiation of accelerated dislocations Nucleation, moving, pinning – periodic process Released energy during annihilation of a dislocation pair For Al single crystal: EB ~ 5× 10 -11 Jm-1 (c. f. E G – shear modulus l – length of dislocation segment Ad – moving amplitude 0 – oscillation frequency dg ~ 9× 10 -8 Jm-1)
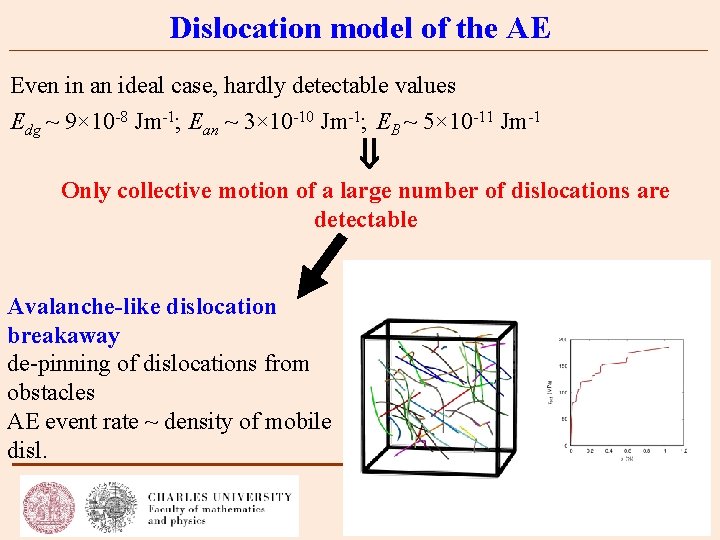
Dislocation model of the AE Even in an ideal case, hardly detectable values Edg ~ 9× 10 -8 Jm-1; Ean ~ 3× 10 -10 Jm-1; EB ~ 5× 10 -11 Jm-1 Only collective motion of a large number of dislocations are detectable Avalanche-like dislocation breakaway de-pinning of dislocations from obstacles AE event rate ~ density of mobile disl.
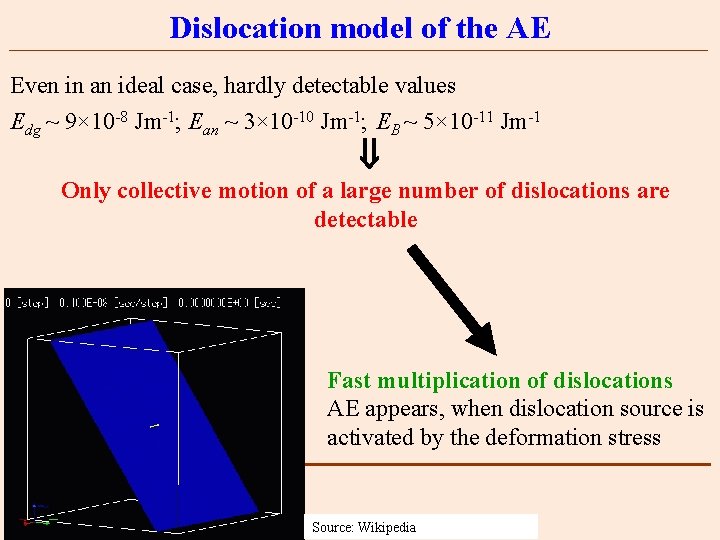
Dislocation model of the AE Even in an ideal case, hardly detectable values Edg ~ 9× 10 -8 Jm-1; Ean ~ 3× 10 -10 Jm-1; EB ~ 5× 10 -11 Jm-1 Only collective motion of a large number of dislocations are detectable Fast multiplication of dislocations AE appears, when dislocation source is activated by the deformation stress Source: Wikipedia
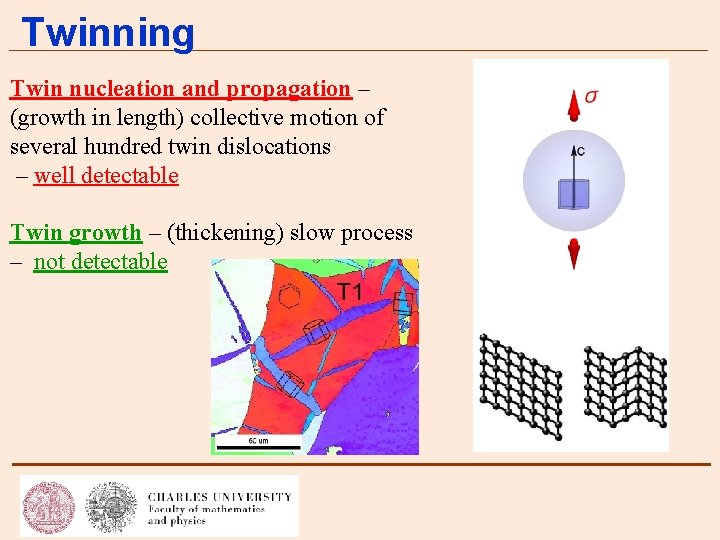
Twinning Twin nucleation and propagation – (growth in length) collective motion of several hundred twin dislocations – well detectable Twin growth – (thickening) slow process – not detectable
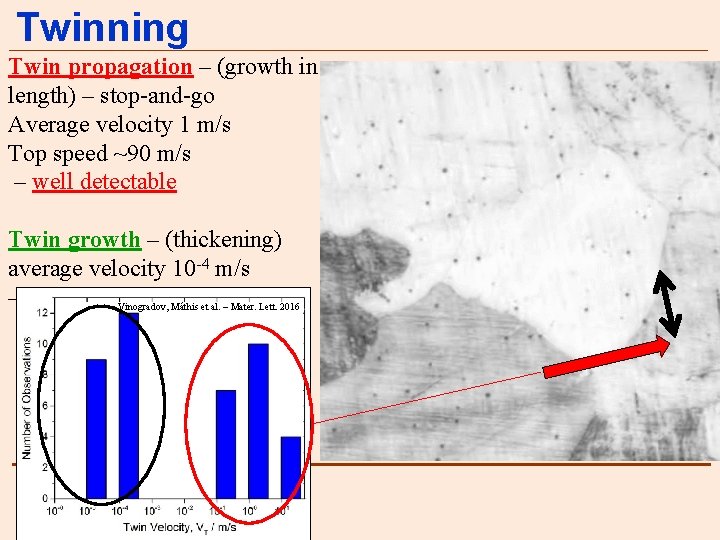
Twinning Twin propagation – (growth in length) – stop-and-go Average velocity 1 m/s Top speed ~90 m/s – well detectable Twin growth – (thickening) average velocity 10 -4 m/s – not detectable Vinogradov, Máthis et al. – Mater. Lett. 2016
Intensity of AE signal Mechanism of plastic deformation Strength of AE signal Frank-Read source strong Twin nucleation strong Yield phenomenon strong Cutting of coherent precipitates by dislocations strong Orowan bowing weak Twin growth and thickening negligible Grain boundary sliding without cracking negligible Parameters influencing AE signal: Crystal structure, grain size, texture, solute content, stress history, strain rate, testing temperature and environment etc.
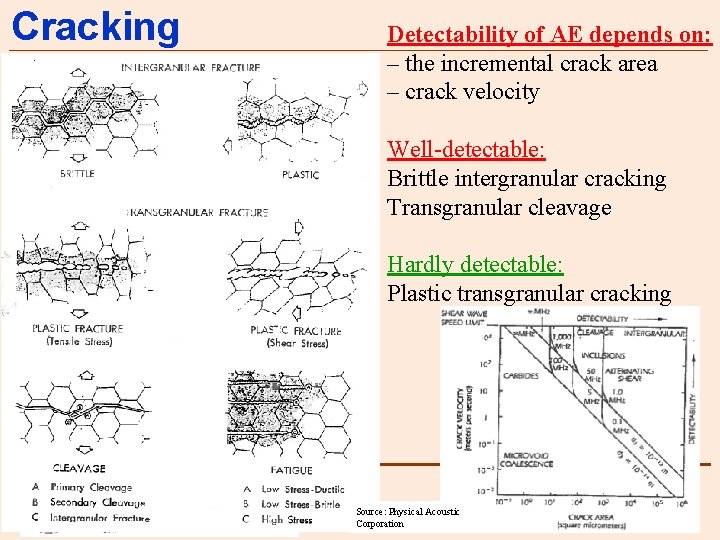
Cracking Detectability of AE depends on: – the incremental crack area – crack velocity Well-detectable: Brittle intergranular cracking Transgranular cleavage Hardly detectable: Plastic transgranular cracking Source: Physical Acoustic Corporation
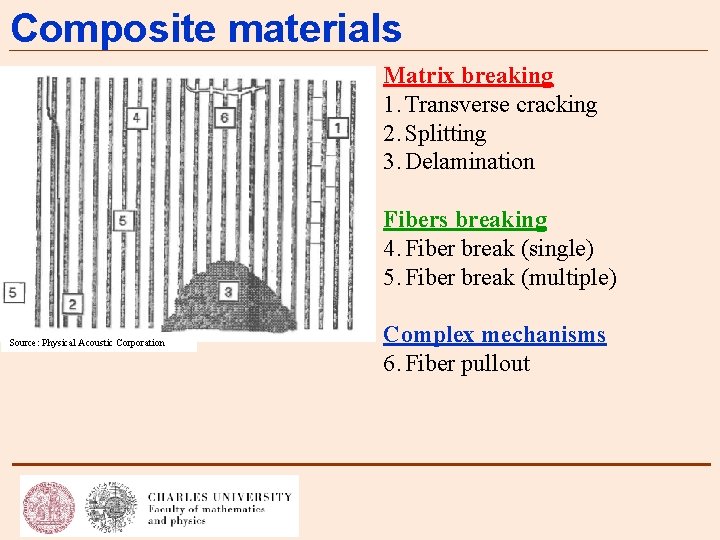
Composite materials Matrix breaking 1. Transverse cracking 2. Splitting 3. Delamination Fibers breaking 4. Fiber break (single) 5. Fiber break (multiple) Source: Physical Acoustic Corporation Complex mechanisms 6. Fiber pullout
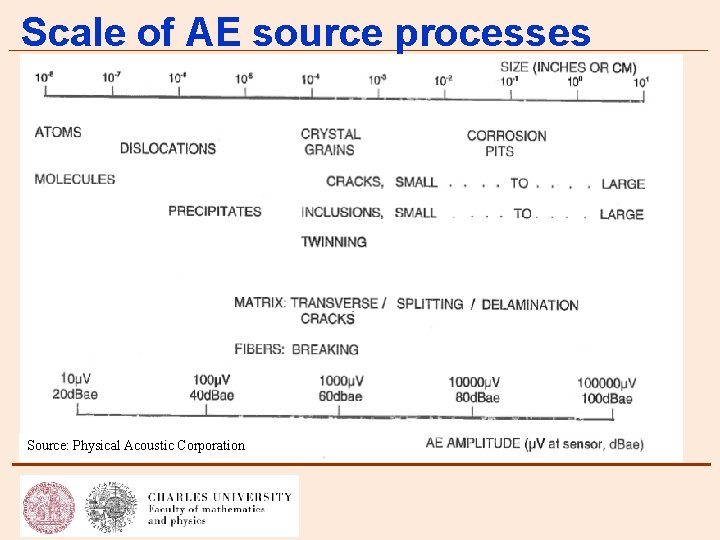
Scale of AE source processes Source: Physical Acoustic Corporation

AE source characteristics Source mechanism: Stress pulse (blow of the hammer) in frequency domain: AE waveform – broadband frequency spectrum !!! Source: Physical Acoustic Corporation

AE source characteristics The detected AE signal depends on: Material (of bell) and sensor characteristics Source: Physical Acoustic Corporation
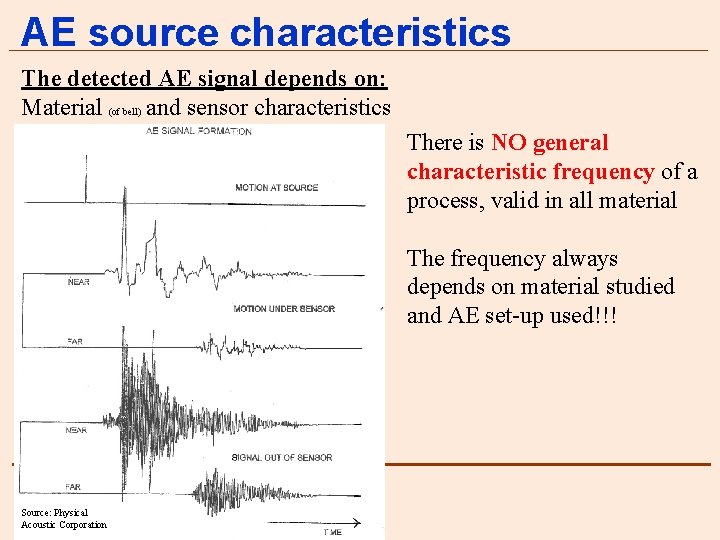
AE source characteristics The detected AE signal depends on: Material (of bell) and sensor characteristics There is NO general characteristic frequency of a process, valid in all material The frequency always depends on material studied and AE set-up used!!! Source: Physical Acoustic Corporation

Sensors Detection of surface displacement Sensor types • Piezoelectric – high sensitivity, broad frequency band • Electromagnetic – no contact needed, low sensitivity, cheap • Capacitive – flat frequency response • Optical – laser interferometer, non-contact measurement
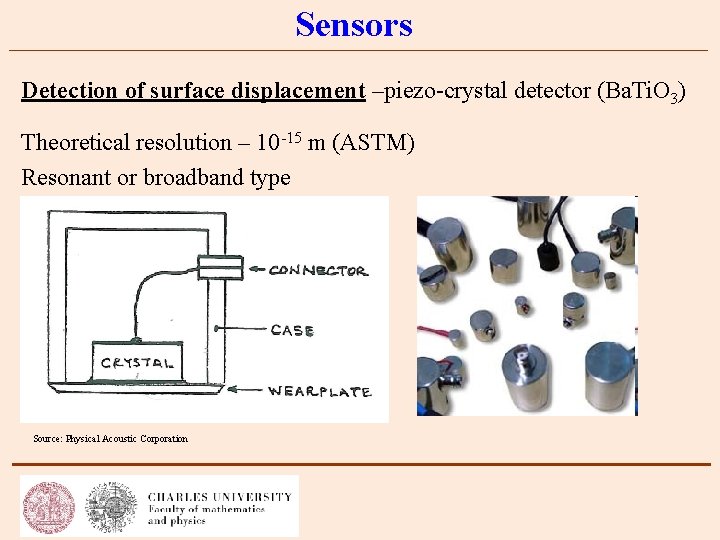
Sensors Detection of surface displacement –piezo-crystal detector (Ba. Ti. O 3) Theoretical resolution – 10 -15 m (ASTM) Resonant or broadband type Source: Physical Acoustic Corporation
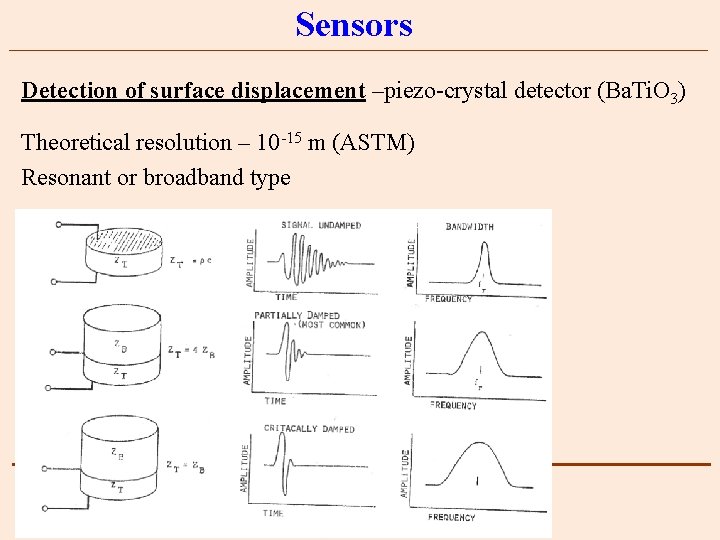
Sensors Detection of surface displacement –piezo-crystal detector (Ba. Ti. O 3) Theoretical resolution – 10 -15 m (ASTM) Resonant or broadband type Source: Physical Acoustic Corporation
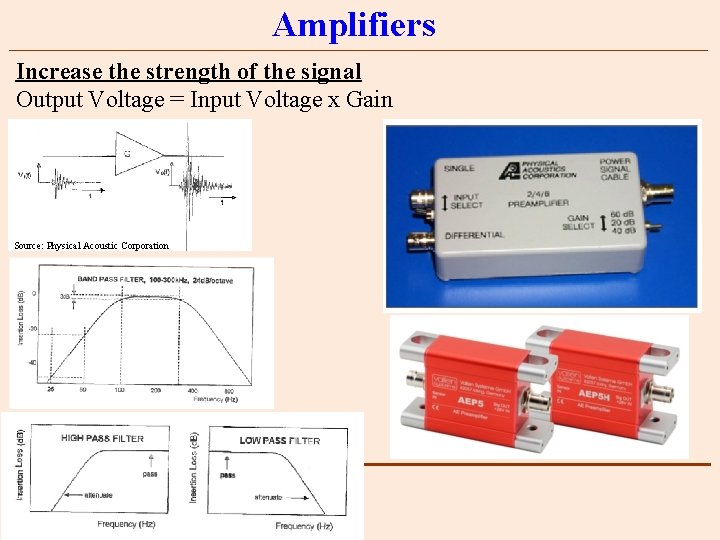
Amplifiers Increase the strength of the signal Output Voltage = Input Voltage x Gain Source: Physical Acoustic Corporation
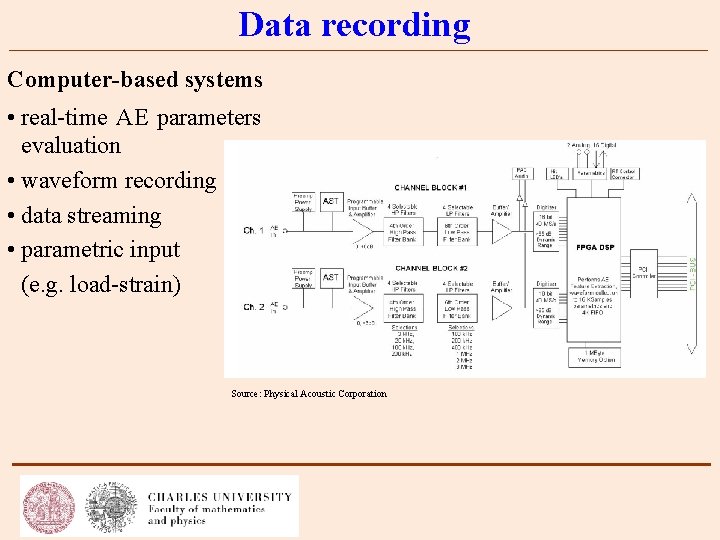
Data recording Computer-based systems • real-time AE parameters evaluation • waveform recording • data streaming • parametric input (e. g. load-strain) Source: Physical Acoustic Corporation
Conclusions • AE is a unique tool for in-situ monitoring of materials • The method is applicable for study of various processes of deformation • The AE measurements could reveal micromechanisms, which are not detectable with another methods • For complete information additional experimental techniques are required (extensometry, neutron diffraction, microscopy)
- Slides: 41