Acid Base Titration Curve Titration Curve A titration

Acid – Base Titration Curve

Titration Curve A titration curve is a plot of p. H vs. the amount of titrant added. Typically the titrant is a strong (completely) dissociated acid or base. Such curves are useful for determining endpoints and dissociation constants of weak acids or bases.
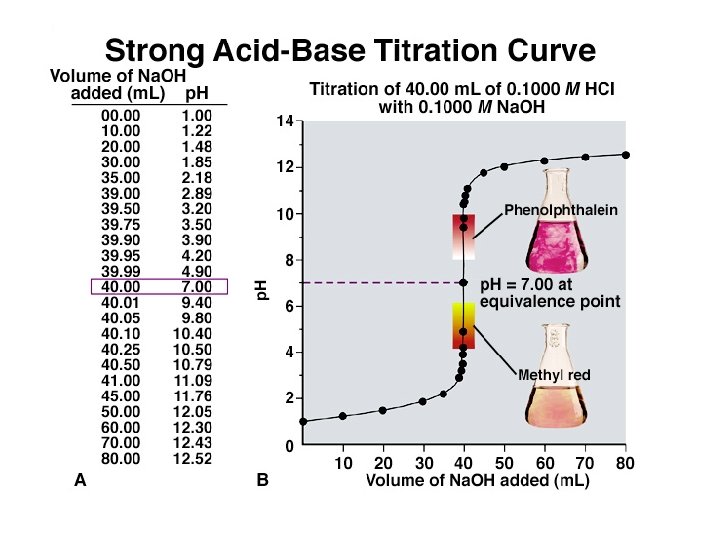

Features of the Strong Acid-Strong Base Titration Curve 1. The p. H starts out low, reflecting the high [H 3 O+] of the strong acid and increases gradually as acid is neutralized by the added base. 2. Suddenly the p. H rises steeply. This occurs in the immediate vicinity of the equivalence point. For this type of titration the p. H is 7. 0 at the equivalence point. 3. Beyond this steep portion, the p. H increases slowly as more base is added.

HPr = Propionic Acid

The four Major Differences Between a Strong Acid-Strong Base Titration Curve and a Weak Acid-Strong Base Titration Curve 1. The initial p. H is higher. 2. A gradually rising portion of the curve, called the buffer region, appears before the steep rise to the equivalence point. 3. The p. H at the equivalence point is greater than 7. 00. 4. The steep rise interval is less pronounced.
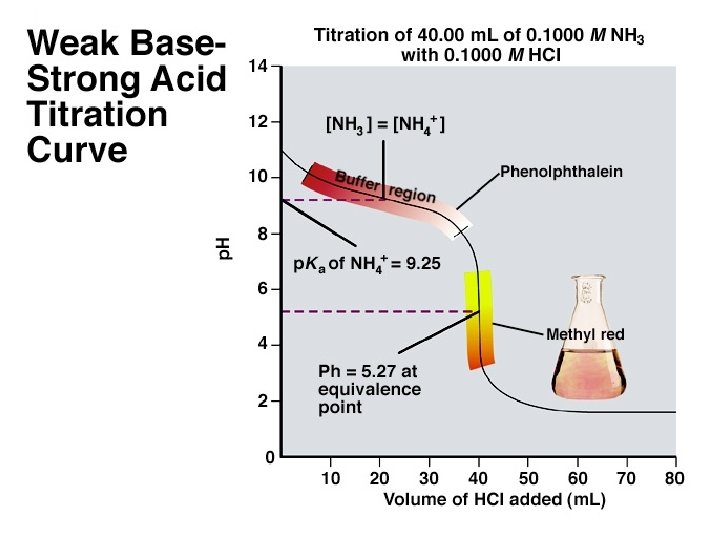

The four Major Differences Between a Weak Acid-Strong Base Titration Curve and a Weak Base-Strong Acid Titration Curve 1. The initial p. H is above 7. 00. 2. A gradually decreasing portion of the curve, called the buffer region, appears before a steep fall to the equivalence point. 3. The p. H at the equivalence point is less than 7. 00. 4. Thereafter, the p. H decreases slowly as excess strong acid is added.
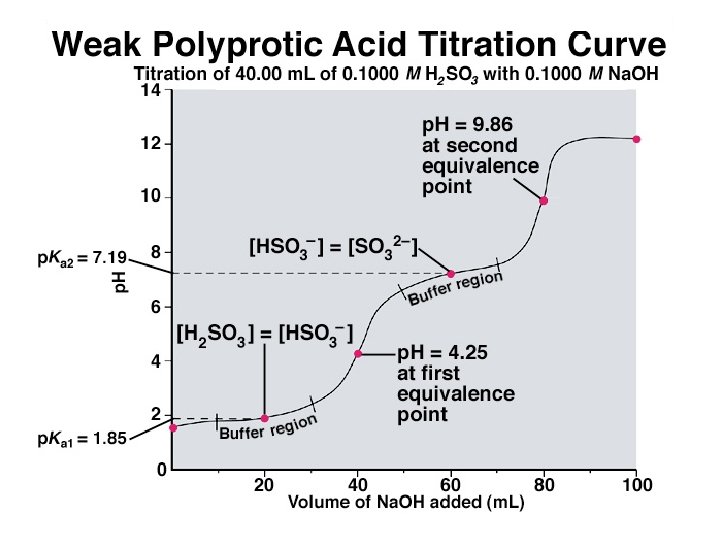

Features of the Titration of a Polyprotic Acid with a Strong Base 1. The loss of each mole of H+ shows up as separate equivalence point (but only if the two p. Kas are separated by more than 3 p. K units). 2. The p. H at the midpoint of the buffer region is equal to the p. Ka of that acid species. 3. The same volume of added base is required to remove each mole of H+.
- Slides: 11