Accountability Directors and Test Coordinators Fall Meeting Accountability

Accountability Directors and Test Coordinators Fall Meeting Accountability Services North Carolina Department of Public Instruction September 23, 2014

Agenda Ø Ø Ø Ø Introductions EVAAS Growth Read to Achieve/Grade 3 Reading Online Testing School Performance Grades Alternative School Accountability Model Accountability/Testing Updates

Teacher Evaluation and EVAAS Tomberlin Director, District HR Support

Teacher Evaluation in North Carolina
 has six")
Teacher Evaluation in NC • The North Carolina Educator Effectiveness System (NCEES) has six standards of performance for teachers and eight standards for principals. • NC has a conjunctive model, meaning that teachers and principals must be proficient (or better) on all standards in order to receive an overall effectiveness rating. We do not average or index these standards. • Unlike the observational standards, student growth (standard 6 for teacher, standard 8 for principals), requires three years of valid data in order to generate a rating.

Standards 6 & 8 – The Basics Teachers 1 2 3 4 5 6 Demonstrate Establish Leadership Environment Know Content Facilitate Learning Contribute Reflect on Practice to Academic Success Principals (and other Administrators) 1 2 3 4 5 6 7 8 Strategic Leadership Instructional Leadership Cultural Leadership Human Resource Leadership Managerial Leadership External Development Leadership Micropolitical Leadership Academic Achievement Leadership

3 -Year Rolling Average Teacher Rating from 2 years ago Rating from 1 year ago Rating from this year 1. 0 + (-2. 5) + 1. 2 6 6 6 Standard Contribute to Academic Success 1. 0 -2. 5 1. 2 Met Expected Growth Did not meet Met Expected Growth 3 = -0. 3 Met Expected Growth 3 - year average rating on standard 6 for determining status Note: A similar methodology applies to principals as well.

Teacher Status 1. In Need of Improvement Standards 1 -5 In the year 1 2 3 4 5 Demonstrate Leadership Establish Environment Know Content Facilitate Learning Reflect on Practice Any rating lower than proficient and/or Three year rolling average ) Standards 6 6 2 years ago + 6 1 year ago + Does Not Meet Expected Growth 6) This year /3

Teacher Status 2. Effective Standards 1 -5 In the year 1 2 3 4 5 Demonstrate Leadership Establish Environment Know Content Facilitate Learning Reflect on Practice Proficient or Higher on Standards 1 - 5 and Three year rolling average ) Standard 6 6 2 years ago + 6 1 year ago + 6) This year Meets or Exceeds Expected Growth /3

Teacher Status 3. Highly Effective Standards 1 -5 In the year 1 2 3 4 5 Demonstrate Leadership Establish Environment Know Content Facilitate Learning Reflect on Practice Accomplished or Higher on Standards 1 - 5 and Three year rolling average ) Standard 6 6 2 years ago + Exceeds Expected Growth 6 1 year ago + 6) This year /3
 the first status")
Teacher Status – First Status • For all teachers (and principals) the first status for Standard 6 will be generated from the best two out of three valid Standard 6 ratings. • School-level growth that has been assigned to a teacher as a result of a waiver (from NCFEs or ASW) will function as a valid Standard 6 rating. • School-level growth that has been assigned as a result of a lack of data for a teacher (i. e. , not from a waiver) will not count as a valid Standard 6 rating.

Status Scenarios Rating from 2012 -13 Rating from 2013 -14 Rating from 2014 -15 6 6 6 1. 0 -2. 5 1. 2 Met Expected Growth Did not meet Met Expected Growth • • • Teacher has individual-level data for three years. Standard 6 from the 2013 -14 school year is the lowest of the three ratings. Teacher’s Standard 6 status is 1. 1 – “Meets Expected Growth”.

Status Scenarios Rating from 2012 -13 Rating from 2013 -14 Rating from 2014 -15 6 6 6 1. 0 -2. 5 Met Expected Growth Did not meet Met Expected Growth • • • 1. 2 • Teacher has individual-level data for the first two years. The 2014 -15 data is schoollevel growth from a waiver. Standard 6 from the 2013 -14 school year is the lowest of the three ratings. Teacher’s Standard 6 status is 1. 1 – “Meets Expected Growth”.

Status Scenarios Rating from 2012 -13 Rating from 2013 -14 Rating from 2014 -15 6 6 6 1. 0 -2. 5 Met Expected Growth Did not meet Met Expected Growth • • • 1. 2 • Teacher has individual-level data for the final two years. The 2012 -13 data is schoollevel growth because teacher did not have individual-level data. The teacher does not receive a status in the fall of 2015 because teacher does not have 3 years of valid data. First status in Fall 2016 (provided teacher has valid data in SY 2015 -16).

Status Scenarios – Second Year Rating from 2012 -13 Rating from 2013 -14 Rating from 2014 -15 Rating from 2015 -16 6 6 1. 0 -2. 5 1. 2 Met Expected Growth Did not meet Met Expected Growth 4. 0 Exceeded Expected Growth • • Teacher receives second status in fall of 2016. Rating from 2012 -13 “rolls off”. Rating from 2013 -14 returns to the rolling average (even though it was dropped from prior year’s calculation). Teacher’s status is “Meets Expected Growth” with an average of 0. 9.

Student Growth and Teacher Effectiveness
 are weighted equally in")
Weight of Standards • The six standards (eight for principals) are weighted equally in the determination of teachers’ effectiveness ratings. • In practice, however, student growth carries much more weight in differentiating teachers in terms of effectiveness. • Nominal vs. Effective Weighting
 → Needs Improvement Effective Highly Effective Total Needs Improvement")
Weight of Standards Status (Observation) → Needs Improvement Effective Highly Effective Total Needs Improvement 1416 4658 2648 8722 (22. 8%) Effective 0 14049 10106 24155 (63. 1%) Highly Effective 0 0 5383 (14. 1%) Total 1416 (3. 7%) 18707 (48. 9%) 18137 (47. 4%) 38260 Status (Obs + Growth) ↓

Weight of Standards • Standard 6, student growth, plays a greater role in determining teacher effectiveness ratings than observational data. • The disproportional effect of student growth is an artifact of the lack of variation in observational data, not a value judgment. • More accurate assessment of teacher performance can improve this phenomenon.

Correlations Between Standards and Growth SY 2011 -12 SY 2012 -13

What this tells us: Student Growth, as measured using value-added data, and ratings on Standards 1 -5 continue to be very, very loosely correlated. Additionally, it appears that we are measuring one, holistic element of “good teaching” rather than five discrete standards of practice.

Results from Fall READY Principals Ms. Brown - Area and Perimeter 90 80 70 60 Novice 50 10 year 20 year 40 30 20 10 0 ND Dev Prof Acc Dist

Understanding EVAAS Growth
 Deviation from the mean (50 th")
General Method of Estimation Student Raw Score (26/50) Deviation from the mean (50 th NCE) for each student is aggregated at the teacher (or school, or district) level. The mean difference is the teacher effect which has an associated standard error Conversion to Scale Score (250) Percentile Rank is converted to NCE (~ 58 NCE) The teacher effect is divided by the standard error to create the index. Difference Between Expectation and Actual Scale Score (240 vs. 250) Positive 10 Scale Score Points is compared to distribution at the state level for that grade and subject. (e. g. , 65 th %tile) Index>=2 – Exceeds 2>=Index>2 – Meets Index <-2 – Does Not Meet

Teacher- and School-Level Growth Teacher 1 Teacher 2 Teacher 3 Student A -1. 9 -2. 2 -0. 4 Student B -1. 2 -1. 6 -0. 5 Student C -0. 7 1. 6 -1. 6 Student D -1. 0 -1. 2 -0. 7 Student E 0. 5 -1. 2 -0. 9 -1. 0 -0. 9 Std Dev 0. 9 1. 5 0. 5 Std Error 0. 5 -1. 7 -2. 0 -1. 8 Mean Index

Teacher- and School-Level Growth School A Teacher 1 Teacher 2 Teacher 3 Student A -1. 9 -2. 2 -0. 4 Student B -1. 2 -1. 6 -0. 5 Student C -0. 7 1. 6 -1. 6 Student D -1. 0 -1. 2 -0. 7 Student E 0. 5 -1. 2 Mean Index -0. 9 Std Dev 1. 0 -3 Std Error 0. 3

Proficiency and EVAAS • How can a school increase proficiency rates by X percentage points but not meet growth? Prior Year (Expected) Score Prior Year NCE Current Year Score Current Year NCE Growth Student A 229 54 231 55 1 Student B 250 62 238 57 -5 Student C 255 64 236 56 -8 Student D 226 53 230 54 1 Student E 228 54 232 55 1 Student F 243 59 235 56 -3 Student G 225 52 230 54 2 Student H 231 55 230 54 -1 Student I 227 53 220 50 -3 Student J 235 56 230 54 -2 Prior Year Proficiency = 230 % Proficient = 50% Current Year Mean %Proficient = 90% Std Dev 3. 2 Std Error 0. 8 Index -1. 7 -2. 1

Does Evaluation Matter?

Does Evaluation Matter?

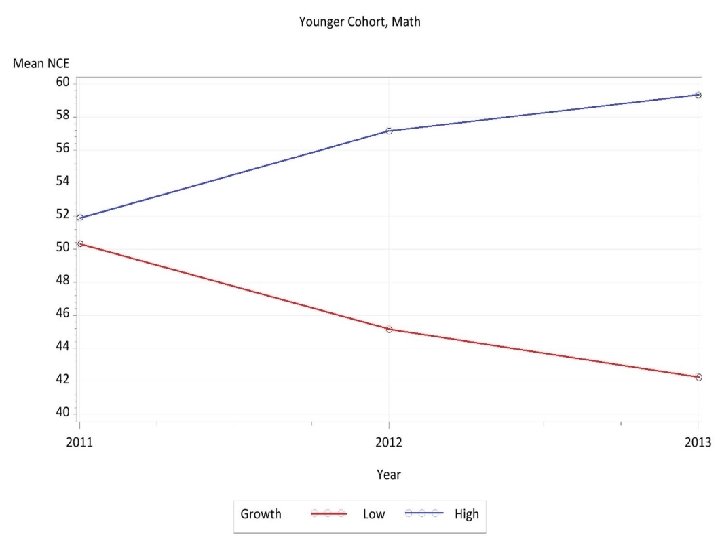
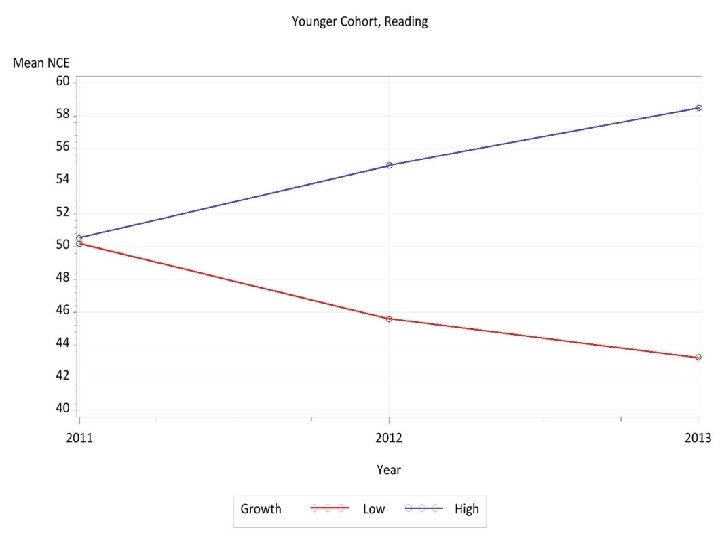
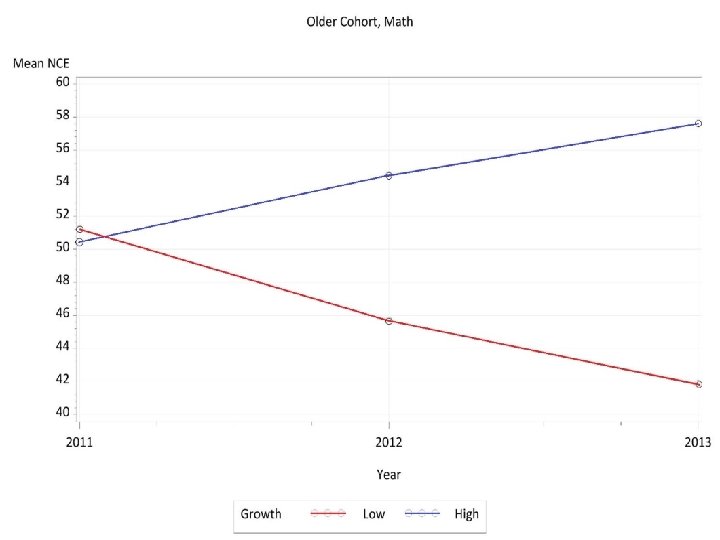
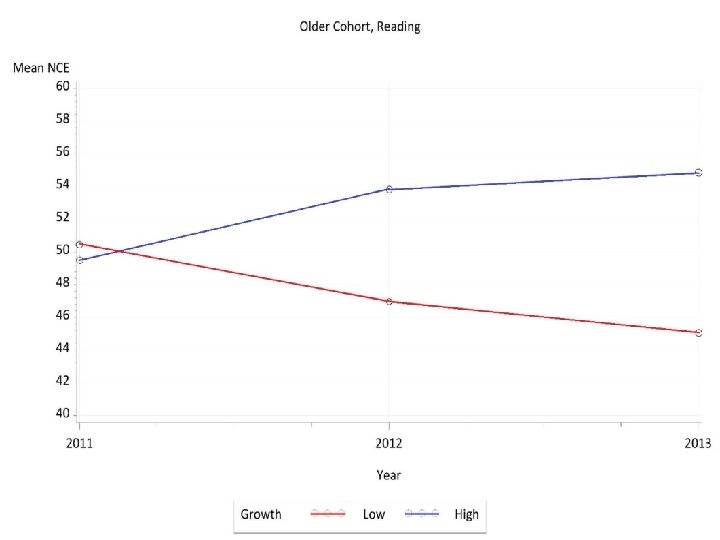
Does Growth Matter? • Two groups of students captured: • Younger Cohort: began Grade 5 in SY 2010 -11 • Older Cohort: began Grade 6 in SY 2010 -11 Low 1 Younger Older 1 Students 2 Students High 2 Math Reading Math 1935 184 1560 1825 221 1547 Reading 183 301 in the “Low Growth” category have consecutive years of teachers in the Does Not Meet Expected Growth category in the “High Growth” category have consecutive years of teachers in the Exceeds Expected Growth category

Evaluation and Change in Growth

Questions, Comments, and Feedback Thomas R. Tomberlin Director, District HR Support thomas. tomberlin@dpi. nc. gov 919 -807 -3440


HB 230 Clarifications Reducing the minimum length of reading camps • Camps now referred to as reading camp • Reading camp shall: - Offer at least 72 hours of reading instruction to yield positive reading outcomes for participants - Allow volunteer mentors to read with students at time other than during the 72 hours of reading instruction -72 hours of reading instruction shall be provided over no less than 3 weeks for students in schools using calendars other than year-round calendars -Funding reverts on October 31, 2014

HB 230 Clarifications Student Attendance in Summer Reading Camps • parents or guardians of students not demonstrating reading proficiency shall be encouraged to enroll their student in a reading camp – Parent/guardian shall make the final decision regarding student reading camp attendance – LEAs shall provide a least one opportunity for students not participating in a reading camp to demonstrate reading proficiency appropriate for third grade students

HB 230 Clarifications Revises Good Cause Exemptions • Limited English Proficient: students with less than two school years of instruction in an ESL program • Students who demonstrate reading proficiency appropriate for third grade students on an alternative assessment approved by the SBE (took out wording on when to administer) • Multiple retention language stays the same • Portfolio: Student reading portfolio and review processes used by LEAs shall be approved by the SBE

HB 230 Clarifications Revises Good Cause Exemptions • Students with disabilities whose IEPs indicate: - the use of NCEXTEND 1 - at least a two school year delay in educational performance (guidance from EC division) - receipt of intensive reading interventions for at least two school years

Ways to Show Proficiency • BOG • EOG retest • Rt. A Alternative Test • Reading 3 D at Level P (with comprehension) • SBE approved Local Alternative Assessment • Completed Portfolio (state or local)

HB 230 Clarifications Retained Student Placement • Retained in third grade Accelerated reading class – third grade standards and curriculum • Placed in 3/4 Transition Class with Retained Reading label – fourth grade standards and curriculum • Placed in 4 th Grade Accelerated reading class with Retained Reading label – fourth grade standards and curriculum

Local Portfolio • SBE approved policy on process for submission in Sept. • Proposals for local alternative portfolios must follow requirements of policy • Reviewed by Portfolio Advisory Committee • Recommendations to SBE by PAC

Numbers and Percentages • Must be reported to SBE by Sept 1 and posted on district website • Results will be included in the October state board report • This report goes to the General Assembly on October 15

What is Included • Demonstrating and not demonstrating proficiency on EOG • Exempt for Good Cause • Passed Alternative Assessment (state or local) • Students retained (placement in third grade, 3/4 Transition or 4 th grade accelerated) • Charter – retained students who did not return
 • Rt. A alternative test, local alternative test,")
Mid-Year Promotion • November 1(SBE policy) • Rt. A alternative test, local alternative test, completed portfolio, Reading 3 D at Level P (can use all, if needed) • After Nov. 1, principal can grade and classify • MUST still show proficiency of third-grade standards (local alternative, portfolio, or Reading 3 D at Level P)

Classes Continue • After Nov. 1, transition and accelerated classes continue • No matter the results • 90 minutes of uninterrupted reading instruction • Recommended 30 more of interventions outside of the 90 minutes

Exempt for Good Cause § “…but shall continue to receive instructional supports and services and reading interventions…” § Definition – means intentional strategies used with a majority of students to facilitate reading development and remediate emerging difficulty with reading development § Include but not limited to – small group instruction, reduced teacher/student ratios, frequent progress monitoring, and extended learning time

Read to Achieve: Local Alternative Assessments Tammy Howard, Director Accountability Services
 provide several valid and reliable")
HB 230 “The State Board of Education shall (i) provide several valid and reliable alternative assessments to local school administrative units upon request, (ii) approve valid and reliable alternative assessments submitted by local school administrative units, and (iii) establish achievement level ranges for each approved alternative assessment. The State Board of Education shall annually review all alternative assessments to ensure ongoing relevance, validity, and reliability. "

Process Ø Reviewed assessments submitted by LEAs for the 2013 -14 school year Ø Reviewed technical information Ø Identified Lexiles as a meaningful way to compare the assessments Ø Linking studies completed for most of the assessments Ø Allows comparison to the Level 3 cut point on EOG (439) with a Lexile of 725

Recommendations to SBE Ø Recommending assessments with Lexiles Ø Recommending assessments without Lexiles as pending the completion of a linking study Ø Case Assessments by TE 21 Ø Discovery Education Ø Recommending not including item banks Ø School. Net, Class. Scape and Study Island Ø However, districts may arrange a Lexile linking study and submit for approval Ø Also, selections may be used to build a local portfolio (must be approved)

Grade 3 Expectancy Table Garron Gianopulos, Psychometrician Test Development

Beginning of Grade 3 & EOG 3 Expectancy Table 2013 -14 *The total count excludes records that did not have an EOG 3 score and students who transferred schools.
 BOG 3 Score Distribution • All third graders with BOG 3 scores and")
(2013) BOG 3 Score Distribution • All third graders with BOG 3 scores and EOG 3 scores within a school were included. • Level 1 was divided into three roughly equal sized groups. • Total count of 103, 394.

Highlighted cells indicated most likely achievement level given a student’s BOG 3 scale score.

69% of students from the scale score range 408 to 421 on the BOG 3 stayed within Achievement Level 1 on the EOG.

23% of students from the scale score range 408 to 421 on the BOG 3 reached Achievement Level 2 on the EOG.

8% of students from the scale score range 408 to 421 on the BOG 3 became grade level proficient.

25% of students from the scale score range 422 to 427 on the BOG 3 became grade level proficient. *The total count excludes records that did not have an EOG 3 score and students who transferred schools.

52% of students from the scale score range 428 to 431 on the BOG 3 became grade level proficient. *The total count excludes records that did not have an EOG 3 score and students who transferred schools.

83% of students from the scale score range 432 to 438 on the BOG 3 became grade level proficient. *The total count excludes records that did not have an EOG 3 score and students who transferred schools.

Example Questions: 1. What was the most likely EOG achievement level for a student scoring a level 2 on the BOG 3? *The total count excludes records that did not have an EOG 3 score and students who transferred schools.

Example Questions: 1. What was the most likely EOG achievement level for a student scoring a level 2 on the BOG 3? Answer: Level 4 *The total count excludes records that did not have an EOG 3 score and students who transferred schools.

Example Questions: 2. What was the most likely EOG level for a student scoring at level 3 on the BOG 3? *The total count excludes records that did not have an EOG 3 score and students who transferred schools.

Example Questions: 2. What was the most likely EOG level for a student scoring at level 3 on the BOG 3? Answer: Level 4 *The total count excludes records that did not have an EOG 3 score and students who transferred schools.

Example Questions: 3. What was the likelihood that a randomly chosen student who scored a level 2 on the BOG 3 reached a level 4 or 5 on the EOG 3? *The total count excludes records that did not have an EOG 3 score and students who transferred schools.

3. What was the likelihood that a randomly chosen student who scored a level 2 on the BOG 3 reached a level 4 or 5 on the EOG 3? Answer: 62% *The total count excludes records that did not have an EOG 3 score and students who transferred schools.

Example Questions: 4. What is the probability that a randomly chosen student who scored a level 2 on the BOG 3 in 2014 will reach level 4 or 5 on the EOG 3 in 2015? *The total count excludes records that did not have an EOG 3 score and students who transferred schools.

4. What is the probability that a randomly chosen student who scored a level 2 on the BOG 3 in 2014 will reach level 4 or 5 on the EOG 3 in 2015? Answer: If instruction remains unchanged, then the expectation remains the same as 2013 -14: 62% *The total count excludes records that did not have an EOG 3 score and students who transferred schools.

Summary: 1. The percentages under the EOG 3 achievement levels sum to 100 and describe only that row. Do not sum the columns. 2. BOG 3 Level 1 was disaggregated to help differentiate levels of instructional need. 3. Expectations for 2014 -15 defined by this table assume students are randomly chosen within a BOG 3 score range and that instruction remains unchanged from 2013 -14. 4. If schools reduce effort for level 2 students, the 83% proficiency may drop for those students. Therefore, we need to maintain or increase instructional support for level 2 and above while at the same time increasing instructional support for students at level 1. *The total count excludes records that did not have an EOG 3 score and students who transferred schools.

Online Testing Update Hope Lung, Section Chief Test Development
 Ø English II online mandated Ø")
2014– 15 NCTP Summative Online Assessments Memo (9/5/14) Ø English II online mandated Ø NCFEs available online Fall 2014: Eng III, Math II, Math III, G 7 Sci, Phy Sci, Earth/Env, G 8 SS, C&E, USH, WH ‒ Spring 2015: All Ø EOG Grade 7 ELA/Reading & Math available online Ø Projected Online Summative Assessment Participation Survey (9/29)
 Required for online tutorials, released")
Secure Platforms Required for NCTest v 5 (2014– 15) Required for online tutorials, released test forms/items, and summative assessments Ø Options include: Ø ‒ Secure browser for MS Windows & Apple OS X (version same as 2013– 14) ‒ Native app for i. Pad ‒ Chromebook (Chrome OS) version with special restrictions ‒ NEW NCTest Chrome App for Chromebooks, Windows, and Macintosh workstations/laptops (alternative to secure browser)
 Ø Test Window")
NCTest v 5 New Features Spring 2014 End-of-Year Survey (Thank you!) Ø Test Window Scheduler completed by LEA TC/TA ‒ Enter start/end test window dates ‒ Select test(s) by “test type”: EOC, NCFE ELA, Ø NCFE math, NCFE science, NCFE social studies or EOG ‒ Generates enrollment ‒ School TC can review but not edit
 Ø SIQ Tab ‒ All student SIQs visible")
NCTest v 5 New Features (continued) Ø SIQ Tab ‒ All student SIQs visible on SIQ tab ‒ Reminder: Schools must check SIQ and record SIQs for LEP and 504 only Ø Start a test ‒ Select test type ‒ Filter by alphabetical range (e. g. , A–C, D–F)

NCTest v 5 Technical Requirements https: //center. ncsu. edu/nc/ course/view. php? id=361

Training and Resources Ø Webinar being scheduled for week of October 13 Ø LEA Technology Coordinator Ø NCEducation Guides (screen shots for completing various tasks within NCEd) Ø Regional Accountability Coordinators/Regional Computer Consultants

Top Help Desk Requests Ø Username/password assistance Ø Test administrators not linked to school Ø Setting test session on day of test Ø Enrollments Ø Failing to mark Computer Reads Test Aloud accommodation

School Performance Grades Curtis Sonneman, Education Consultant Accountability Services

School Performance Grades Assignment of Grades North Carolina General Assembly legislation requires assignment of School Performance Grades beginning with 2013– 14 results – Presented to State Board of Education for first time February 5, 2015 • Legislation (budget bill) states “no earlier than January 15, 2015. ” – Available publicly in new NC School Report Card

School Performance Grades Highlights of Legislation Ø Calculated using 80% Achievement and 20% Growth – Schools with no growth use 100% achievement – Schools with no data receive no designation Ø 15 Point Scale 2013– 14 (2014– 15 and beyond uses 10 Point Scale) Ø A separate achievement score and grade for reading and math must be reported for schools serving grades K– 8 Ø Regional and charter schools assigned a “D” or “F” SPG must inform parents via a letter (§ 115 C 238. 66 and § 115 C-238. 29 F)

School Performance Grades Highlights of Legislation “If a school has met expected growth and inclusion of the school’s growth score reduces the school’s performance score and grade, a school may choose to use the school achievement score solely to calculate the performance score and grade. ” – May need to provide an opt in/out document for Superintendents/Charter Directors to sign

School Performance Grades Achievement Indicators Elem/Middle High Schools EOG Mathematics Math I EOG ELA/Reading English II EOG Science Biology Math I (when applicable) The ACT Biology (when applicable) Math Course Rigor ACT Work. Keys Graduation Rate

School Performance Grades Achievement Indicator Standards Summative Assessment Scores: Percent of students who score at or above Level 3 (Grade Level Proficiency) End-of-Grade Tests Graduation Rate: Percent of students who graduate in four years (4 -Year Cohort Rate) Passing Math III: Percent of graduates who successfully complete Math III End-of-Course Tests The ACT: Percent of 11 th grade students who score 17 or above (UNC System’s minimum composite score requirement) ACT Work. Keys: Percent of CTE concentrator graduates who achieve a Silver Certificate or above

School Performance Grades Growth Indicator and Reporting Exceeds Expected Growth EVAAS School Accountability Growth Composite Index Score Generated Using End –of- Grade and End-of-Course Assessments Assigned an EVAAS Growth Status reported with School Performance Grades Meets Expected Growth Does Not Meet Expected Growth Converted to 100 Point Scale for School Performance Grades 50 -100 Point Scale Composites Capped
 School Achievement Score Add all")
School Performance Grades Calculating the Grade (Middle School Example) School Achievement Score Add all indicator numerators (met indicators standard) and divide by all indicator denominators (students included in indicators) to determine School Achievement Score Indicator Numerator Denominator Score Total Achievement Score EOG Reading (3– 8) 200 300 66. 7 EOG Math (3– 8) 180 300 60. 0 EOG Science (5 & 8) 60 100 60. 0 EOC Math I 30 35 85. 7 EOC English II EOC Biology The ACT (UNC System 17) ACT Work. Keys (Silver or Better) Passing Math III (Math Course Rigor) 4 -year Graduation Rate 470 735 Total 63. 9
 Growth Score EVAAS School Accountability")
School Performance Grades Calculating the Grade (Middle School Example) Growth Score EVAAS School Accountability Growth Index score is converted to a 100 point scale and given a designation Converted Score and Designation are reported on School Report Card Growth Score Composite Index Score Converted Score Status 10. 00 100. 0 Exceeds Expected Growth
 Final Score and Grade •")
School Performance Grades Calculating the Grade (Middle School Example) Final Score and Grade • 80% Achievement Score and 20% Growth Score • Set on a 15 Point Scale • Calculated using data rounded to the nearest 10 th. Prior to assignment of grades and for reporting purposes scores are rounded to the nearest whole (except for growth, kept at 10 th for reporting. ) Score Multiply by Input for Final Grade School Achievement 63. 9 . 80 51. 1 Growth 100. 0 . 20 20. 0 Final Score and Grade Reported 71 B Reading Score and Grade Reported 67 60 C C Math Score and Grade Reported
 School Achievement Score Add all")
School Performance Grades Calculating the Grade (High School Example) School Achievement Score Add all indicator numerators (met indicators standard) and divide by all indicator denominators (students included in indicators) to determine School Achievement Score Indicator Numerator Denominator Score Total Achievement Score EOG Reading (3 -8) EOG Math (3 -8) EOG Science (5 & 8) EOC Math I 175 230 76. 1 EOC English II 223 240 92. 9 EOC Biology 198 229 86. 5 The ACT (UNC System 17) 162 254 63. 8 ACT Work. Keys (Silver or Better) 50 56 89. 3 Passing Math III (Math Course Rigor) 244 250 97. 6 4 -year Graduation Rate 238 250 95. 2 Total 1, 290 1, 509 85. 5
 Growth Score EVAAS School Accountability")
School Performance Grades Calculating the Grade (Middle School Example) Growth Score EVAAS School Accountability Growth Index score is converted to a 100 point scale and given a designation Converted Score and Designation are reported on School Report Card Growth Score Composite Index Score Converted Score Status -1. 99 70. 0 Meet Expected Growth
 Final Score and Grade •")
School Performance Grades Calculating the Grade (Middle School Example) Final Score and Grade • • 80% Achievement Score and 20% Growth Score Set on a 15 Point Scale Calculated using data rounded to the nearest 10 th. Prior to assignment of grades and for reporting purposes scores are rounded to the nearest whole (except for growth, kept at 10 th for reporting. ) School meets (exceeds) growth and growth lowers final score and grade, use achievement score (school option) Score Multiply by Input for Final Grade School Achievement 85. 5 . 80 68. 4 Growth 70. 0 . 20 14. 0 Final Score with Growth (Grade) 82 (B) Final Score no Growth (Grade) 86 (A) 86/A Final Score and Grade Reported 93

School Performance Grades Additional Notes All accountability business rules are applied to school performance grades – Banked scores for high school EOC as part of achievement calculation After 2013– 14 reporting in January 2015, future reporting is expected to occur at beginning of school year in conjunction to release of accountability results. SPG will be one piece of the reporting. All accountability results will be reported through NC School Report Card.

Alternative School Accountability Model Curtis Sonneman, Education Consultant Accountability Services

Alternative School Accountability Current Status Ø According to General Statue for alternative schools – “As part of its evaluation of the effectiveness of these programs, the State Board shall, through the application of the accountability system developed under G. S. 115 C-83. 15 and G. S. 115 C-105. 35, measure the educational performance and growth of students placed in alternative schools and alternative programs. If appropriate, the Board may modify this system to adapt to the specific characteristics of these schools. ”

Alternative School Accountability Current Status Ø Current model for alternative schools is Local Options Model for use in ABCs (GCS-C-013 and GCS-C-022) – With elimination of ABCs model current policy is out of alignment with READY and School Performance Grades – With creation of School Performance Grades a new model better suited for providing designations to alternative schools is warranted

Alternative School Accountability Timeline of model development Ø August State Board Meeting Discussion Item – Gathered feedback from SBE regarding the intent for evaluating alternative schools • Agreed in principle that these schools should have a different evaluation other than A–F letter grades • Acknowledged that another model should be designed for alternative schools Ø August-September – Gathered input on an optimal model

Alternative School Accountability Timeline of model development Ø Present model ideas – Accountability Coordinators Fall Meeting • September 23, 2014 – North Carolina Association of Alternative Educators Annual Conference • September 26, 2014 – Alternative Schools Webinar • September 29, 2014

Alternative School Accountability Timeline of model development Ø November State Board Meeting – Propose new alternative schools accountability model effective with 2014– 15 – Receive approval to remove alternative schools from A–F model for 2013– 14 Ø December-January – If approved, Local Options will not be collected – Data collection processes will be reviewed any changes will be made and provided to field

Alternative School Accountability New Model Proposal Ø New model will create three options for alternative schools to be evaluated 1. Participate in A–F system in exact same way as all other schools 2. Return all results back to sending schools and receive no designations 3. Participate in Alternative Progress Model

Alternative School Accountability New Model Proposal 1. Participate in A–F system – Schools elect to participate in A–F system and are evaluated in the same way as all other “traditional” schools in letter grade system • School/Superintendent/Local Board decides at beginning of each school year (designated date) 2. Return all test scores back to base school(s) – School receives no designations, reporting notes all data sent back to base school • School/Superintendent/Local Board decides at beginning of each school year (designated date)

Alternative School Accountability New Model Proposal 3. Participate in Alternative Progress Model ‒ School/Superintendent/Local Board decides at beginning of each school year (designated date) ‒ Alternative Progress Model measures performance of school compared to itself in the previous year ‒ School given a designation for reporting purposes • Progressing » School increases score by at least specified amount over previous year • Maintaining » School maintains score between a specified amount +/- over previous year • Declining » School decreases score by at least specified amount over previous year
 ‒ Student still in")
Alternative School Accountability Alternative Progress Model Components Student Persistence (20%) ‒ Student still in school at the end of the school year after attending an alternative school any time during the school year • Measured as percent of students still enrolled in a school anywhere in North Carolina at the end of the school year after appearing in any data collection at the alternative school Student Achievement (20%) ‒ Percent students proficient based on 3 -year average • Total students numerator and denominator for 3 -year • Must be assessed at alternative school to be included in calculation • Includes all available data used for calculating School Performance Grades
 Ø EVAAS Growth – Working")
Alternative School Accountability Alternative Progress Model Components Growth (60%) Ø EVAAS Growth – Working with EVAAS team to develop an alternative growth model • Remove 140 day membership rule and calculate as a percentage for all students taking assessments at alternative school • Use student enrollment data to provide percentage of student growth to alternative school if student is enrolled in another school in same LEA (remaining percentage is not attributed to other school) • Use 3 -years of or 3 -year average growth measure to create index » First 2 years will likely need to be 1 -year result then 2 -year average, before becoming 3 -year rolling average

Alternative School Accountability Calculating Total Score In order to find the baseline and to calculate future numbers use following methodology Calculation of Data for Current Year Component Multiply Adjusted Score By Points Student Persistence 85. 6 . 20 17. 1 Student Achievement 14. 7 . 20 2. 9 Growth 64. 8 Total . 60 38. 9 41. 8 Calculation of Change for Designation Year Points Rating 2014 38. 4 * 2015 41. 8 Improving Change +3. 4

General Updates Tammy Howard, Director Accountability Services

February 5, 2015 Release Ø School Performance Grades – Based on EOGs/EOCs, The ACT, ACT Work. Keys, 4 -Year Cohort Graduation Rate, Passing Math III – Based on 80 % Achievement and 20 % Growth – Reported on NC Report Card Ø Schools with Grades 3– 8 will also have a reading and mathematics grade reported Ø NC Report Card will be released
 2013– 14 State, District, School Level EOG and")
Released Data Format (September 4) 2013– 14 State, District, School Level EOG and EOC Report LEA Name School Code Subject Percent Level 1 Percent Level 2 Percent Level 3 Percent Level 4 Percent Level 5 2013– 14 State, District, School Level Other Indicators Report (Schools without grades 9– 12 will only have data on EVAAS Growth Status) LEA Name School Code Percent AMO Targets Met EVAAS Growth Status The ACT Percent ACT Work. Keys Percent Passing Math III Percent 4 - Year 5 - Year Graduation Cohort Project Graduation Rate Percent 2013– 14 State, District, School Level AMO Targets Report LEA Name School Code Subject Subgroup Target Denominator Percent Met Target Used Alternate Used Improvement Used Confidence Interval

Implementation of Five Achievement Levels: Effective with 2013– 14 Data Ø Two Standards for Reporting – Grade Level Proficiency (Level 3 and above) • Used in School Performance Grades • Reported on NC School Report Card except Annual Measurable Objective Targets (AMOs) – College and Career Readiness (Level 4 and above) • Used for AMO targets (Baseline 2012– 13) • Reported on NC School Report Card

Results Ø Graduation Rate: 83. 8 – Continuing to increase – Also increased for all subgroups Ø Comparing CCR (2012– 13 to 2013– 14) – Increases for 10 of the 14 EOGs – Math I and English II increased; Biology decreased Ø The ACT and ACT Work. Keys increased

Results Ø Growth Increased – A 3. 2 increase; 71. 5 to 74. 7 met and exceeded growth Ø Questions about growth – How can a school have high achievement and not meet growth? – Is it a given that a certain number of schools will have to be designated as not meeting growth

Details to Remember Ø NC School Report Card and Data Reports will include banked scores (Math I and Biology) for schools starting with 9 th grade Ø Inclusion of Beginning-of-Grade 3 assessment in accountability reporting if achievement level is higher than End-of-Grade 3 ELA/Reading Ø Credit by Demonstrated Mastery for EOC courses are included in accountability reporting if student successfully completes program in entirety (Phase 1 and Phase 2 in same accountability year)
 “A charter school shall ensure")
Details to Remember Ø Per 115 C-238. 29 F(l) “A charter school shall ensure that the report card issued for it by the State Board of Education receives wide distribution to the local press or is otherwise provided to the public. A charter school shall ensure that the overall school performance score and grade earned by the charter school for the current and previous four school years is prominently displayed on the school Web site. If a charter school is awarded a grade of D or F, the charter school shall provide notice of the grade in writing to the parent or guardian of all students enrolled in that school. ”

HB 230: Details to Remember Testing Window Waiver: “For the 2014 -2015 school year only…” Ø Exclusion of Growth: “If a school has met expected growth and inclusion of the school's growth score reduces the school's performance score and grade, a school may choose to use the school achievement score solely to calculate the performance score and grade. ” Ø

Test Development Ø Information on Blueprints Ø Technical Documentation Ø Alignment Study

Fall 2014 Released NCFE ITEMS Ø http: //www. ncpublicschools. org/accountability/co mmon-exams/released-items/ Ø Items previously administered to students Ø May not reflect all assessed standards or range of difficulty Ø Includes correct answer, percent correct and standard/clarifying objective Ø Includes list of standards/clarifying objectives addressed by the released items Note: MSL Spring 2013 Released Forms to be reviewed and revised as needed 117

Fall 2014 Released NCFE Items Item Number Type Key Percent Correct Standard Example MC MC D 55% CCSS. ELA-Literacy. RL. 11 -12. 2 Example CR CR Rubric 47% CCSS. ELA-Literacy. WHST. 11 -12. 9. A • Percent correct for multiple-choice (MC) item is the percentage of students who answered the item correctly. • Percent correct for a constructed response (CR) item is the percentage of students who scored a 1 or 2. 118

Technical Documentation Ø EOG, EOC and NCFE test specifications to be updated to include blueprint information (number or percent of items at each standard) ü http: //www. ncpublicschools. org/accountability/ testing/generalinfo ü http: //www. ncpublicschools. org/accountability/ common-exams/specifications/ Ø Technical reports will be posted to http: //www. ncpublicschools. org/accountability/te sting/technicalnotes 119
 Ø EOG Grades 3")
NC Alignment Study Ø Content analysis of assessments (fall 2014) Ø EOG Grades 3 -8 ELA/reading and math Ø EOG Grades 5 & 8 science Ø EOC English II, Math I, Biology Ø Instructional alignment (survey) Ø Early spring 2015 Ø Recruit approximately 700 teachers Ø Professional development Ø Summer 2015 120

Testing Policy and Operations Ø Security Audit Ø Administration protocols Ø Security processes Ø Assessment Briefs Ø http: //www. ncpublicschools. org/accountabili ty/policies/briefs/ Ø Banked Scores Ø Understanding the Five Achievement Levels Ø Beginning-of-Grade 3 ELA/Reading Test

NAEP Update Iris Garner, NAEP Coordinator Testing Policy and Operations

NAEP Overview o Known as "the Nation's Report Card" o Only nationally representative and continuing assessment of what America's students know and can do in various subject areas o Authorized by Congress o Administered by the National Center for Education Statistics in the U. S. Department of Education

NAEP Overview o Since 1969, assessments have been conducted periodically in reading, mathematics, science, writing, U. S. history, civics, geography, and the arts. o Starting in 1990, NAEP assessments have also been conducted to give results for participating states. o Since 1990, North Carolina has participated in the state-level assessments of NAEP.
: “To")
NAEP Overview State Board of Education Policy HSP-A-001 (16 NCAC 6 D. 0302): “To ensure adequate representation and generalizability of the data used to develop tests and to conduct evaluation studies, selected LEAs and schools, determined through stratified random samples, shall participate in field testing and other sample testing such as NAEP and other national or international assessments as designated by the department or the State Board of Education. ”

NAEP Overview o "No Child Left Behind" legislation stipulates that states, districts, and schools within districts that receive Title I funds must participate in NAEP if selected. o Reading and mathematics must be administered every two years in grades 4 and 8. o Students and schools that are selected to participate are kept confidential.

NAEP 2015 NAEP Assessment Window: Jan. 26 – March 6


Participation Requirements Curtis Sonneman, Education Consultant Accountability Services

Participation Requirements Current Information Ø Memo sent to all superintendents/charter school directors – – – Ø TNN of memo posted September 15, 2014 by Jaime Kelley (Use Revised Memo) Includes sample letter for Year 1 participation requirements Explains LEA/charter school requirements for missing participation in each of 3 -years in cycle NCDPI finalizing plan for Year 2 monitoring

Participation Requirements Yearly Consequences Overview Ø The minimum participation rate for all subgroups is 95%; must have a subgroup of 30 students to be applied – – – Year 1: Letter to parents with plan for improving participation Year 2: School labeled as “consistently lowparticipating school” and develops an intensive action plan Year 3: non-participating students (to meet 95%) counted as not-proficient

Participation Requirements Year 1 Explanation Ø Year 1 Requirements – Within 30 days after accountability results are approved school must send letter to parents • – – – Includes plan of action to ensure full participation for all subgroups targeting those missing participation Within 30 days a copy of letter from each school, including plan of action, submitted to Regional Accountability Coordinator (RAC) RAC submits to NCDPI with in 35 days Upon receipt NCDPI will contact schools not in compliance

Participation Requirements Year 1 Explanation Ø Year 1 Timeline – October 2, 2014, Final results approved by SBE – November 3, 2014, Letters due to parents and RACs – November 7, 2014, Letters due to NCDPI – November 14, 2014, NCDPI begins sending notifications regarding non-compliance

Participation Requirements Year 2 Explanation Ø Year 2 Requirements – Schools designated “consistently lowparticipating school” • – Schools create and implement an intensive intervention plan • • – In School Report Card and documentation on Accountability website Plan submitted to LEA Testing Coordinator/RAC (charters) on or before November 1, 2014 LEA Testing Coordinators/RACs will verify submission with Accountability Services NCDPI implements state monitoring plan

Participation Requirements Ø Year 2 Explanation NCDPI Monitoring Plan – Desk Monitoring • • – Ensure that all schools have submitted a plan to LEA Testing Coordinator/RAC Randomly selected schools will be asked to submit plans to NCDPI Pre-site review • • Plans examined and schools identified for onsite review Additional documentation may be requested
 – On-site")
Participation Requirements Year 2 Monitoring Plan Ø NCDPI Monitoring Plan (cont. ) – On-site review • • • – Schools selected will be visited by NCDPI staff Visit will occur no later than 1 month prior to testing Review/Discuss documentation submitted » Strengths and weaknesses State Response and Targeted Assistance • • Provide recommendations and targeted assistance Letter summarizing visit mailed to LEA superintendent/charter director within 90 days of onsite visit

Participation Requirements Schools in both Year 1 and Year 2 Ø Schools with subgroups in both years must complete both requirements ‒ ‒ Are not required to include information about Year 2 in Year 1 letter, but are encouraged to do so Are not required to include Year 1 subgroups in intensive intervention plan for Year 2, but are encouraged to do so

Participation Requirements Year 3 Explanation Ø Year 3 Requirements – NCDPI counts non-participating students as not proficient • • – Number added will be the number of students needed to raise participation to 95% These students will be added to the denominator of the AMO performance target Within 30 days after accountability results are approved school must send letter to parents • Includes plan of action to ensure full participation for all subgroups targeting those missing participation
 – – –")
Participation Requirements Year 3 Explanation Ø Year 3 Requirements (cont. ) – – – Within 30 days a copy of letter from each school, including plan of action, submitted to Regional Accountability Coordinator (RAC) RAC submits to NCDPI with 35 days Upon receipt NCDPI will contact schools not in compliance

Participation Requirements Ken Barbour George Stubblefield Analysis and Reporting

Accountability Information Technology Team Ø Update on 20 th day files for 2015 Ø Setting up the New computers Ø Moving Winscan to new computers Ø Moving data to new computers Ø When will we get Office? Ø Who uses MYSQL in Ready. Tools? Ø Do you need training for Ready Tools Ø Training other Ø Questions on SSH Ø Other questions 142

Accountability Information Technology Team Ø A new Win. Scan 32 release for 2014 -15 ØCCRAA Grade 10 – PLAN Alternate ØOctober testing window ØNo scores available at this time (January 2015? ) ØScanned locally ØNote that the CCRAA Grade 11 (March 2015) will be sent to TOPS for processing 143

Accountability Information Technology Team Ø Flexible Testing Waivers ØEOC ØModify the “Test. Date” to differentiate from Summer ØNC Final Exams: use Spring 2014 tests but scan using files in the NCFE 14 Fall folder ØCan use 2014 -15 grade conversions ØNeed to keep separate from the Dec. NCFE tests which will be new and have different answer keys and need new grade conversions 144

Accountability Information Technology Team Ø For the EOC Flexible Testing Waivers and EOC Credit by Demonstrated Mastery Ø Continue to download V 14 ODF files to Scan 1314ODF Ø English II Delay in Scoring Ø When the new EOC and NCFE tests are available in December (perhaps mid-November), the downloaded online files will be stored in Scan 1415ODF and have a V 15 file name extension Ø Users might need to update the settings in READYTools 145

Every Student READY Questions?
- Slides: 145