
Acceleration for Beginners Jesse Kiefner Director Accelerated Math
Acceleration for Beginners Jesse Kiefner Director, Accelerated Math Program Danielle Truszkowski Assistant Director, Accelerated Math Program
Today’s Agenda Nuts and Bolts of AMP Marketing Data Advising Faculty Training Scaling Up Engagement Activities

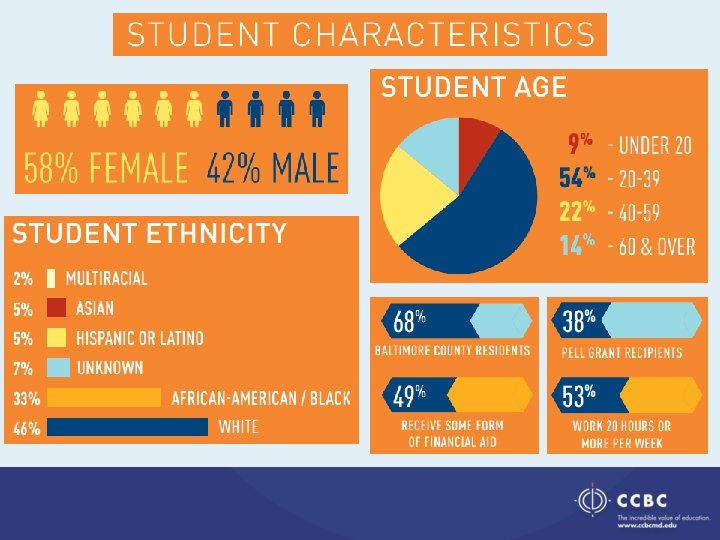
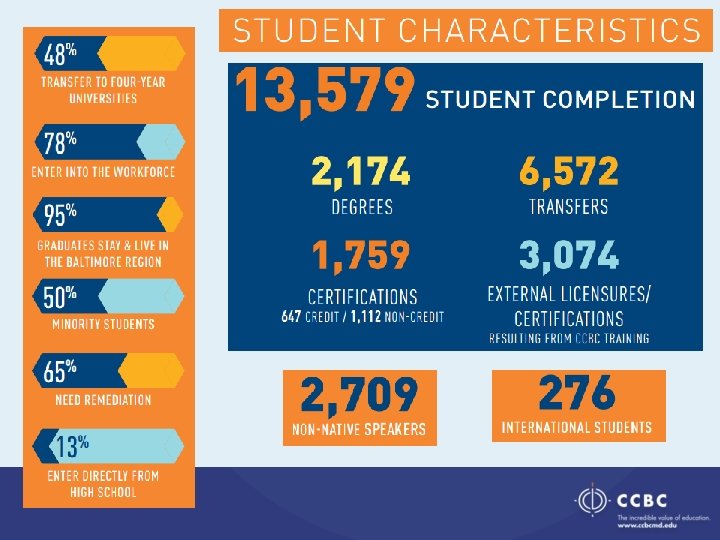
Who is CCBC?
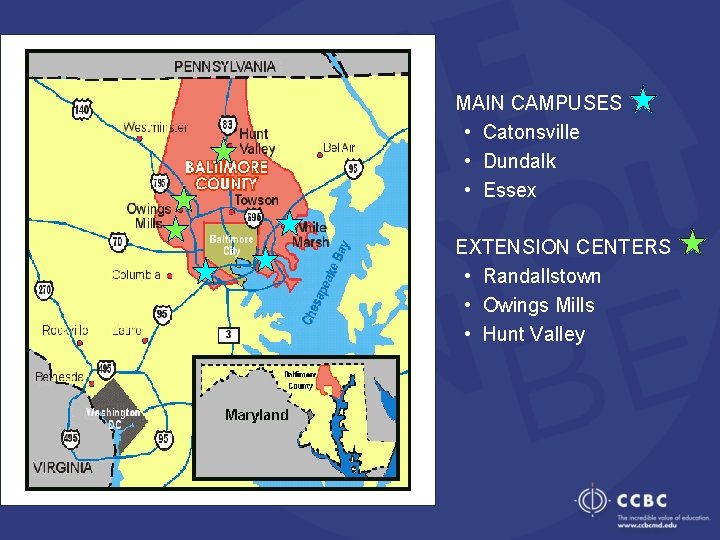
MAIN CAMPUSES • Catonsville • Dundalk • Essex EXTENSION CENTERS • Randallstown • Owings Mills • Hunt Valley
Mathematics Department
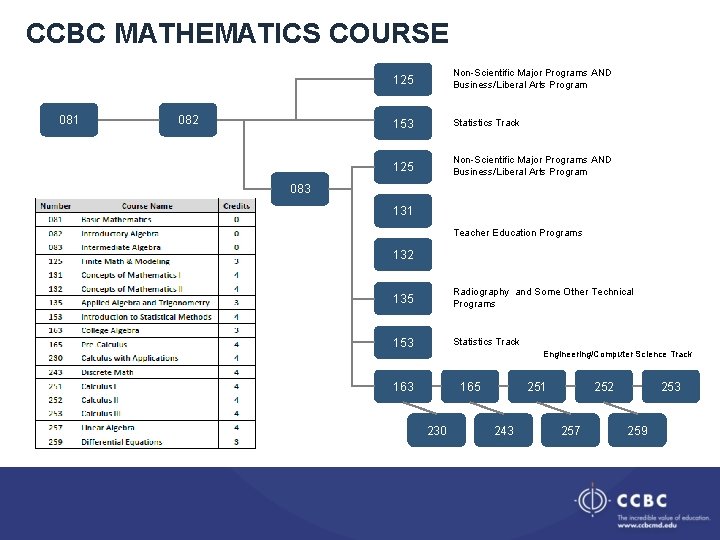
CCBC MATHEMATICS COURSE 081 082 125 Non-Scientific Major Programs AND Business/Liberal Arts Program 153 Statistics Track 125 Non-Scientific Major Programs AND Business/Liberal Arts Program 083 131 Teacher Education Programs 132 135 Radiography and Some Other Technical Programs 153 Statistics Track Engineering/Computer Science Track 163 165 230 251 243 252 257 253 259
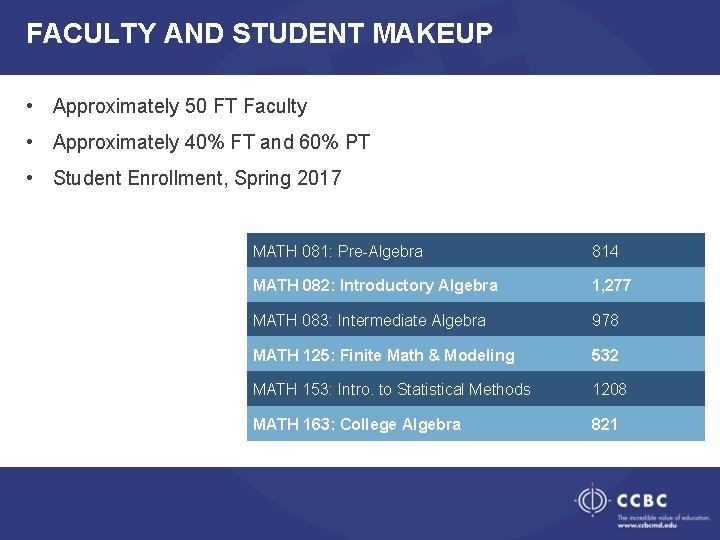
FACULTY AND STUDENT MAKEUP • Approximately 50 FT Faculty • Approximately 40% FT and 60% PT • Student Enrollment, Spring 2017 MATH 081: Pre-Algebra 814 MATH 082: Introductory Algebra 1, 277 MATH 083: Intermediate Algebra 978 MATH 125: Finite Math & Modeling 532 MATH 153: Intro. to Statistical Methods 1208 MATH 163: College Algebra 821
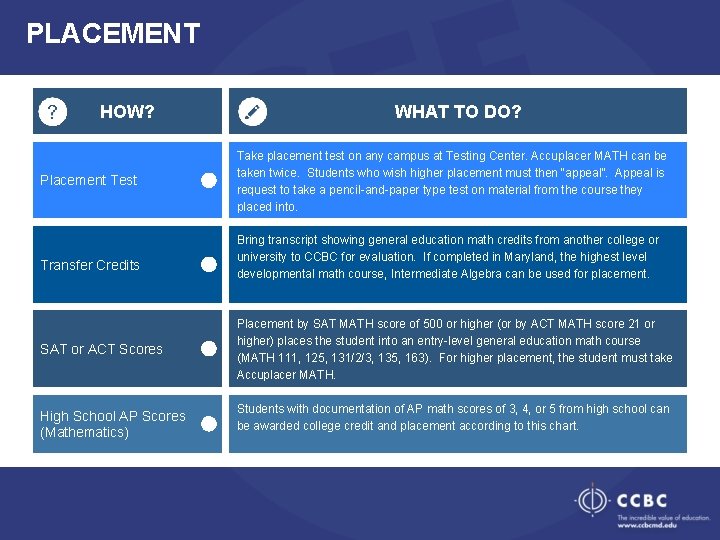
PLACEMENT HOW? Placement Test Transfer Credits SAT or ACT Scores High School AP Scores (Mathematics) WHAT TO DO? Take placement test on any campus at Testing Center. Accuplacer MATH can be taken twice. Students who wish higher placement must then “appeal”. Appeal is request to take a pencil-and-paper type test on material from the course they placed into. Bring transcript showing general education math credits from another college or university to CCBC for evaluation. If completed in Maryland, the highest level developmental math course, Intermediate Algebra can be used for placement. Placement by SAT MATH score of 500 or higher (or by ACT MATH score 21 or higher) places the student into an entry-level general education math course (MATH 111, 125, 131/2/3, 135, 163). For higher placement, the student must take Accuplacer MATH. Students with documentation of AP math scores of 3, 4, or 5 from high school can be awarded college credit and placement according to this chart.

Mathematics Acceleration
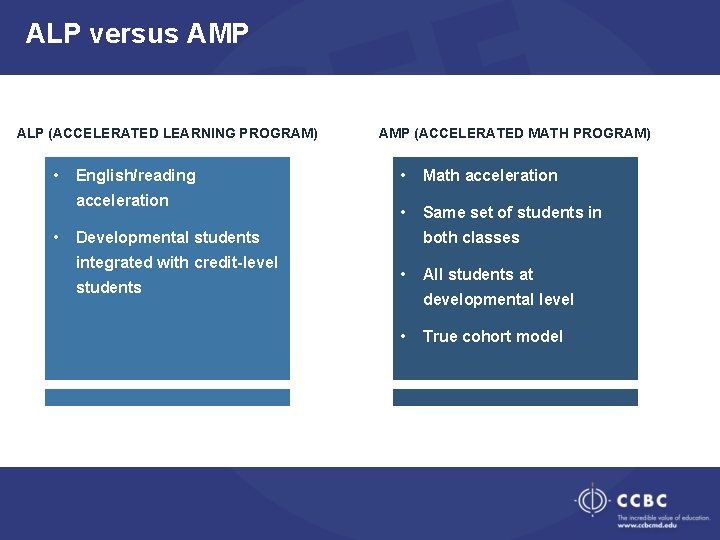
ALP versus AMP ALP (ACCELERATED LEARNING PROGRAM) • • • English/reading acceleration Developmental students integrated with AMP (ACCELERATED MATH PROGRAM) • students Math acceleration • • Same set of students in One set of students in both classes • credit-level Developmental students integrated with credit-level • Math acceleration • both classes All students at developmental level • • True cohort model All students at developmental level • True cohort model

Why is math acceleration needed? Incoming Students Not College-Ready in Mathematics ≈ 70% Success Rates of Traditional Developmental Mathematics Courses ≈ 50% SB 740 – Pathway Must Include Credit Bearing Math and English Within the First 24 Credit Hours of Courses for First Time Degree Seeking Students
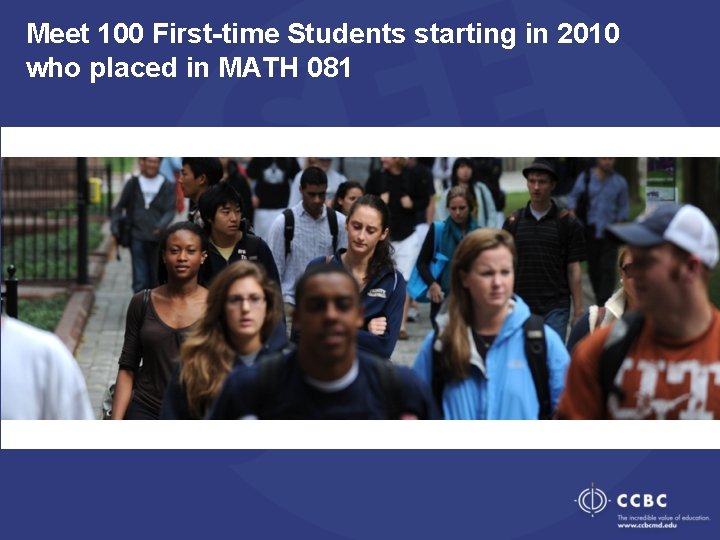
Meet 100 First-time Students starting in 2010 who placed in MATH 081
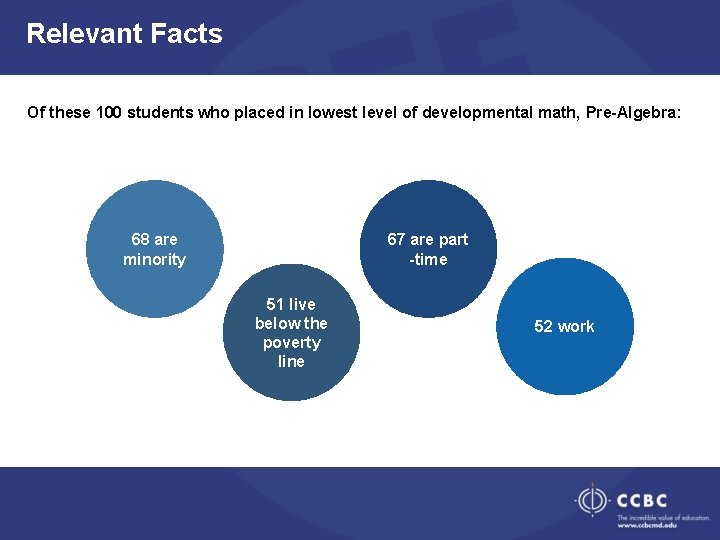
Relevant Facts Of these 100 students who placed in lowest level of developmental math, Pre-Algebra: 68 are minority 67 are part -time 51 live below the poverty line 52 work
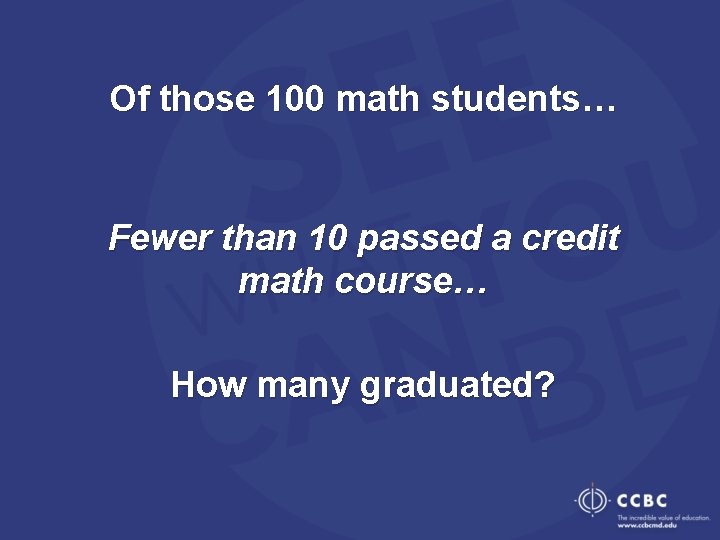
Of those 100 math students… Fewer than 10 passed a credit math course… How many graduated?

three
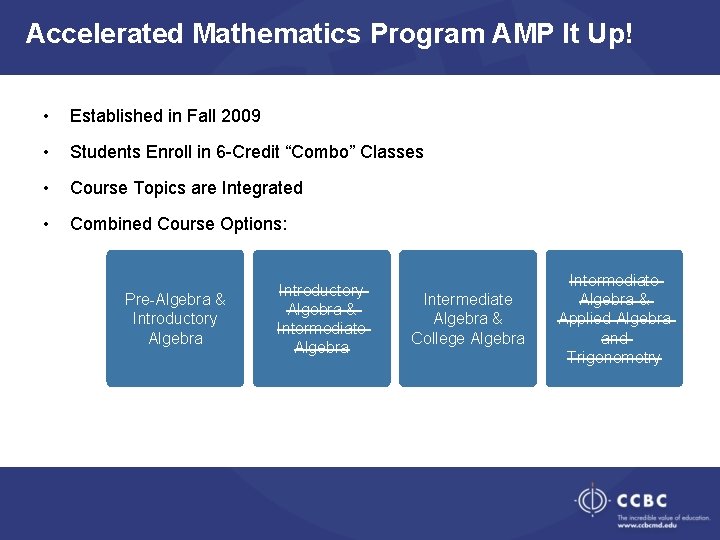
Accelerated Mathematics Program AMP It Up! • Established in Fall 2009 • Students Enroll in 6 -Credit “Combo” Classes • Course Topics are Integrated • Combined Course Options: Pre-Algebra & Introductory Algebra & Intermediate Algebra & College Algebra Intermediate Algebra & Applied Algebra and Trigonometry
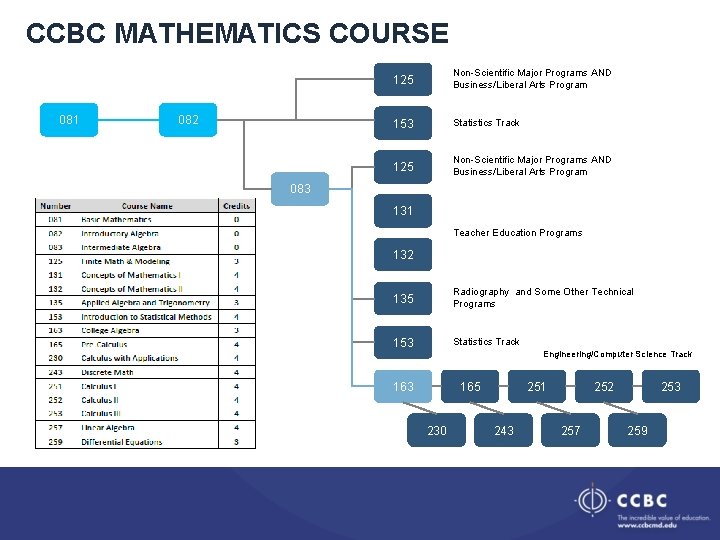
CCBC MATHEMATICS COURSE 081 082 125 Non-Scientific Major Programs AND Business/Liberal Arts Program 153 Statistics Track 125 Non-Scientific Major Programs AND Business/Liberal Arts Program 083 131 Teacher Education Programs 132 135 Radiography and Some Other Technical Programs 153 Statistics Track Engineering/Computer Science Track 163 165 230 251 243 252 257 253 259

Early Data Analysis
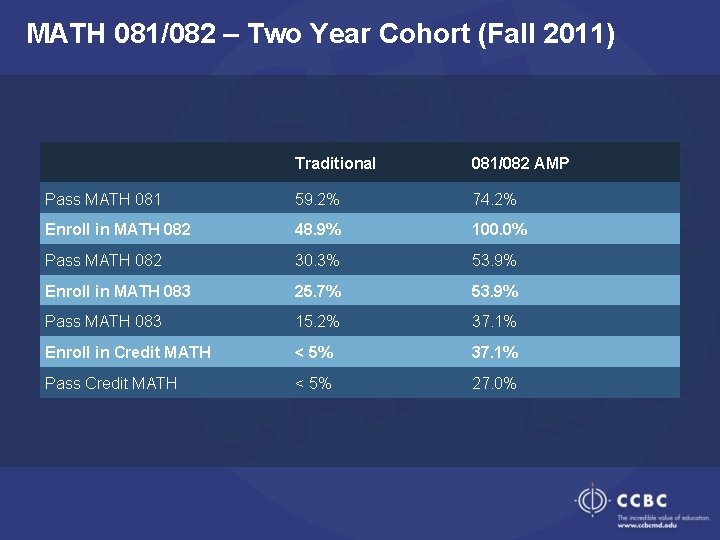
MATH 081/082 – Two Year Cohort (Fall 2011) Traditional 081/082 AMP Pass MATH 081 59. 2% 74. 2% Enroll in MATH 082 48. 9% 100. 0% Pass MATH 082 30. 3% 53. 9% Enroll in MATH 083 25. 7% 53. 9% Pass MATH 083 15. 2% 37. 1% Enroll in Credit MATH < 5% 37. 1% Pass Credit MATH < 5% 27. 0%
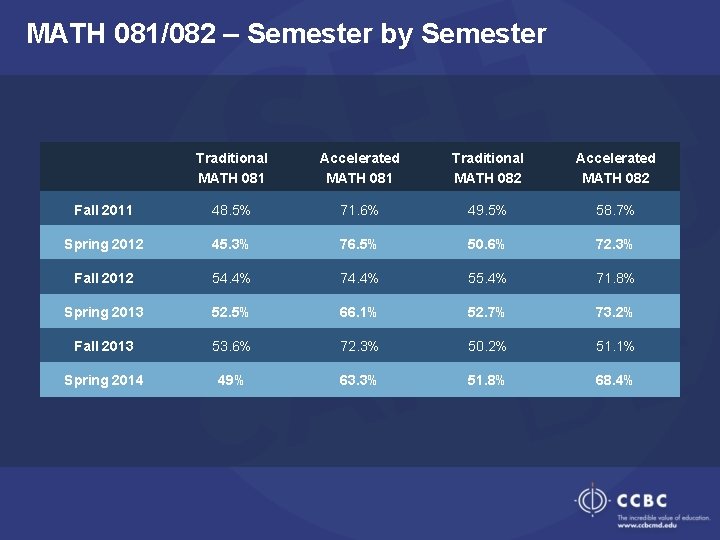
MATH 081/082 – Semester by Semester Traditional MATH 081 Accelerated MATH 081 Traditional MATH 082 Accelerated MATH 082 Fall 2011 48. 5% 71. 6% 49. 5% 58. 7% Spring 2012 45. 3% 76. 5% 50. 6% 72. 3% Fall 2012 54. 4% 74. 4% 55. 4% 71. 8% Spring 2013 52. 5% 66. 1% 52. 7% 73. 2% Fall 2013 53. 6% 72. 3% 50. 2% 51. 1% Spring 2014 49% 63. 3% 51. 8% 68. 4%
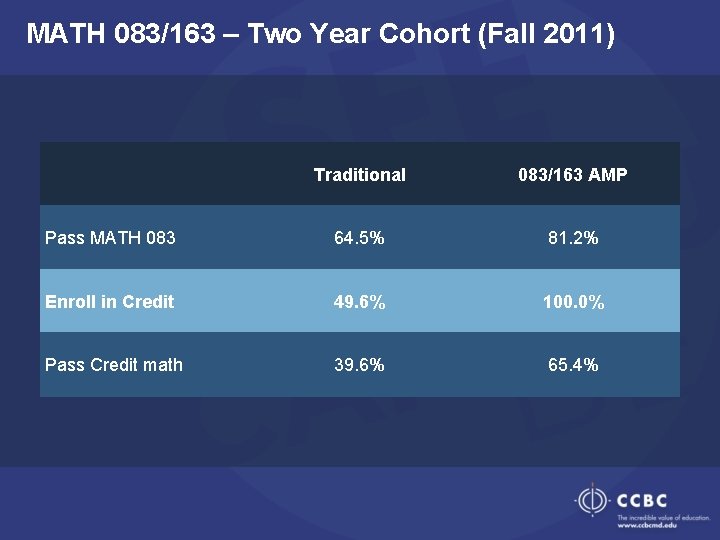
MATH 083/163 – Two Year Cohort (Fall 2011) Traditional 083/163 AMP Pass MATH 083 64. 5% 81. 2% Enroll in Credit 49. 6% 100. 0% Pass Credit math 39. 6% 65. 4%
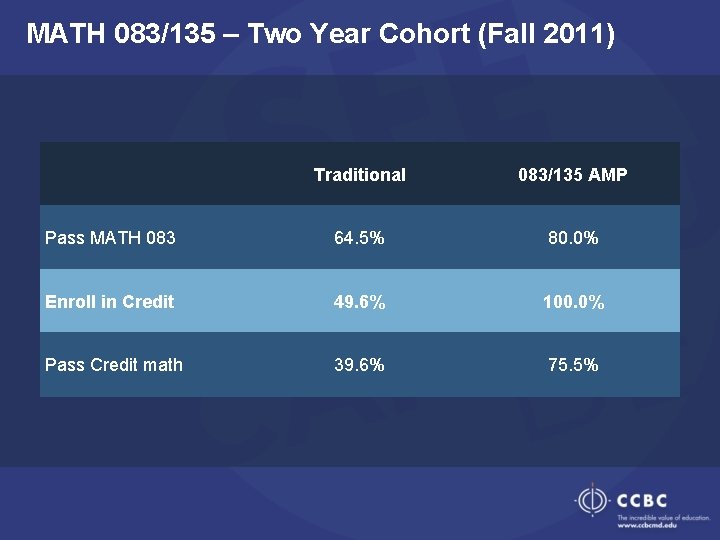
MATH 083/135 – Two Year Cohort (Fall 2011) Traditional 083/135 AMP Pass MATH 083 64. 5% 80. 0% Enroll in Credit 49. 6% 100. 0% Pass Credit math 39. 6% 75. 5%
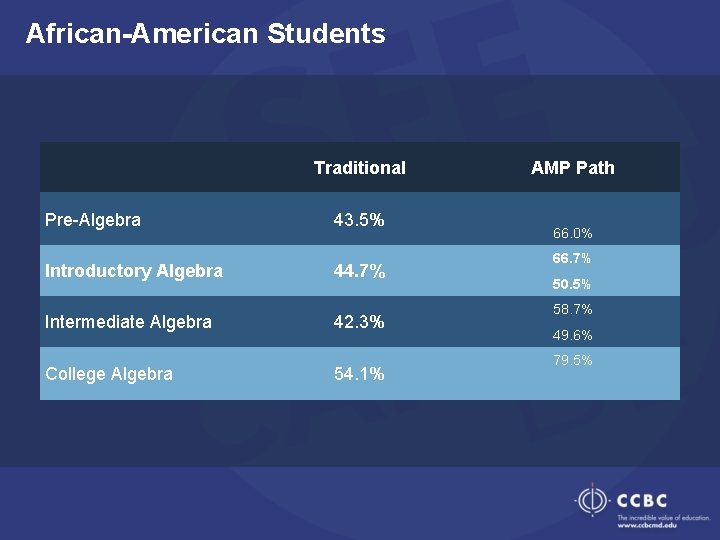
African-American Students Traditional Pre-Algebra Introductory Algebra 43. 5% 44. 7% Intermediate Algebra 42. 3% College Algebra 54. 1% AMP Path 66. 0% 66. 7% 50. 5% 58. 7% 49. 6% 79. 5%
Latest Data Analysis – Students Beginning at the MATH 081 Level
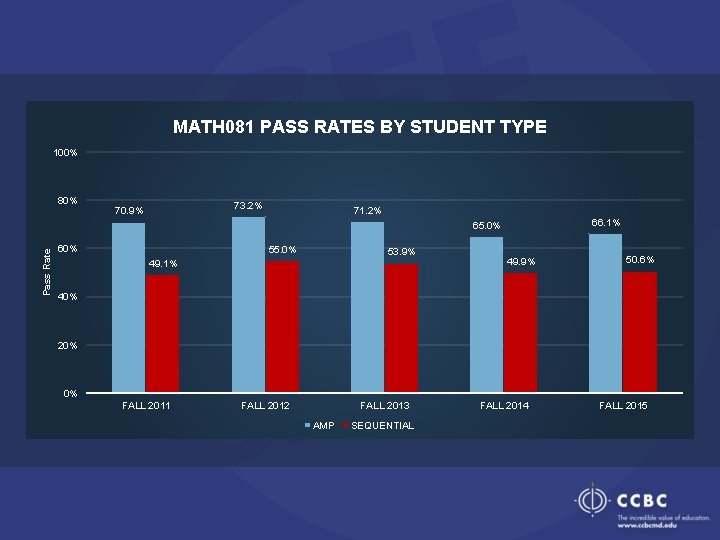
MATH 081 PASS RATES BY STUDENT TYPE 100% 80% 73. 2% 70. 9% 71. 2% 66. 1% Pass Rate 65. 0% 60% 55. 0% 53. 9% 49. 1% 49. 9% 50. 6% 40% 20% 0% FALL 2011 FALL 2012 FALL 2013 AMP SEQUENTIAL FALL 2014 FALL 2015
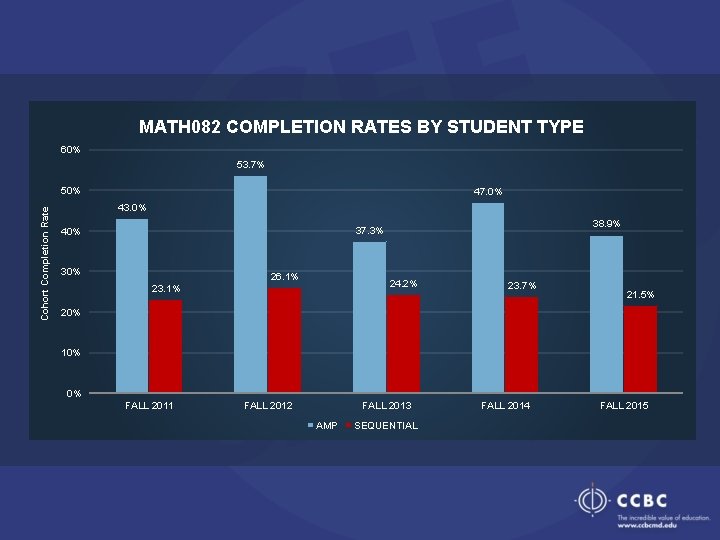
MATH 082 COMPLETION RATES BY STUDENT TYPE 60% 53. 7% Cohort Completion Rate 50% 47. 0% 43. 0% 38. 9% 37. 3% 40% 30% 26. 1% 24. 2% 23. 1% 23. 7% 21. 5% 20% 10% 0% FALL 2011 FALL 2012 FALL 2013 AMP SEQUENTIAL FALL 2014 FALL 2015
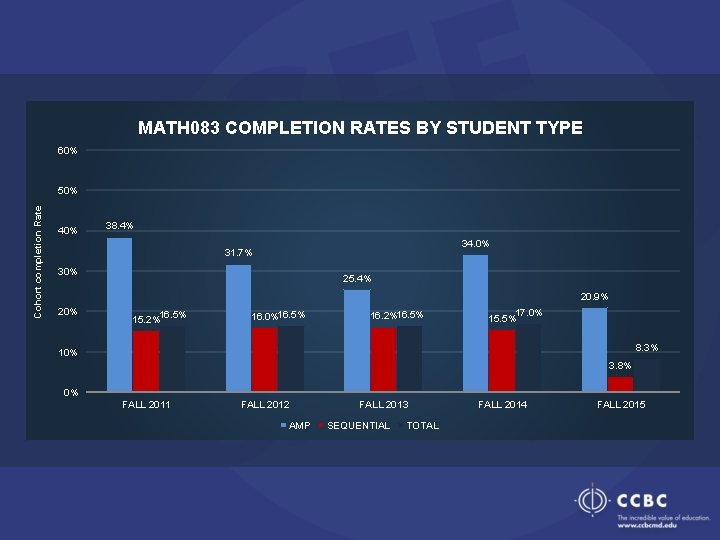
MATH 083 COMPLETION RATES BY STUDENT TYPE 60% Cohort completion Rate 50% 40% 38. 4% 34. 0% 31. 7% 30% 25. 4% 20. 9% 20% 16. 5% 15. 2% 16. 0%16. 5% 16. 2%16. 5% 17. 0% 15. 5% 8. 3% 10% 3. 8% 0% FALL 2011 FALL 2012 AMP FALL 2013 SEQUENTIAL TOTAL FALL 2014 FALL 2015
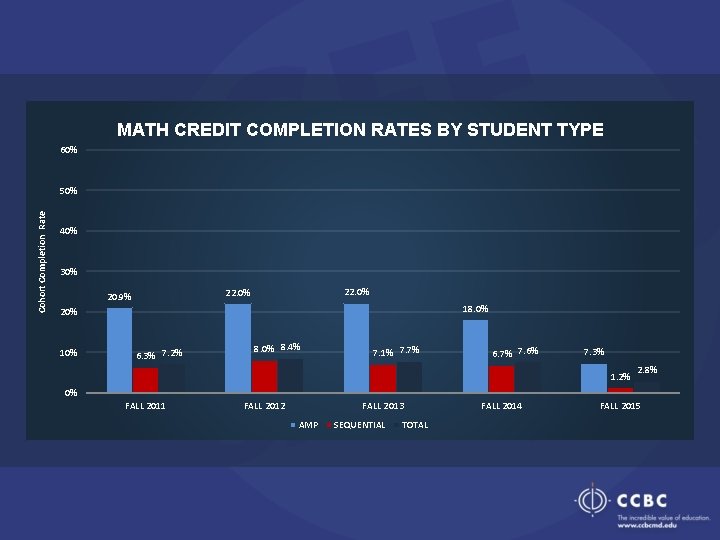
MATH CREDIT COMPLETION RATES BY STUDENT TYPE 60% Cohort Completion Rate 50% 40% 30% 22. 0% 20. 9% 18. 0% 20% 10% 6. 3% 7. 2% 8. 0% 8. 4% 7. 1% 7. 7% 6. 7% 7. 6% 7. 3% 1. 2% 2. 8% 0% FALL 2011 FALL 2012 FALL 2013 AMP SEQUENTIAL TOTAL FALL 2014 FALL 2015
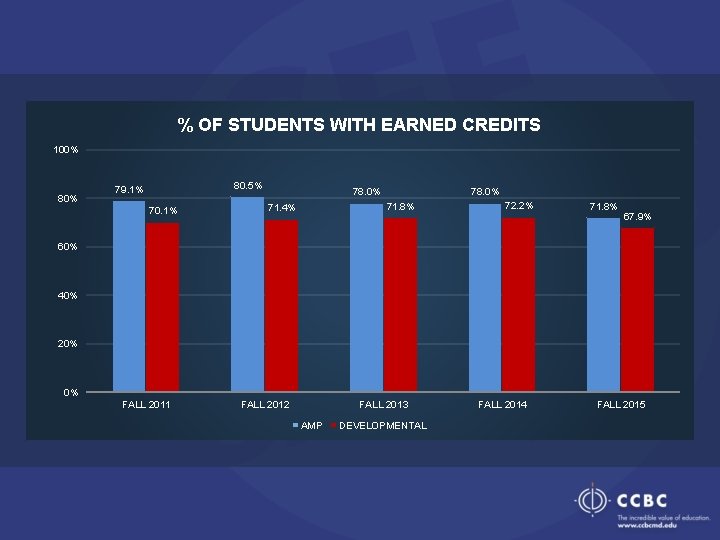
% OF STUDENTS WITH EARNED CREDITS 100% 80. 5% 79. 1% 70. 1% 78. 0% 71. 8% 71. 4% 72. 2% 71. 8% 67. 9% 60% 40% 20% 0% FALL 2011 FALL 2012 FALL 2013 AMP DEVELOPMENTAL FALL 2014 FALL 2015
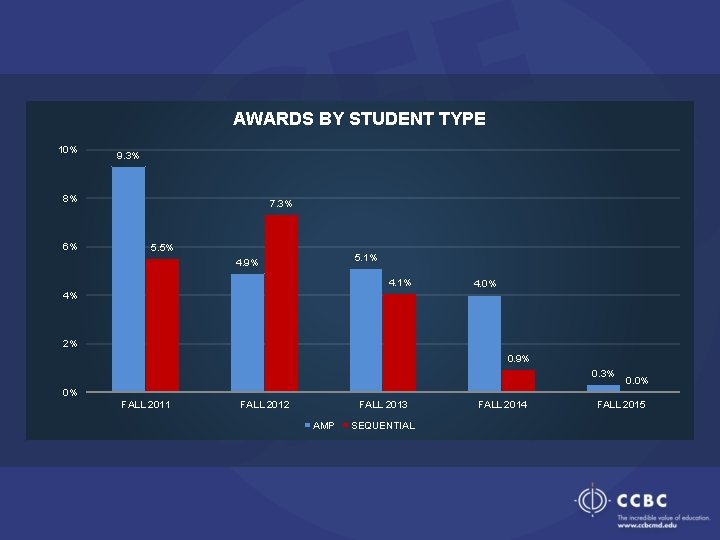
10% AWARDS BY STUDENT TYPE % OF STUDENTS WITH EARNED CREDITS 9. 3% 100% 8% 80% 60% 80. 5% 79. 1% 70. 1% 6% 7. 3% 71. 4% 5. 5% 4. 9% 78. 0% 72. 2% 71. 8% 67. 9% 5. 1% 4. 0% 4% 20% 2% 0. 9% 0. 3% 0% 0% FALL 2011 FALL 2012 FALL 2013 AMP DEVELOPMENTAL AMP SEQUENTIAL FALL 2014 0. 0% FALL 2015
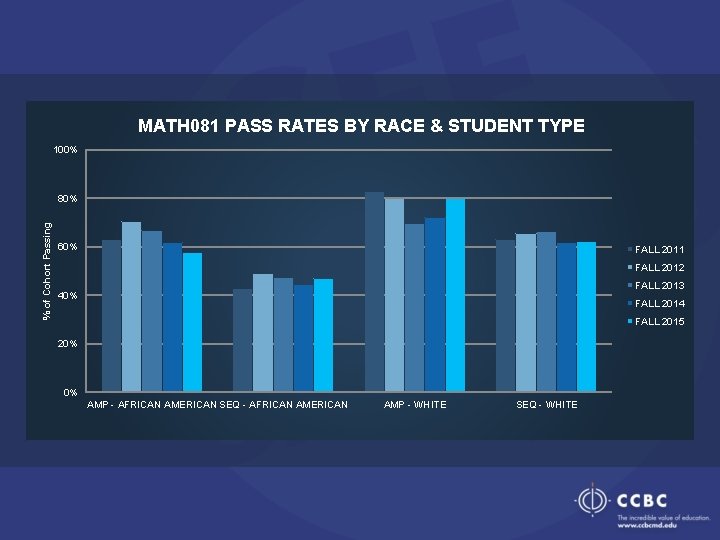
MATH 081 PASS RATES BY RACE & STUDENT TYPE 100% % of Cohort Passing 80% 60% FALL 2011 FALL 2012 FALL 2013 40% FALL 2014 FALL 2015 20% 0% AMP - AFRICAN AMERICAN SEQ - AFRICAN AMERICAN AMP - WHITE SEQ - WHITE
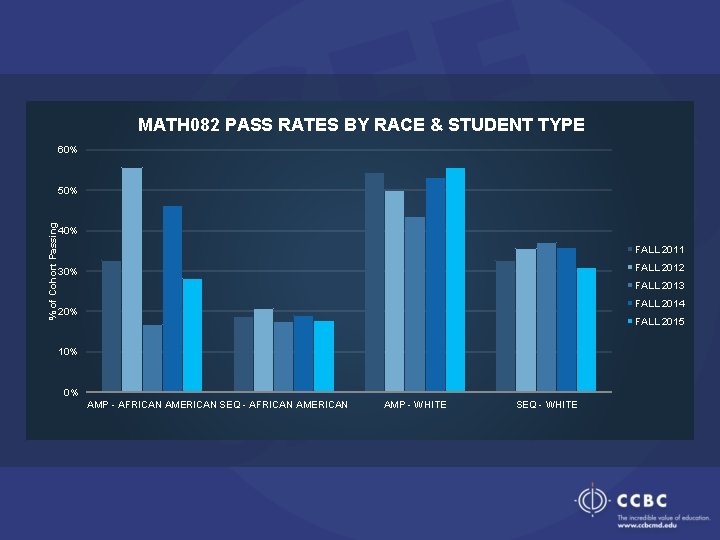
MATH 082 PASS RATES BY RACE & STUDENT TYPE 60% % of Cohort Passing 50% 40% FALL 2011 FALL 2012 30% FALL 2013 FALL 2014 20% FALL 2015 10% 0% AMP - AFRICAN AMERICAN SEQ - AFRICAN AMERICAN AMP - WHITE SEQ - WHITE
Latest Data Analysis – Students Beginning at the MATH 083 Level
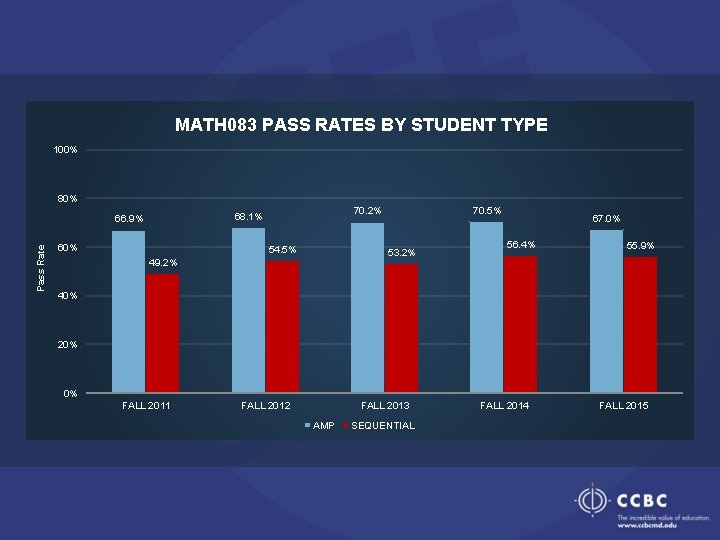
MATH 083 PASS RATES BY STUDENT TYPE 100% 80% Pass Rate 60% 70. 5% 70. 2% 68. 1% 66. 9% 54. 5% 53. 2% 49. 2% 67. 0% 56. 4% 55. 9% 40% 20% 0% FALL 2011 FALL 2012 FALL 2013 AMP SEQUENTIAL FALL 2014 FALL 2015
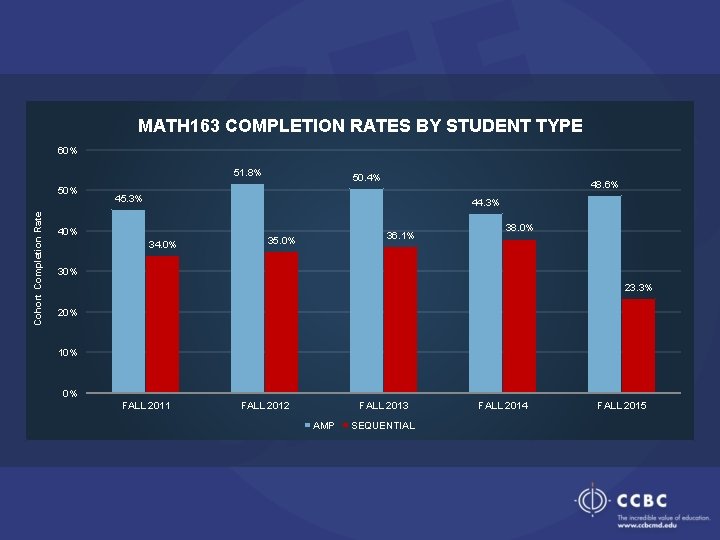
MATH 163 COMPLETION RATES BY STUDENT TYPE 60% 51. 8% Cohort Completion Rate 50% 50. 4% 48. 6% 45. 3% 44. 3% 40% 34. 0% 36. 1% 35. 0% 38. 0% 30% 23. 3% 20% 10% 0% FALL 2011 FALL 2012 FALL 2013 AMP SEQUENTIAL FALL 2014 FALL 2015
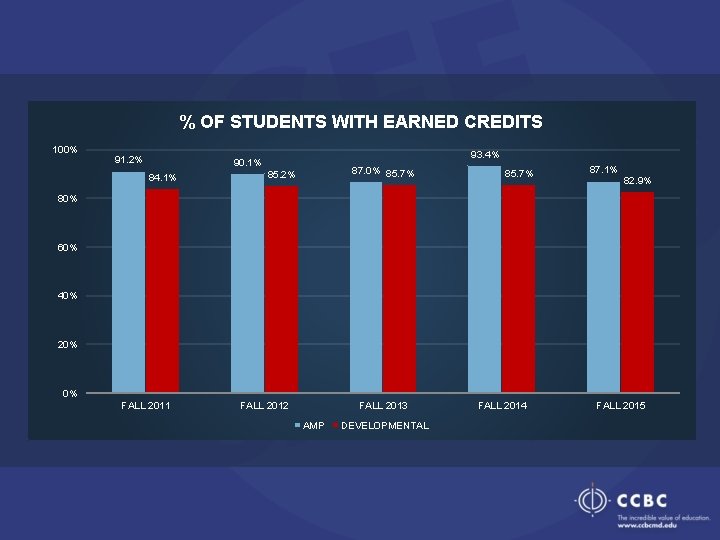
% OF STUDENTS WITH EARNED CREDITS 100% 91. 2% 93. 4% 90. 1% 84. 1% 87. 0% 85. 7% 85. 2% 85. 7% 87. 1% 82. 9% 80% 60% 40% 20% 0% FALL 2011 FALL 2012 FALL 2013 AMP DEVELOPMENTAL FALL 2014 FALL 2015
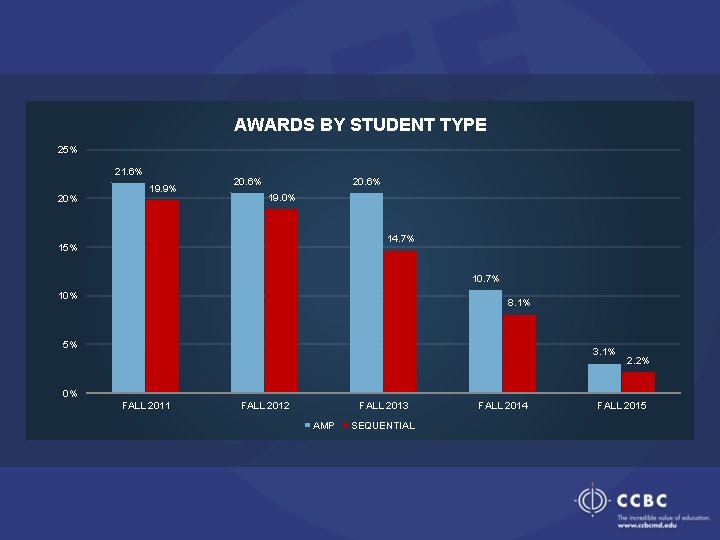
AWARDS BY STUDENT TYPE 25% 21. 6% 20% 19. 9% 20. 6% 19. 0% 14. 7% 15% 10. 7% 10% 8. 1% 5% 3. 1% 2. 2% 0% FALL 2011 FALL 2012 FALL 2013 AMP SEQUENTIAL FALL 2014 FALL 2015
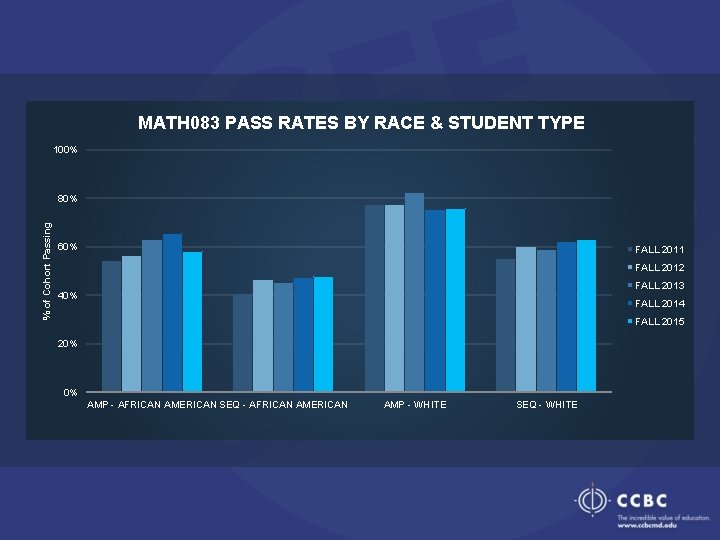
MATH 083 PASS RATES BY RACE & STUDENT TYPE 100% % of Cohort Passing 80% 60% FALL 2011 FALL 2012 FALL 2013 40% FALL 2014 FALL 2015 20% 0% AMP - AFRICAN AMERICAN SEQ - AFRICAN AMERICAN AMP - WHITE SEQ - WHITE
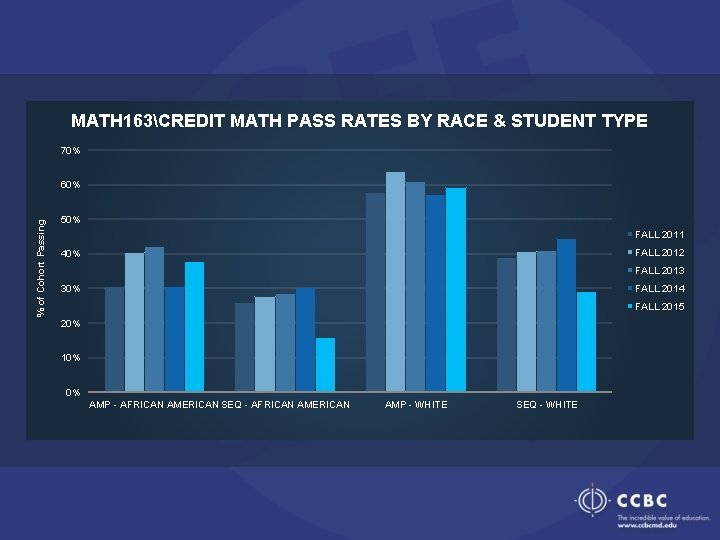
MATH 163CREDIT MATH PASS RATES BY RACE & STUDENT TYPE 70% % of Cohort Passing 60% 50% FALL 2011 FALL 2012 40% FALL 2013 FALL 2014 30% FALL 2015 20% 10% 0% AMP - AFRICAN AMERICAN SEQ - AFRICAN AMERICAN AMP - WHITE SEQ - WHITE
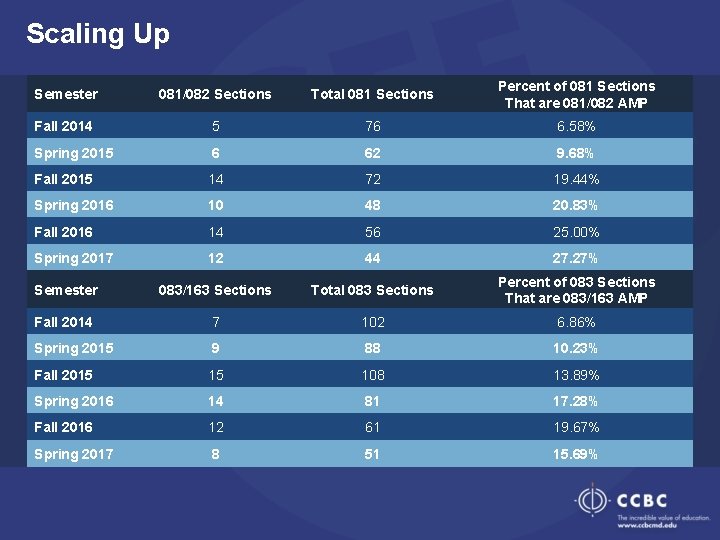
Scaling Up Semester 081/082 Sections Total 081 Sections Percent of 081 Sections That are 081/082 AMP Fall 2014 5 76 6. 58% Spring 2015 6 62 9. 68% Fall 2015 14 72 19. 44% Spring 2016 10 48 20. 83% Fall 2016 14 56 25. 00% Spring 2017 12 44 27. 27% Semester 083/163 Sections Total 083 Sections Percent of 083 Sections That are 083/163 AMP Fall 2014 7 102 6. 86% Spring 2015 9 88 10. 23% Fall 2015 15 108 13. 89% Spring 2016 14 81 17. 28% Fall 2016 12 61 19. 67% Spring 2017 8 51 15. 69%

Building the Program
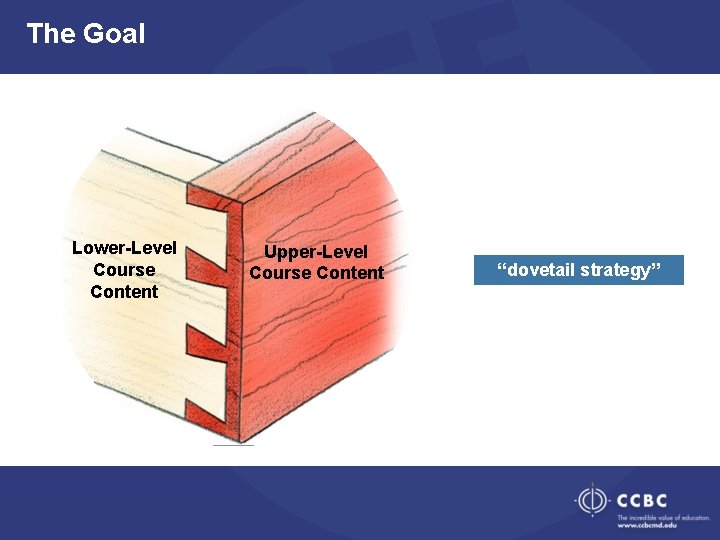
The Goal Lower-Level Course Content Upper-Level Course Content “dovetail strategy”
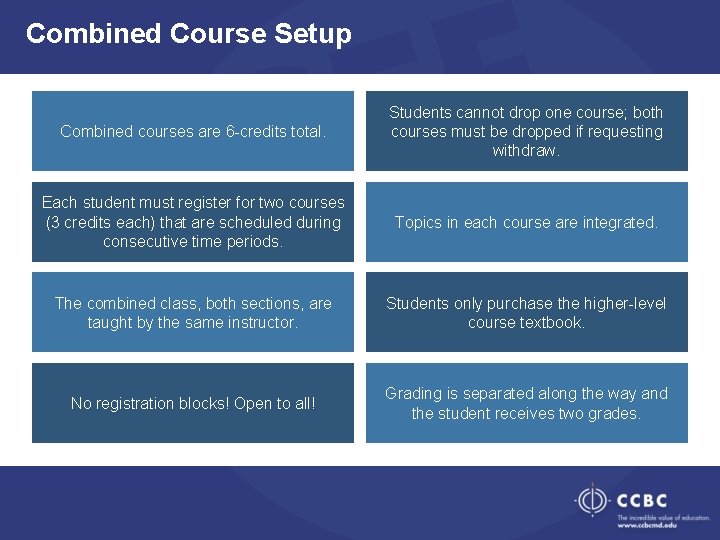
Combined Course Setup Combined courses are 6 -credits total. Students cannot drop one course; both courses must be dropped if requesting withdraw. Each student must register for two courses (3 credits each) that are scheduled during consecutive time periods. Topics in each course are integrated. The combined class, both sections, are taught by the same instructor. Students only purchase the higher-level course textbook. No registration blocks! Open to all! Grading is separated along the way and the student receives two grades.

Administrative Details Scheduling Six Hour Classes Online Registration Number of Students Per Class Using Existing Courses
How Do We Integrate?
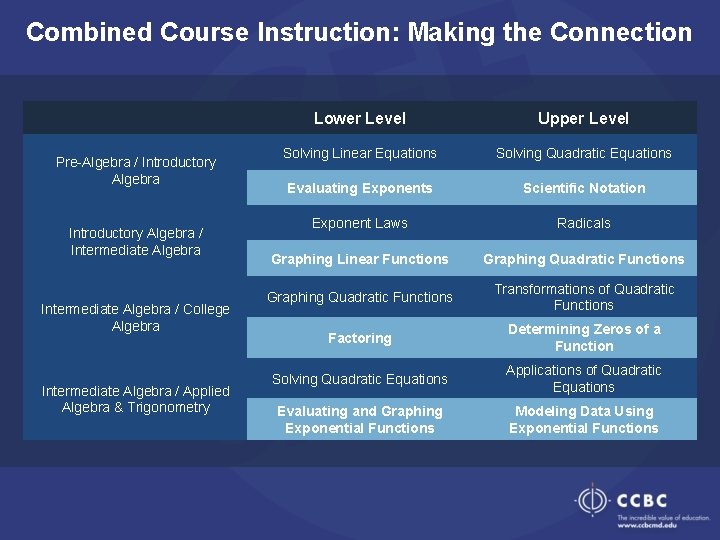
Combined Course Instruction: Making the Connection Pre-Algebra / Introductory Algebra / Intermediate Algebra / College Algebra Intermediate Algebra / Applied Algebra & Trigonometry Lower Level Upper Level Solving Linear Equations Solving Quadratic Equations Evaluating Exponents Scientific Notation Exponent Laws Radicals Graphing Linear Functions Graphing Quadratic Functions Transformations of Quadratic Functions Factoring Determining Zeros of a Function Solving Quadratic Equations Applications of Quadratic Equations Evaluating and Graphing Exponential Functions Modeling Data Using Exponential Functions
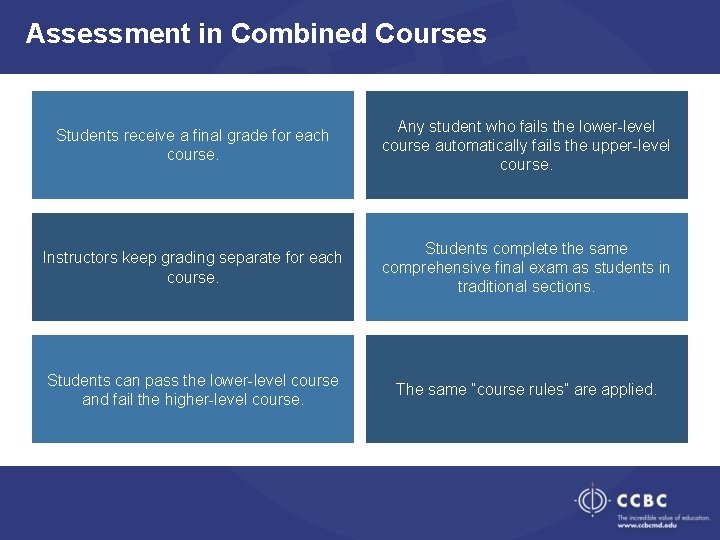
Assessment in Combined Courses Students receive a final grade for each course. Any student who fails the lower-level course automatically fails the upper-level course. Instructors keep grading separate for each course. Students complete the same comprehensive final exam as students in traditional sections. Students can pass the lower-level course and fail the higher-level course. The same “course rules” are applied.
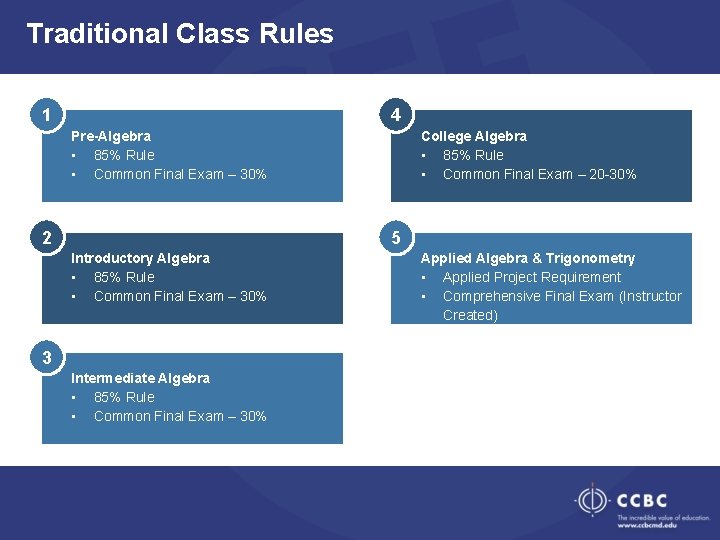
Traditional Class Rules 1 4 Pre-Algebra • 85% Rule • Common Final Exam – 30% 2 College Algebra • 85% Rule • Common Final Exam – 20 -30% 5 Introductory Algebra • 85% Rule • Common Final Exam – 30% 3 Intermediate Algebra • 85% Rule • Common Final Exam – 30% Applied Algebra & Trigonometry • Applied Project Requirement • Comprehensive Final Exam (Instructor Created)
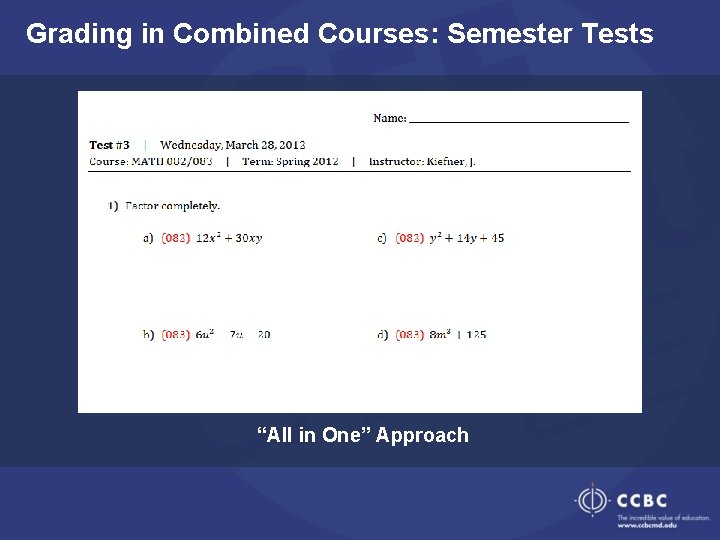
Grading in Combined Courses: Semester Tests “All in One” Approach
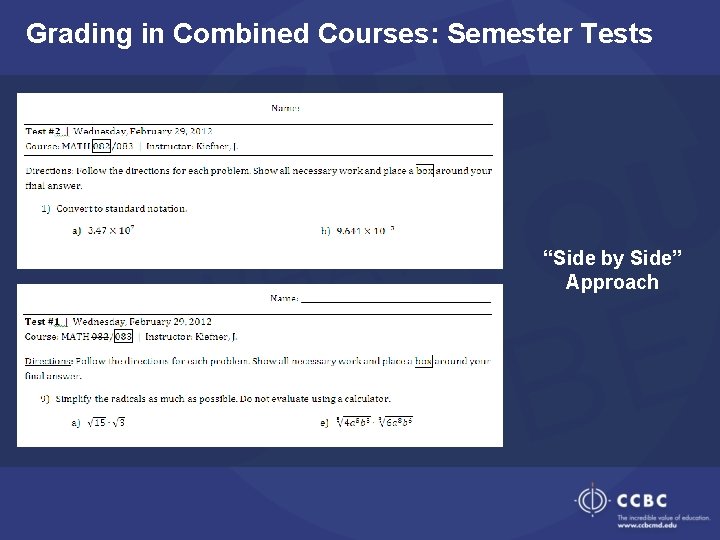
Grading in Combined Courses: Semester Tests “Side by Side” Approach
Advantages of Combined Setup Overlap in course content allows for additional time to devote to more challenging topics. Students form a supportive cohort. Students are able to see the connection and relation between two math courses; content doesn’t appear disjoint.
Supplementing with OERs
How do we make up for missing content? OPEN SOURCE TEXTBOOKS http: //www. ccbcmd. edu/Programs-and-Courses/Schools-and-Academic. Departments/School-of-Mathematics-and-Science/Mathematics. aspx ORIGINAL TEXTBOOK SOURCES http: //www. wallace. ccfaculty. org/ http: //www. mathispower 4 u. com/ ONLINE HOMEWORK (OPTIONAL) www. myopenmath. com or ALEKS (MATH 083/163)

Facilitating Student Engagement
Managing Extra Time INTERACTIVE LABS (OPTIONAL) • Modeling Tuition Lab • Bottle Water Flow lab • Exponential Decay Lab • Work Together Lab GROUP SESSIONS REVIEW FOR EXAMS
Lab 1 • Students model the CCBC tuition billing structure using a linear equation. • The y-intercept and slope are considered in the context of an application. • The linear model is examined graphically. • Students find this lab eye-opening.
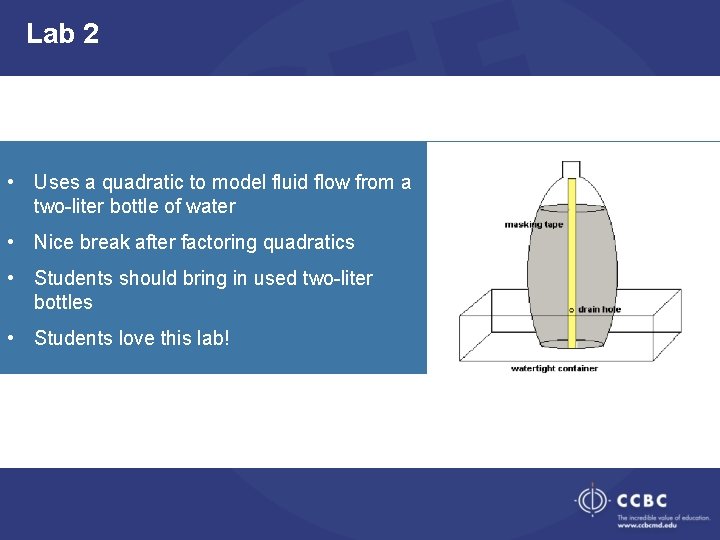
Lab 2 • Uses a quadratic to model fluid flow from a two-liter bottle of water • Nice break after factoring quadratics • Students should bring in used two-liter bottles • Students love this lab!
Lab 3 • Exponential decay problem involving the environmental impact of tropical rainforest destruction. • Students create an exponential model and use it to predict the amount of rainforest remaining in the future. • Students use logarithms to solve exponential equations. • Students don’t exactly love this lab.
Lab 4 • Similar to Lab 2, students use a water flow experiment to test the validity of a rational equation that predicts the time required to drain a container. • Difficult logistically because students must fill the container and let water drain three times. • Students love this lab.

Marketing
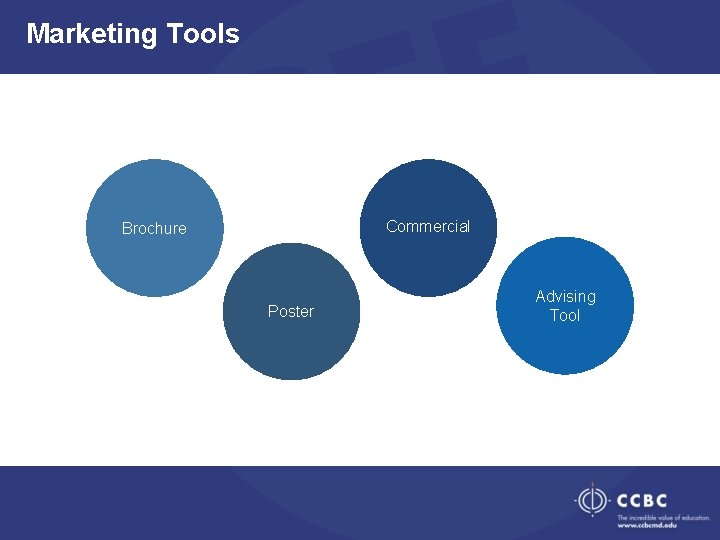
Marketing Tools Commercial Brochure Poster Advising Tool

Faculty Training Model
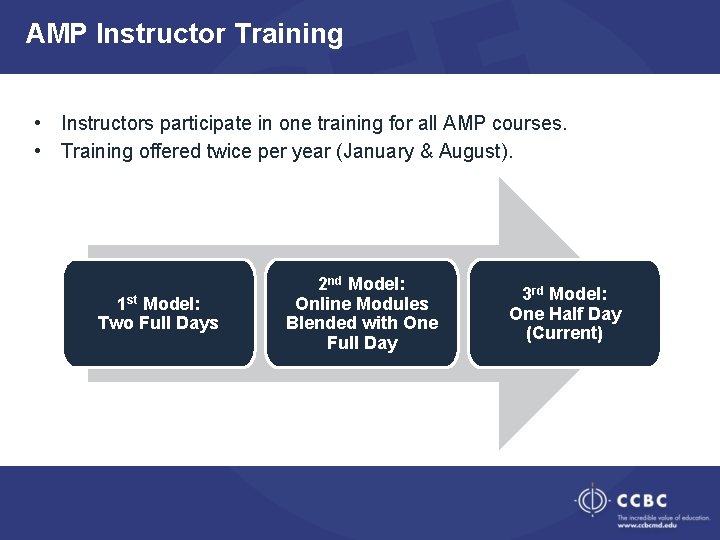
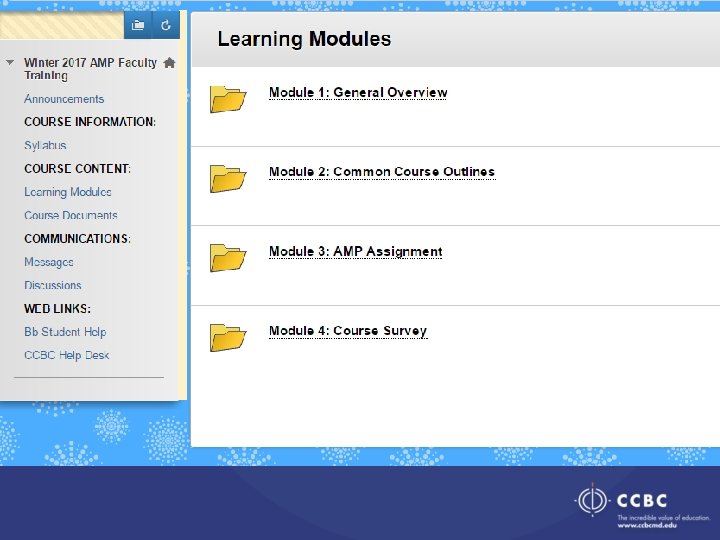
AMP Instructor Training • Instructors participate in one training for all AMP courses. • Training offered twice per year (January & August). 1 st Model: Two Full Days 2 nd Model: Online Modules Blended with One Full Day 3 rd Model: One Half Day (Current)
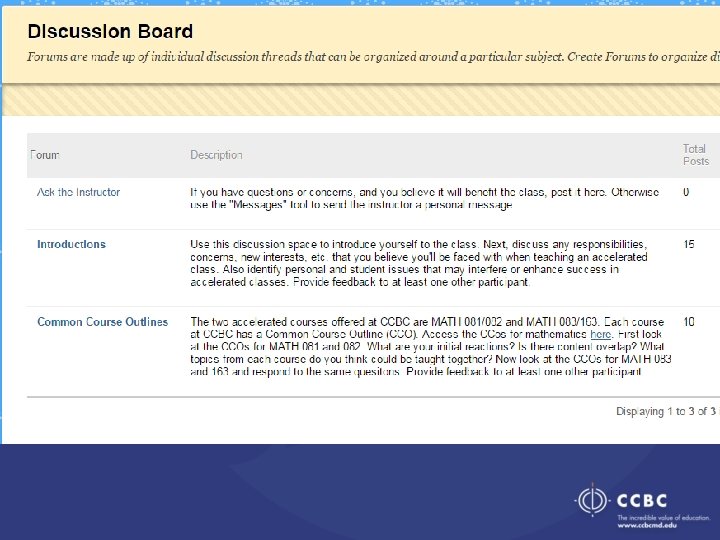
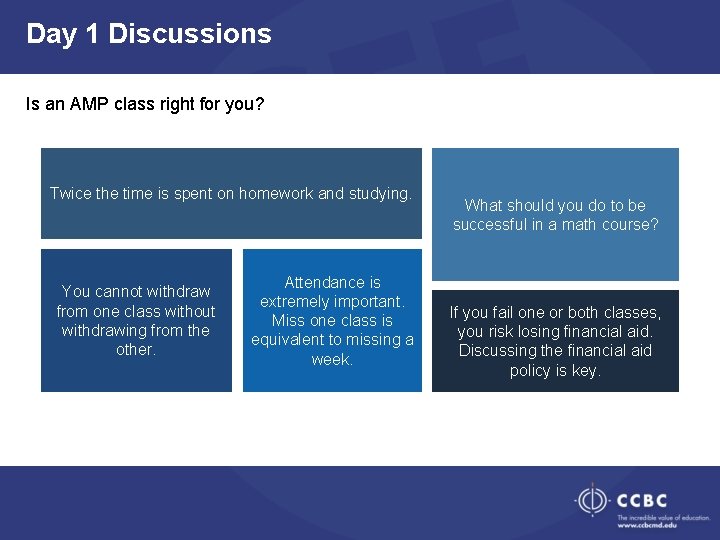
Day 1 Discussions Is an AMP class right for you? Twice the time is spent on homework and studying. You cannot withdraw from one class without withdrawing from the other. Attendance is extremely important. Miss one class is equivalent to missing a week. What should you do to be successful in a math course? If you fail one or both classes, you risk losing financial aid. Discussing the financial aid policy is key.
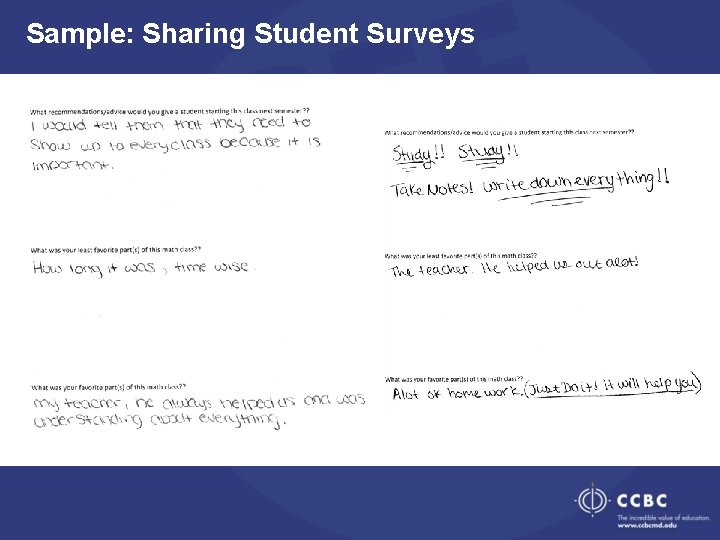
Sample: Sharing Student Surveys

Future of AMP
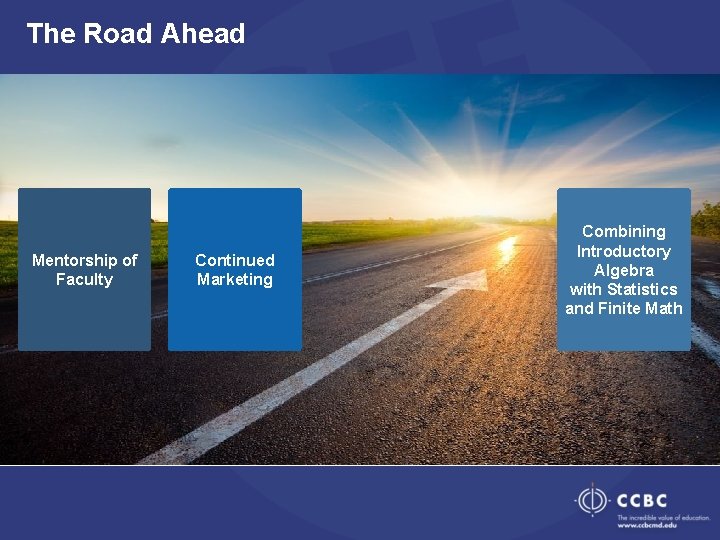
The Road Ahead Mentorship of Faculty Continued Marketing Combining Introductory Algebra with Statistics and Finite Math

www. ampatccbc. org AMP@ccbcmd. edu
- Slides: 73