Acceleration Changing Speed Faster and Slower Speed is


- Slides: 18
Acceleration Changing Speed: Faster and Slower
Speed is not always constant! • Acceleration is the rate at which your velocity (speed with direction) changes. • In other words: how fast you speed up and how slow you slow down.
With your partner, answer these questions in your notes: 1. Who has the greater acceleration? 2. How do you know? Student Teacher
14. 2 Acceleration • • A car can change its velocity by speeding up, slowing down, or changing direction. If an object’s acceleration is zero, the object could be moving at a constant speed in a straight line or could be stopped.
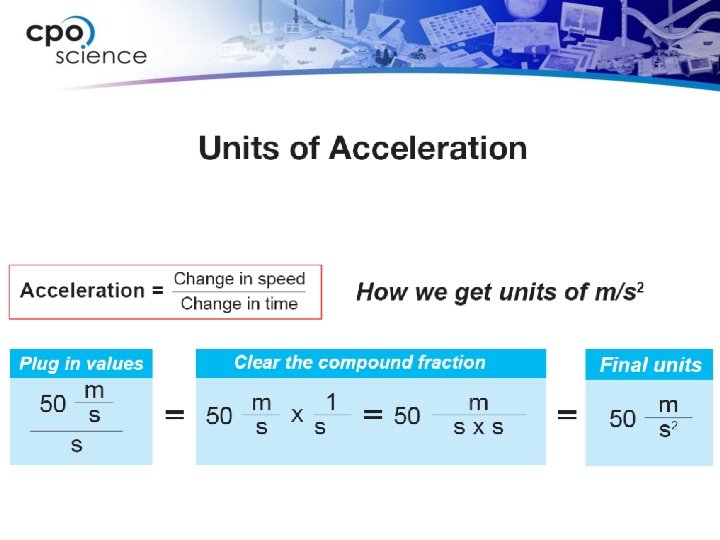
• To calculate acceleration, you divide the change in speed by the amount of time it takes for the change to happen.
14. 2 Acceleration • • If an object speeds up, it has a positive acceleration. If it slows down, it has a negative acceleration. What is the acceleration of the sailboat?
Graphing Acceleration on a Position vs. Time Graph • What do you predict increasing speed to look like?
Graphing Acceleration on a Position vs. Time Graph
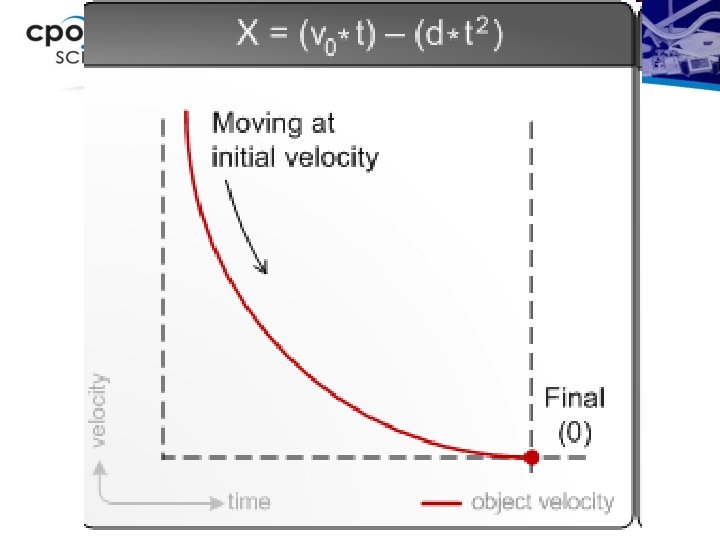
Graphing Acceleration on a Position vs. Time Graph • What do you predict decreasing speed to look like?
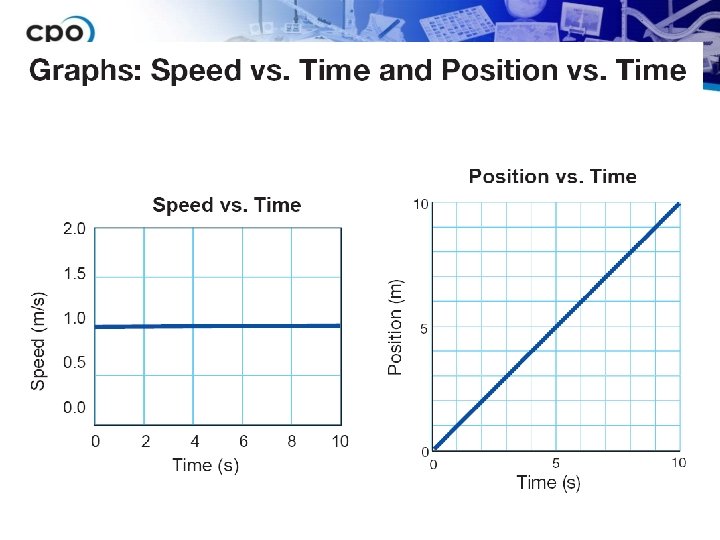
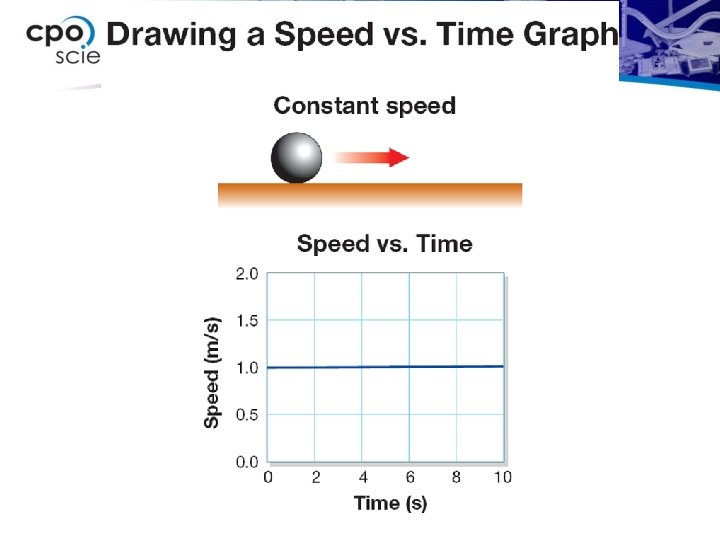
Drawing a Speed vs. Time Graph • What does constant speed look like on a Position vs. Time graph? • If we put Speed along the y-axis and Time along the x-axis to show change in speed over time, what will constant speed look like?
12. 3 Graphs of changing motion • Objects rarely move at the same speed for a long period of time. • A speed vs. time graph is also useful for showing the motion of an object that is speeding up • or slowing down.
Describe the motion in each Speed vs. Time Graph out loud to your partner.
Ticket to Leave • Draw a simple motion on the blank Position vs. Time graph. • Draw that same motion on the blank Speed vs. Time graph.