
Accelerating Progress towards Measles and Rubella Elimination Measles
Accelerating Progress towards Measles and Rubella Elimination Measles and Rubella elimination progress in the Americas Desiree Pastor MD, MPH Regional Advisor PAHO/WHO 21 June 2016 Geneva, Switzerland 1
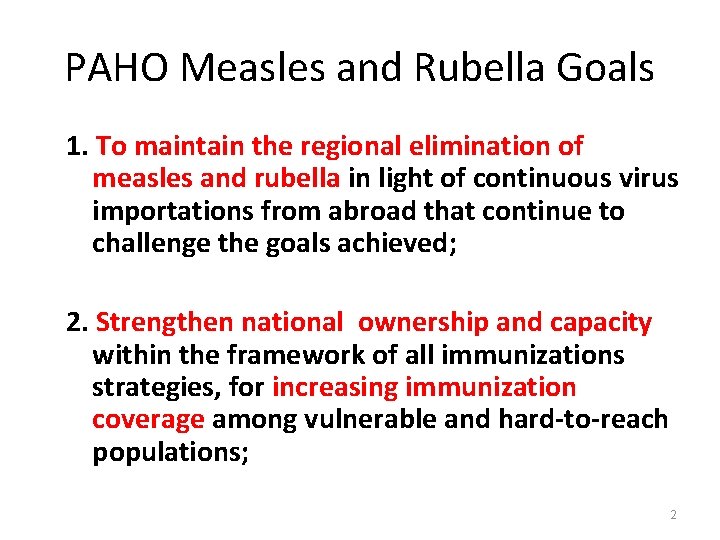
PAHO Measles and Rubella Goals 1. To maintain the regional elimination of measles and rubella in light of continuous virus importations from abroad that continue to challenge the goals achieved; 2. Strengthen national ownership and capacity within the framework of all immunizations strategies, for increasing immunization coverage among vulnerable and hard-to-reach populations; 2
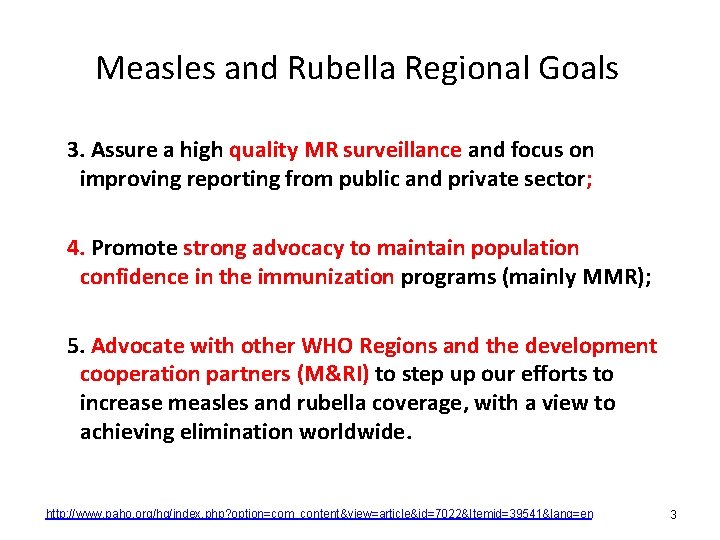
Measles and Rubella Regional Goals 3. Assure a high quality MR surveillance and focus on improving reporting from public and private sector; 4. Promote strong advocacy to maintain population confidence in the immunization programs (mainly MMR); 5. Advocate with other WHO Regions and the development cooperation partners (M&RI) to step up our efforts to increase measles and rubella coverage, with a view to achieving elimination worldwide. http: //www. paho. org/hq/index. php? option=com_content&view=article&id=7022&Itemid=39541&lang=en 3
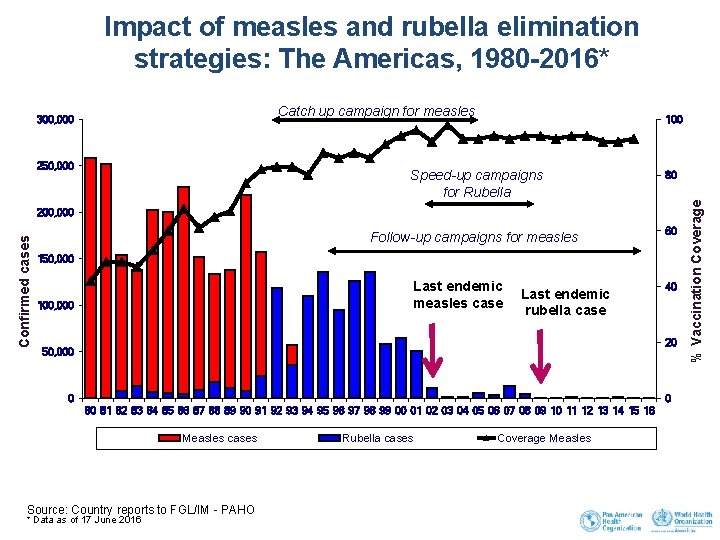
Impact measles and. Rubella rubella Elimination elimination Impact of of Measles and strategies: Thein Americas, 1980 -2016* Strategies the Americas Catch up campaign for measles 250, 000 100 Speed-up campaigns for Rubella 80 Follow-up campaigns for measles 60 Confirmed cases 200, 000 150, 000 Last endemic measles case 100, 000 Last endemic rubella case 40 20 50, 000 0 0 80 81 82 83 84 85 86 87 88 89 90 91 92 93 94 95 96 97 98 99 00 01 02 03 04 05 06 07 08 09 10 11 12 13 14 15 16 Measles cases Rubella cases Coverage Measles The Comprehensive Family Immunization Unit (FGL/IM) – Pan American Health Organization, data as of June 8, 2015 Source: Country reports to FGL/IM - PAHO * Data as of 17 June 2016 % Vaccination Coverage 300, 000
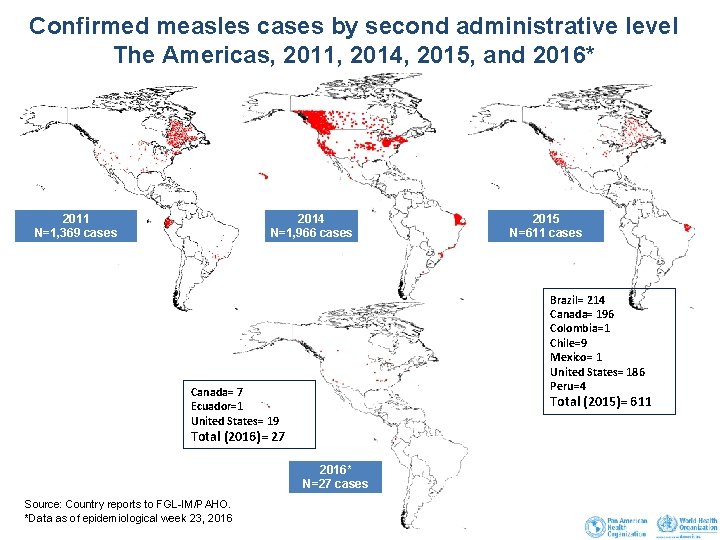
Confirmed measles cases by second administrative level The Americas, 2011, 2014, 2015, and 2016* 2011 N=1, 369 cases 2014 N=1, 966 cases Brazil= 214 Canada= 196 Colombia=1 Chile=9 Mexico= 1 United States= 186 Peru=4 Canada= 7 Ecuador=1 United States= 19 Total (2015)= 611 Total (2016)= 27 2016* N=27 cases Source: Country reports to FGL-IM/PAHO. *Data as of epidemiological week 23, 2016 2015 N=611 cases
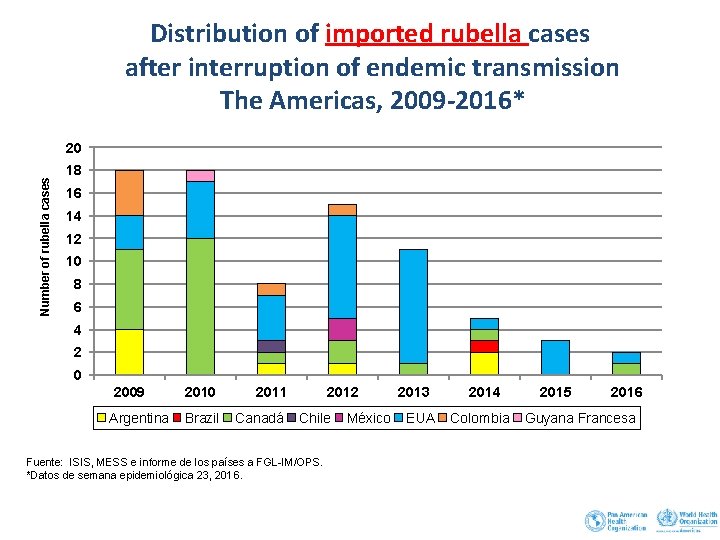
Distribution of imported rubella cases after interruption of endemic transmission The Americas, 2009 -2016* Number of rubella cases 20 18 16 14 12 10 8 6 4 2 0 2009 Argentina 2010 2011 Brazil Canadá 2012 Chile Fuente: ISIS, MESS e informe de los países a FGL-IM/OPS. *Datos de semana epidemiológica 23, 2016. México 2013 EUA 2014 Colombia 2015 2016 Guyana Francesa
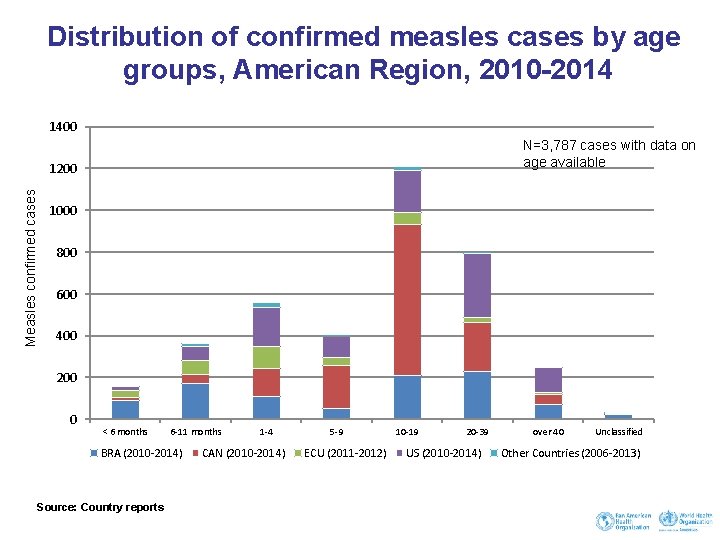
Distribution of confirmed measles cases by age groups, American Region, 2010 -2014 1400 N=3, 787 cases with data on age available Measles confirmed cases 1200 1000 800 600 400 200 0 < 6 months 6 -11 months BRA (2010 -2014) Source: Country reports 1 -4 CAN (2010 -2014) 5 -9 ECU (2011 -2012) 10 -19 20 -39 US (2010 -2014) over 40 Unclassified Other Countries (2006 -2013)
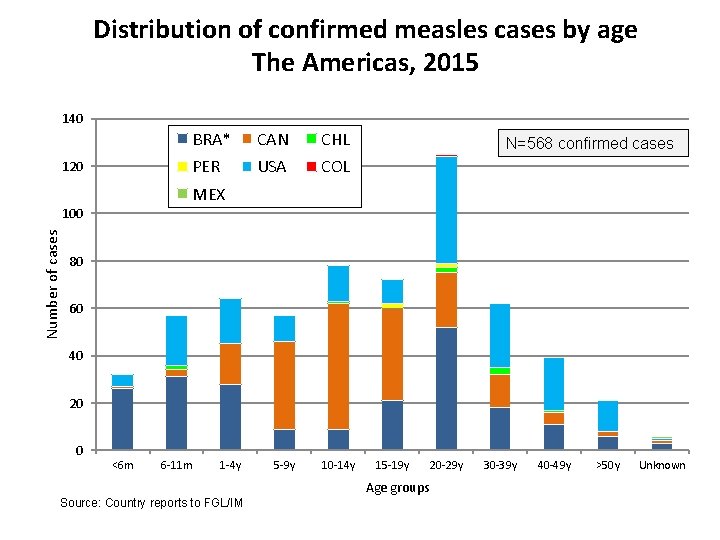
Distribution of confirmed measles cases by age The Americas, 2015 140 120 BRA* CAN CHL PER USA COL N=568 confirmed cases MEX Number of cases 100 80 60 40 20 0 <6 m 6 -11 m 1 -4 y 5 -9 y 10 -14 y 15 -19 y Age groups Source: Country reports to FGL/IM 20 -29 y 30 -39 y 40 -49 y >50 y Unknown
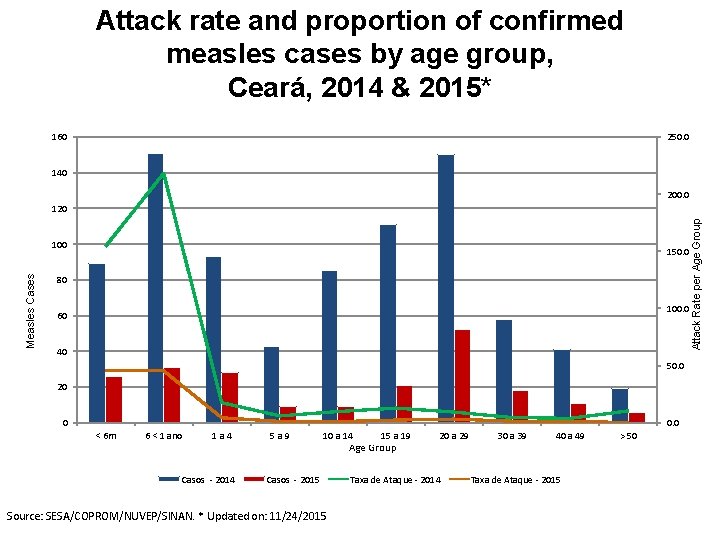
Attack rate and proportion of confirmed measles cases by age group, Ceará, 2014 & 2015* 160 250. 0 140 200. 0 Measles Cases 100 150. 0 80 100. 0 60 40 50. 0 20 0 0. 0 < 6 m 6 < 1 ano 1 a 4 Casos - 2014 5 a 9 10 a 14 Casos - 2015 Source: SESA/COPROM/NUVEP/SINAN. * Updated on: 11/24/2015 15 a 19 Age Group 20 a 29 Taxa de Ataque - 2014 30 a 39 40 a 49 Taxa de Ataque - 2015 > 50 Attack Rate per Age Group 120
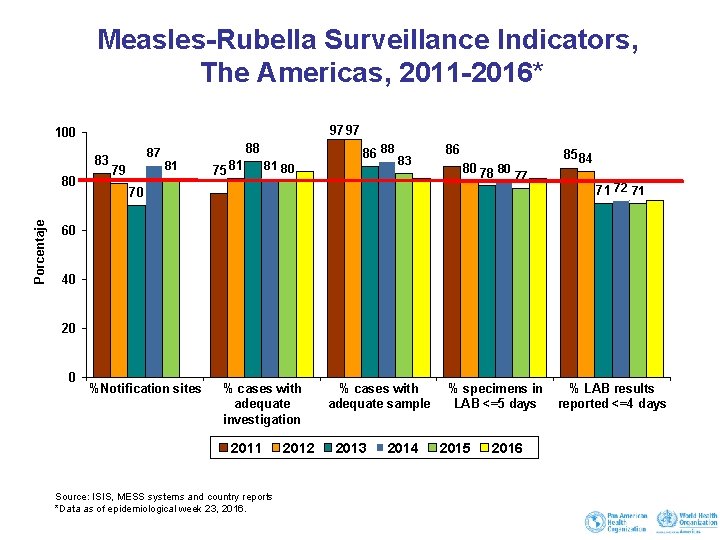
Measles-Rubella Surveillance Indicators, The Americas, 2011 -2016* 97 97 100 83 Porcentaje 80 88 87 81 79 75 81 81 80 84 86 88 83 81 86 80 78 80 77 81 70 85 84 71 72 60 40 20 0 %Notification sites % cases with adequate investigation 2011 Source: ISIS, MESS systems and country reports *Data as of epidemiological week 23, 2016. 2012 % cases with adequate sample 2013 2014 % specimens in LAB <=5 days 2015 2016 % LAB results reported <=4 days
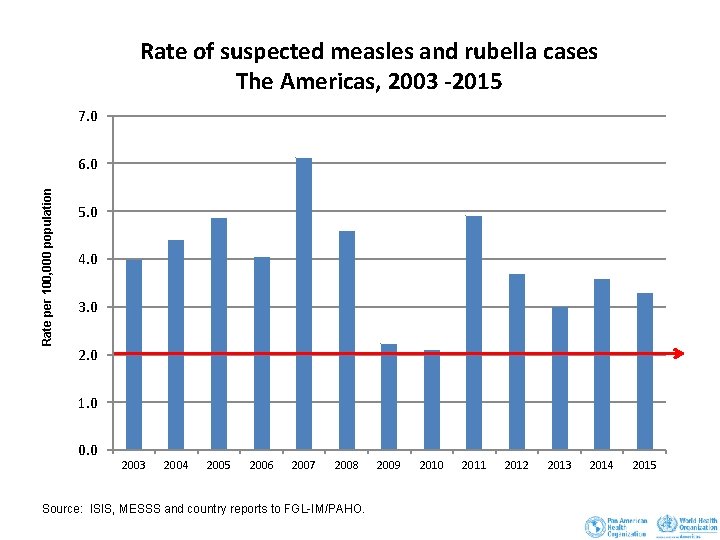
Rate of suspected measles and rubella cases The Americas, 2003 -2015 7. 0 Rate per 100, 000 population 6. 0 5. 0 4. 0 3. 0 2. 0 1. 0 0. 0 2003 2004 2005 2006 2007 2008 Source: ISIS, MESSS and country reports to FGL-IM/PAHO. 2009 2010 2011 2012 2013 2014 2015
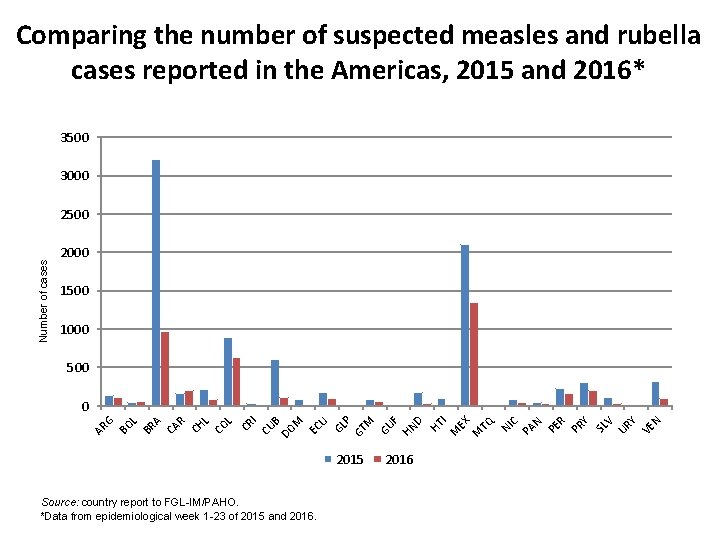
Comparing the number of suspected measles and rubella cases reported in the Americas, 2015 and 2016* 3500 3000 Number of cases 2500 2000 1500 1000 500 2015 Source: country report to FGL-IM/PAHO. *Data from epidemiological week 1 -23 of 2015 and 2016 SL V UR Y VE N Y PR R PE TQ NI C PA N M EX I M HT D F HN GU A CA R CH L CO L CR I CU B DO M EC U GL P GT M L BR BO AR G 0
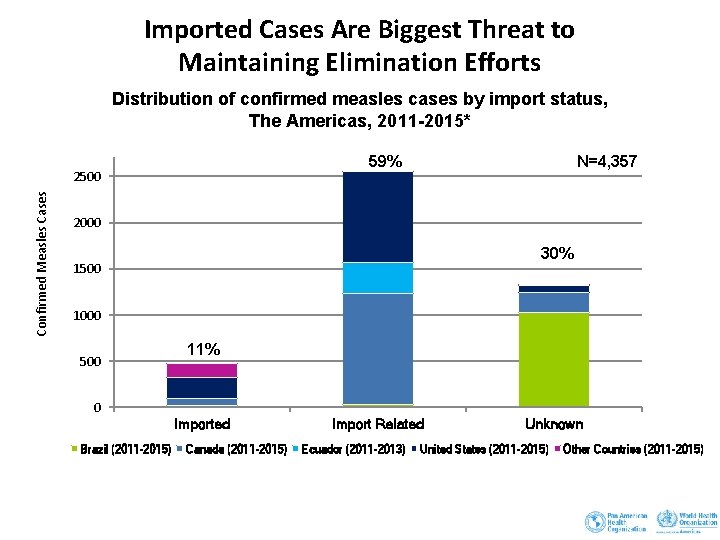
Imported Cases Are Biggest Threat to Maintaining Elimination Efforts Distribution of confirmed measles cases by import status, The Americas, 2011 -2015* 2500 Confirmed Measles Cases N=4, 357 59% 2000 30% 1500 1000 500 11% 0 Imported Brazil (2011 -2015) Canada (2011 -2015) Import Related Ecuador (2011 -2013) Unknown United States (2011 -2015) Other Countries (2011 -2015) PAHO Measles Eradication Surveillance System and Integrated Surveillance Information System and country reports *Data as of 21 May 2015
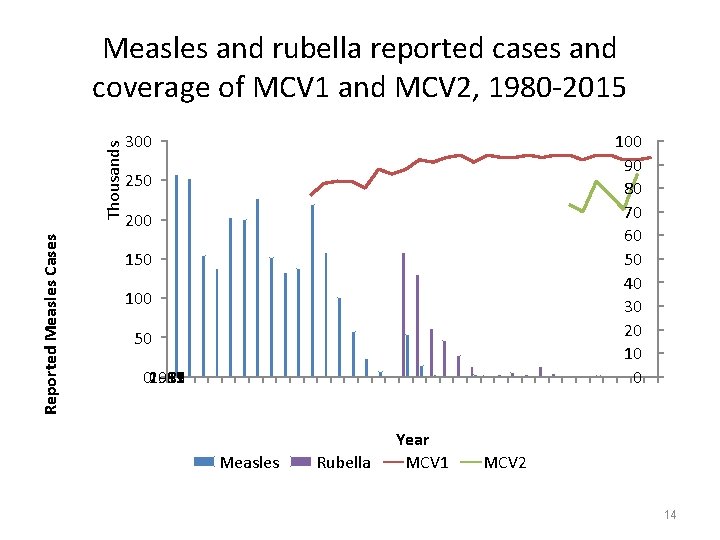
Reported Measles Cases Thousands Measles and rubella reported cases and coverage of MCV 1 and MCV 2, 1980 -2015 300 100 90 80 70 60 50 40 30 20 10 0 250 200 150 100 50 1981 1983 1985 1987 1989 1991 1993 1995 1997 1999 2001 2003 2005 2007 2009 2011 2013 02015 Measles Rubella Year MCV 1 MCV 2 14
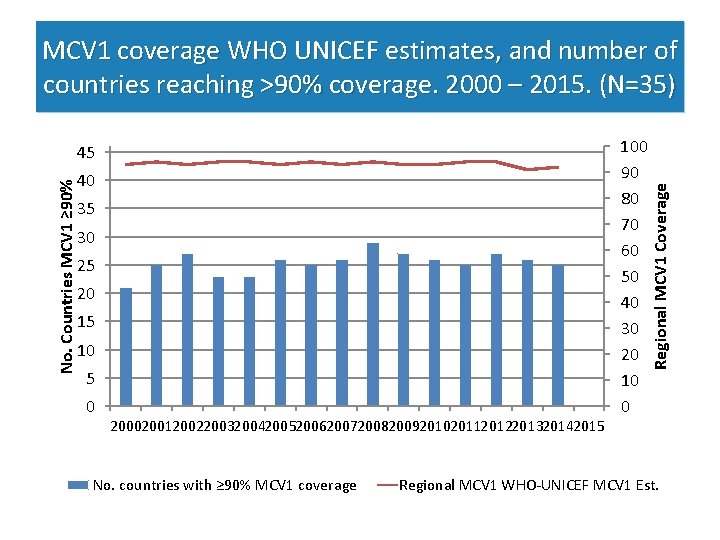
No. Countries MCV 1 ≥ 90% 45 40 35 30 25 20 15 10 5 0 2000200120022003200420052006200720082009201020112012201320142015 No. countries with ≥ 90% MCV 1 coverage 100 90 80 70 60 50 40 30 20 10 0 Regional MCV 1 Coverage MCV 1 coverage WHO UNICEF estimates, and number of countries reaching >90% coverage. 2000 – 2015. (N=35) Regional MCV 1 WHO-UNICEF MCV 1 Est.
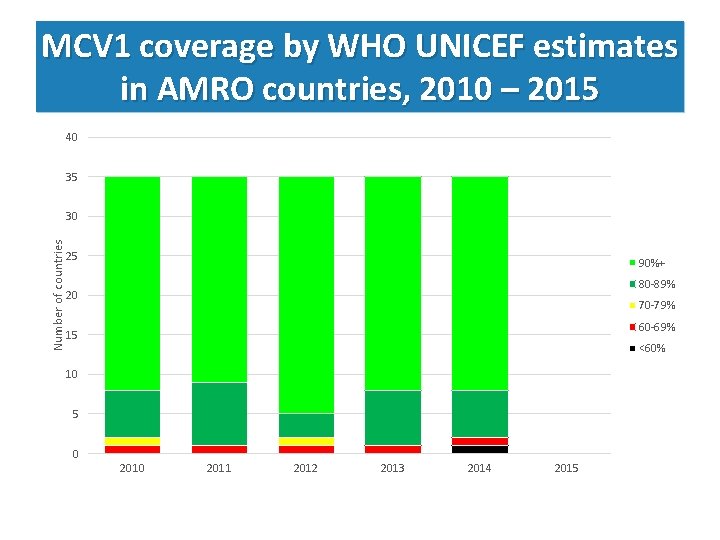
MCV 1 coverage by WHO UNICEF estimates in AMRO countries, 2010 – 2015 40 35 Number of countries 30 25 90%+ 80 -89% 20 70 -79% 60 -69% 15 <60% 10 5 0 2011 2012 2013 2014 2015
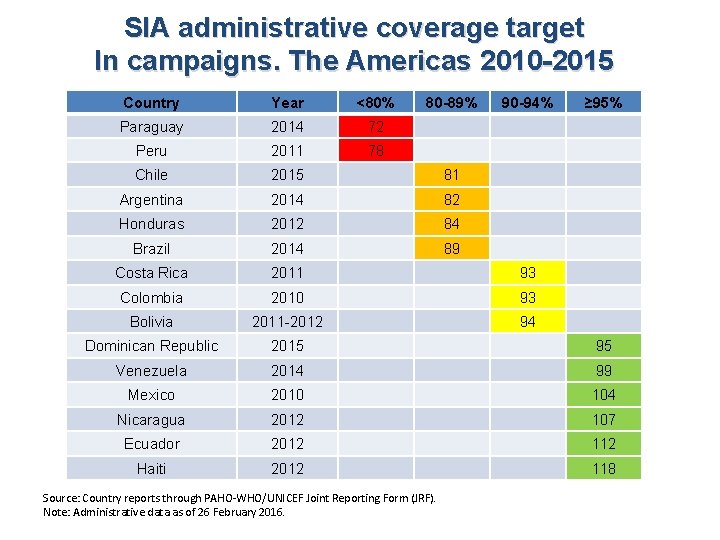
SIA administrative coverage target In campaigns. The Americas 2010 -2015 Country Year <80% 80 -89% Paraguay 2014 72 Peru 2011 78 Chile 2015 81 Argentina 2014 82 Honduras 2012 84 Brazil 2014 89 Costa Rica 2011 93 Colombia 2010 93 Bolivia 2011 -2012 94 Dominican Republic 2015 95 Venezuela 2014 99 Mexico 2010 104 Nicaragua 2012 107 Ecuador 2012 112 Haiti 2012 118 Source: Country reports through PAHO-WHO/UNICEF Joint Reporting Form (JRF). Note: Administrative data as of 26 February 2016. 90 -94% ≥ 95%
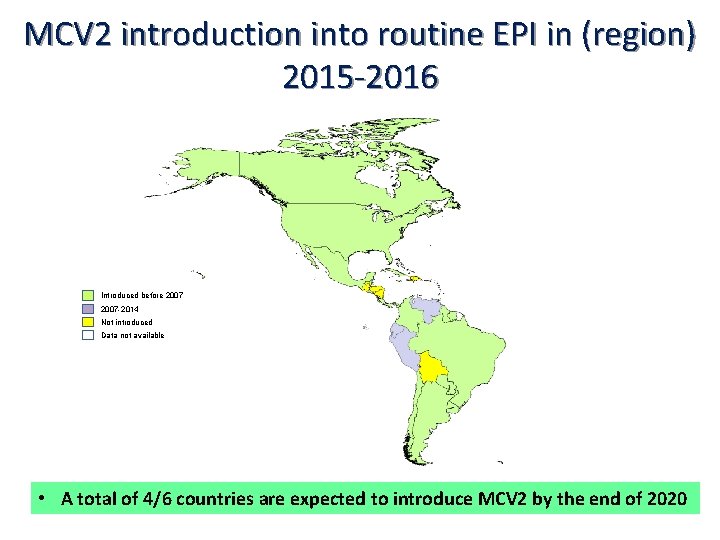
MCV 2 introduction into routine EPI in (region) 2015 -2016 Introduced before 2007 -2014 Not introduced Data not available • A total of 4/6 countries are expected to introduce MCV 2 by the end of 2020
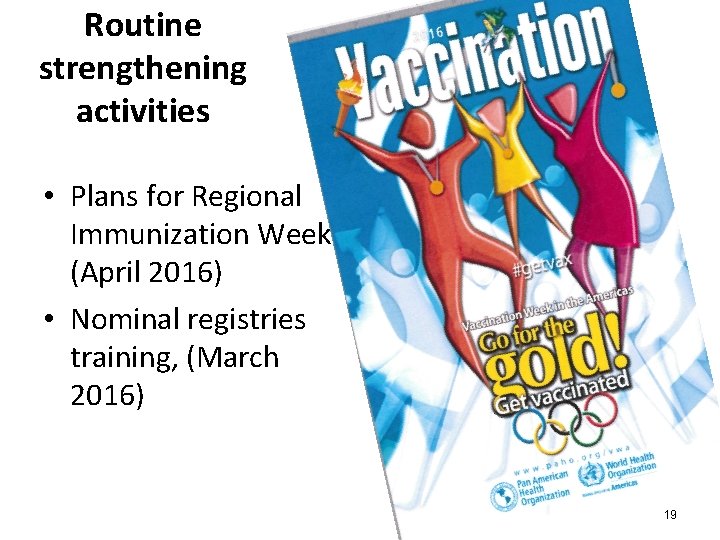
Routine strengthening activities • Plans for Regional Immunization Week (April 2016) • Nominal registries training, (March 2016) 19
Regional and National Verification • We are reviewing the updated country elimination reports, to assess sustainability of measles and rubella elimination: (n=15/24) Status of RVC • Two IEC meetings in April and December 2015 • One IEC meeting in Brazil on July 20 -21, led by IEC Chair, Dr Merceline Dahl-Regis 20
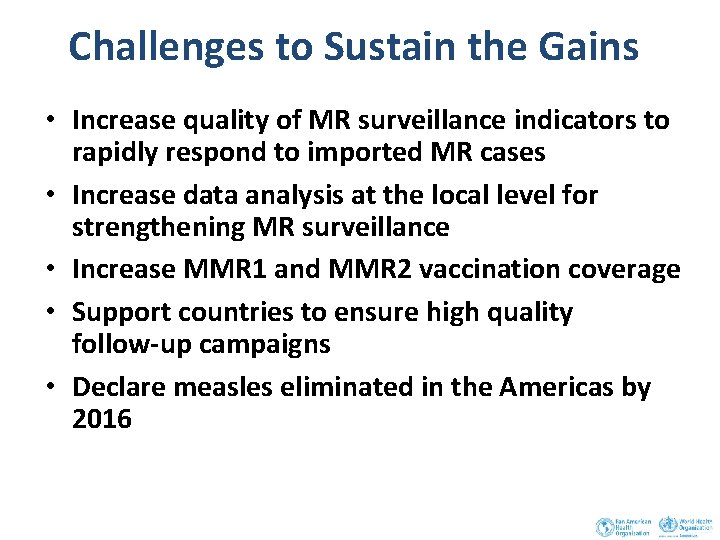
Challenges to Sustain the Gains • Increase quality of MR surveillance indicators to rapidly respond to imported MR cases • Increase data analysis at the local level for strengthening MR surveillance • Increase MMR 1 and MMR 2 vaccination coverage • Support countries to ensure high quality follow-up campaigns • Declare measles eliminated in the Americas by 2016
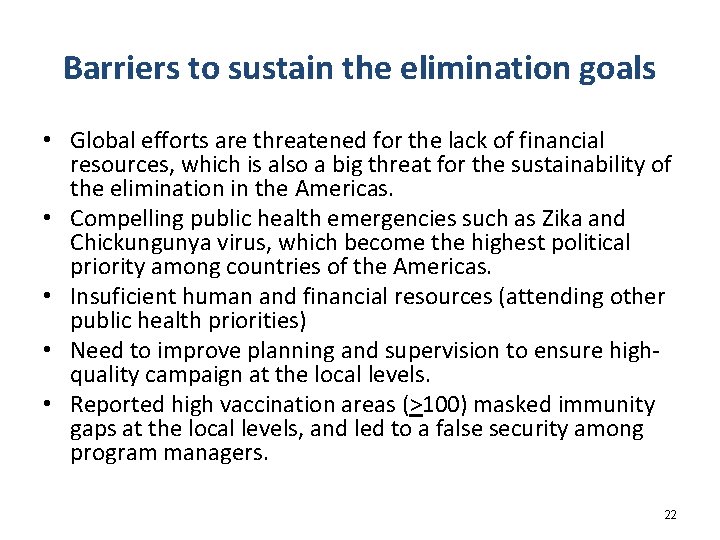
Barriers to sustain the elimination goals • Global efforts are threatened for the lack of financial resources, which is also a big threat for the sustainability of the elimination in the Americas. • Compelling public health emergencies such as Zika and Chickungunya virus, which become the highest political priority among countries of the Americas. • Insuficient human and financial resources (attending other public health priorities) • Need to improve planning and supervision to ensure highquality campaign at the local levels. • Reported high vaccination areas (>100) masked immunity gaps at the local levels, and led to a false security among program managers. 22
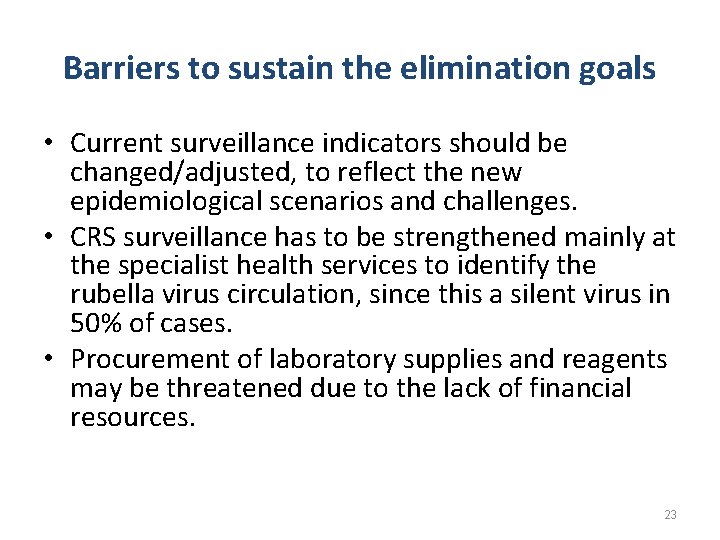
Barriers to sustain the elimination goals • Current surveillance indicators should be changed/adjusted, to reflect the new epidemiological scenarios and challenges. • CRS surveillance has to be strengthened mainly at the specialist health services to identify the rubella virus circulation, since this a silent virus in 50% of cases. • Procurement of laboratory supplies and reagents may be threatened due to the lack of financial resources. 23
Programme Plans 2017 -2018 24
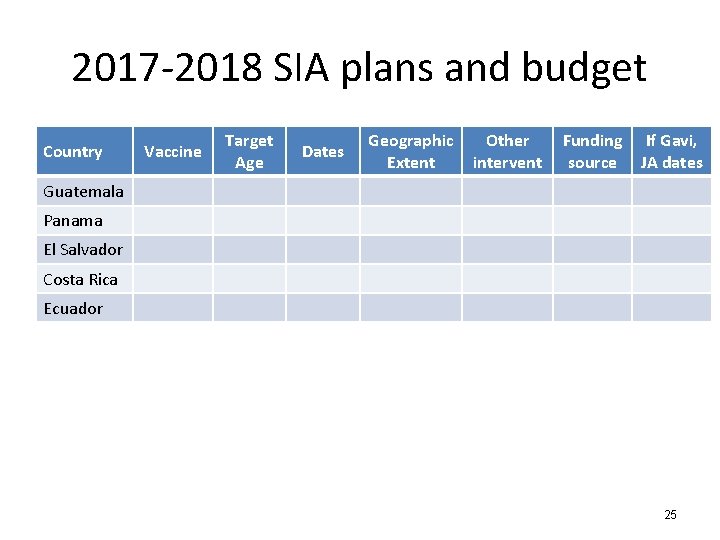
2017 -2018 SIA plans and budget Country Vaccine Target Age Dates Geographic Extent Other intervent Funding source If Gavi, JA dates Guatemala Panama El Salvador Costa Rica Ecuador 25
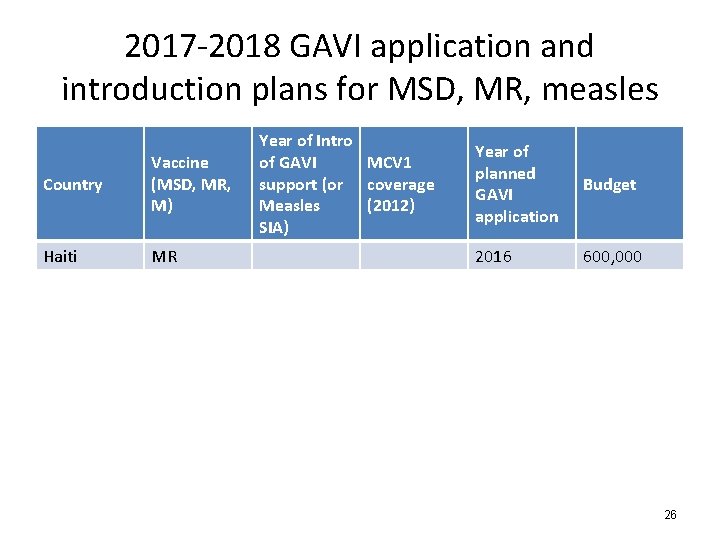
2017 -2018 GAVI application and introduction plans for MSD, MR, measles Country Vaccine (MSD, MR, M) Haiti MR Year of Intro of GAVI MCV 1 support (or coverage Measles (2012) SIA) Year of planned GAVI application Budget 2016 600, 000 26
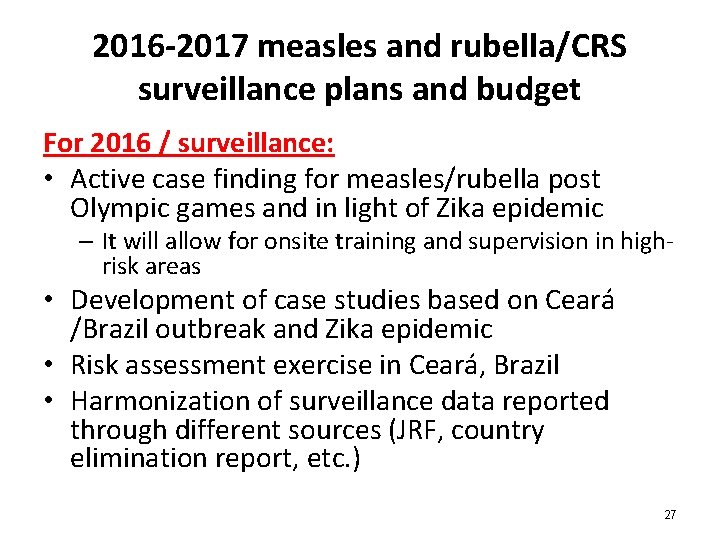
2016 -2017 measles and rubella/CRS surveillance plans and budget For 2016 / surveillance: • Active case finding for measles/rubella post Olympic games and in light of Zika epidemic – It will allow for onsite training and supervision in highrisk areas • Development of case studies based on Ceará /Brazil outbreak and Zika epidemic • Risk assessment exercise in Ceará, Brazil • Harmonization of surveillance data reported through different sources (JRF, country elimination report, etc. ) 27
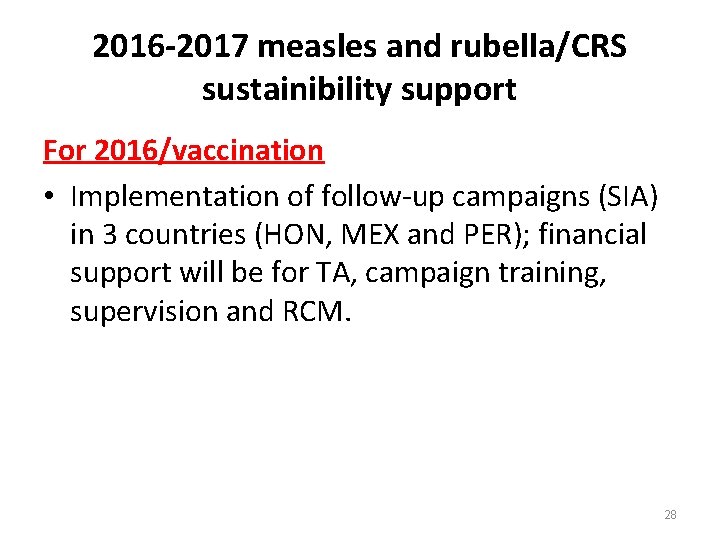
2016 -2017 measles and rubella/CRS sustainibility support For 2016/vaccination • Implementation of follow-up campaigns (SIA) in 3 countries (HON, MEX and PER); financial support will be for TA, campaign training, supervision and RCM. 28
2016 -2017 Advocacy Plans For 2016: • Development of marketing materials to increase awareness for measles/rubella, due to the 2016’s Olympics games. • Maintain our advocacy efforts to push for a MR global eradication goal in the 2017’s WHA. 29
Technical Assistance needs 2017 • Include anticipated TA needs for SIA planning, monitoring and evaluation, for surveillance , for GAVI applications and for strengthening routine activities. 30
Resource gaps 2017 -2018 • For 2016, we are facing a potential gap of 750, 000 as we have only received 200 k (first trench). We hope to receive the remaining funds, to move forward with our planned activities. • For 2017 -2018, gaps will be determined based on country needs and availability of external funds (UNF and other donors). 31
Thanks! Gracias! Merci! ¡ धनयव द ! Terima kasih! Jërëjëf! Murakoze! Asante! ﺷﻜﺮﺍ یہ … ﺑہﺖ ﺷکﺮ 32
- Slides: 32