
Academic Excellence Indicator System 2007 08 Annual Report
- Slides: 39
Academic Excellence Indicator System 2007 -08 Annual Report and Public Hearing Midland ISD January 13, 2009 1
Academic Excellence Indicator System (AEIS) • • • Comprehensive reporting system defined by statute Published annually since 1990 -91 Gives parents and community a snapshot of • • District/Campus Performance (Section I of AEIS Report) District/Campus Profile (Section II of AEIS Report) Contains all data used to determine District/Campus accountability ratings Uses data collected through: • • State data reporting system (PEIMS) Student assessment system 2
AEIS Reports (Overview – Three Sections) Cover Page District Performance District Profile 3
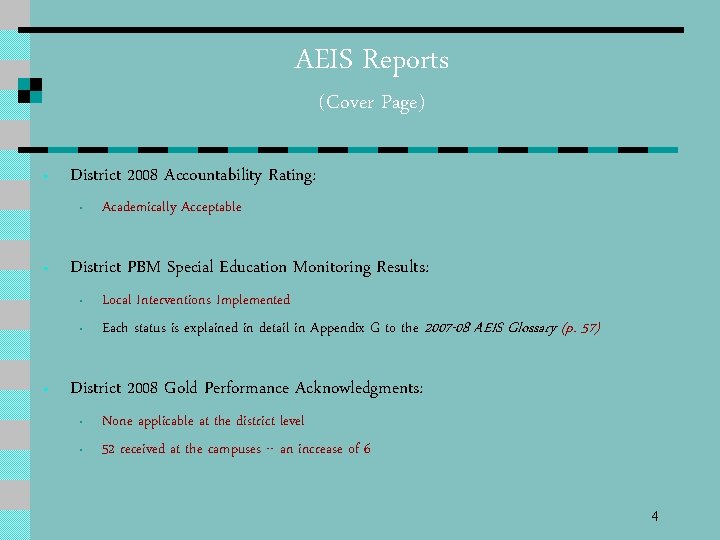
AEIS Reports (Cover Page) • District 2008 Accountability Rating: • • District PBM Special Education Monitoring Results: • • • Academically Acceptable Local Interventions Implemented Each status is explained in detail in Appendix G to the 2007 -08 AEIS Glossary (p. 57) District 2008 Gold Performance Acknowledgments: • • None applicable at the district level 52 received at the campuses -- an increase of 6 4
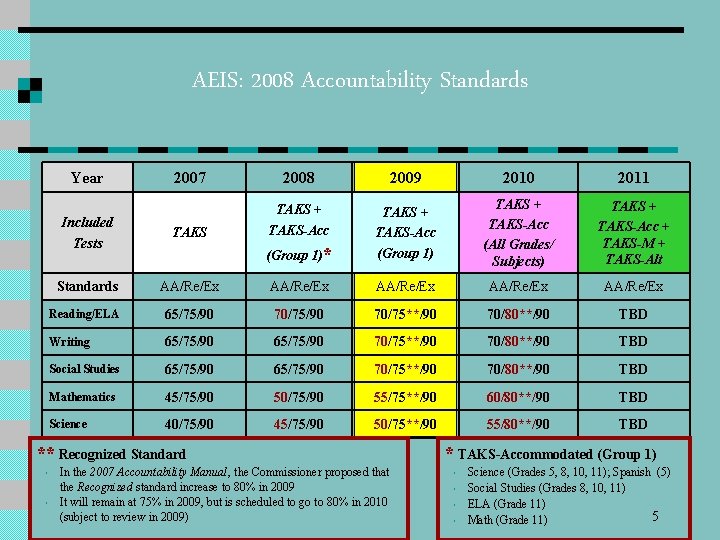
AEIS: 2008 Accountability Standards Year 2007 2008 2009 2010 2011 Included Tests TAKS + TAKS-Acc (Group 1)* TAKS + TAKS-Acc (Group 1) TAKS + TAKS-Acc (All Grades/ Subjects) TAKS + TAKS-Acc + TAKS-M + TAKS-Alt Standards AA/Re/Ex AA/Re/Ex Reading/ELA 65/75/90 70/75**/90 70/80**/90 TBD Writing 65/75/90 70/75**/90 70/80**/90 TBD Social Studies 65/75/90 70/75**/90 70/80**/90 TBD Mathematics 45/75/90 50/75/90 55/75**/90 60/80**/90 TBD Science 40/75/90 45/75/90 50/75**/90 55/80**/90 TBD ** Recognized Standard • • In the 2007 Accountability Manual, the Commissioner proposed that the Recognized standard increase to 80% in 2009 It will remain at 75% in 2009, but is scheduled to go to 80% in 2010 (subject to review in 2009) * TAKS-Accommodated (Group 1) • • Science (Grades 5, 8, 10, 11); Spanish (5) Social Studies (Grades 8, 10, 11) ELA (Grade 11) 5 Math (Grade 11)
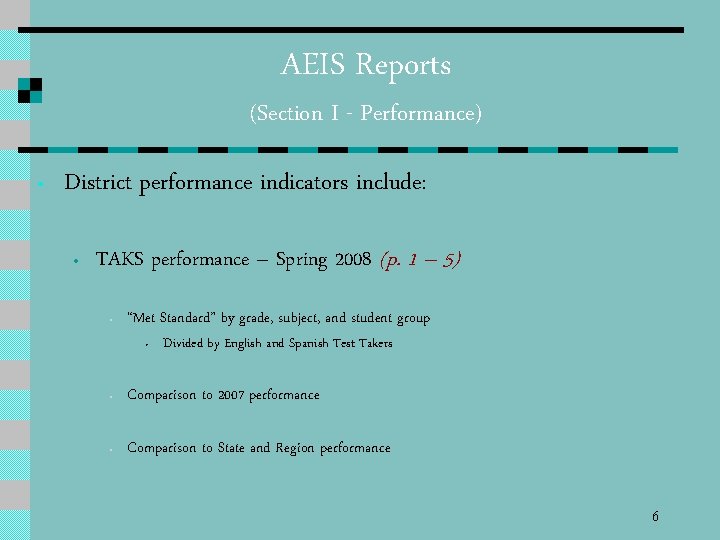
AEIS Reports (Section I - Performance) • District performance indicators include: • TAKS performance – Spring 2008 (p. 1 – 5) • “Met Standard” by grade, subject, and student group • Divided by English and Spanish Test Takers • Comparison to 2007 performance • Comparison to State and Region performance 6
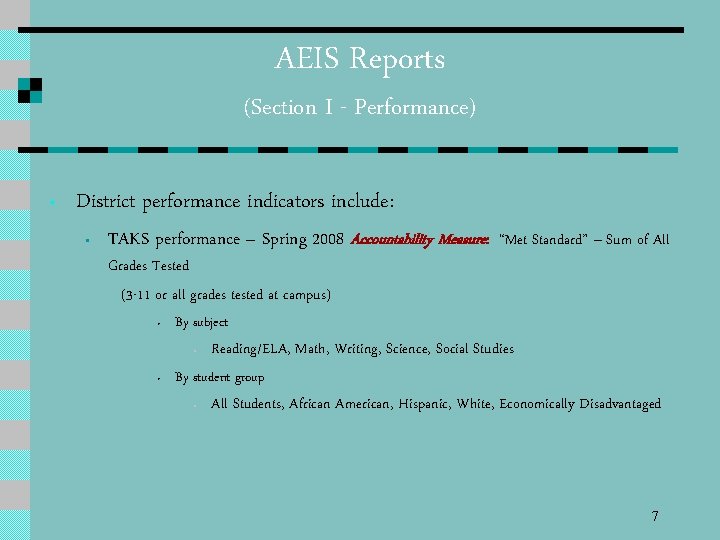
AEIS Reports (Section I - Performance) • District performance indicators include: • TAKS performance – Spring 2008 Accountability Measure: “Met Standard” – Sum of All Grades Tested (3 -11 or all grades tested at campus) • By subject • • Reading/ELA, Math, Writing, Science, Social Studies By student group • All Students, African American, Hispanic, White, Economically Disadvantaged 7
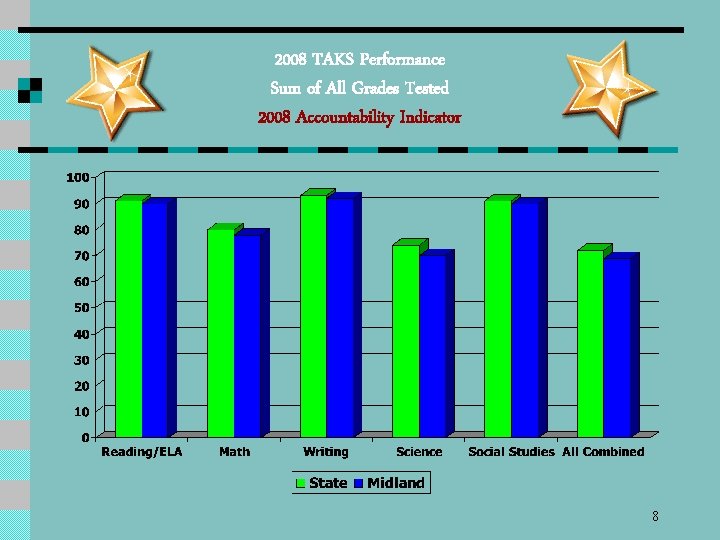
2008 TAKS Performance Sum of All Grades Tested 2008 Accountability Indicator 8
AEIS Reports (Section I - Performance) • District performance indicators include: • TAKS Met 2010 Standard – Preview (p. 5) • • 2010 preview at Panel Recommendation “Met Standard” by grade, subject, and student group • • Additional TAKS (Accommodated) subjects/grades • Reading and Math 3 -10 • Writing 4, 7 Comparison to State and Region performance 9
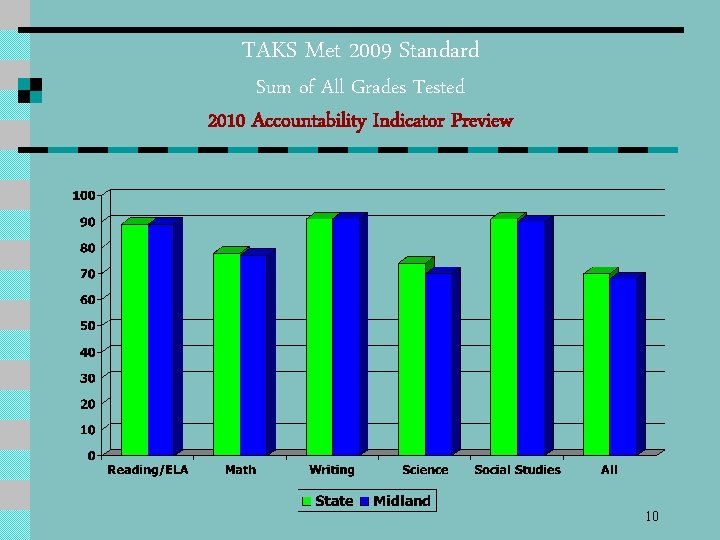
TAKS Met 2009 Standard Sum of All Grades Tested 2010 Accountability Indicator Preview 10
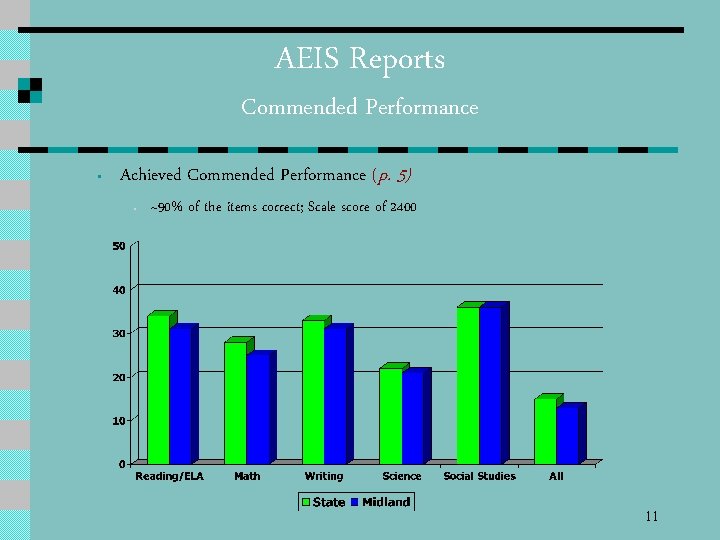
AEIS Reports Commended Performance • Achieved Commended Performance (p. 5) • ~90% of the items correct; Scale score of 2400 11
AEIS Reports (Section I - Performance) • District performance indicators include: • TAKS/TAKS-Acc/TAKS-M/TAKS-Alt Participation (p. 6) • • • Sum of all grades by student group TAKS Exit-Level Cumulative Pass Rate (p. 6) Progress of Prior Year TAKS Failers (p. 7) TGI (Texas Growth Index) (p. 7 and p. 33 Glossary) Student Success Initiative Results (p. 7 -9) English Language Learners Progress Measure (not shown this year) • Scheduled future accountability indicator 12
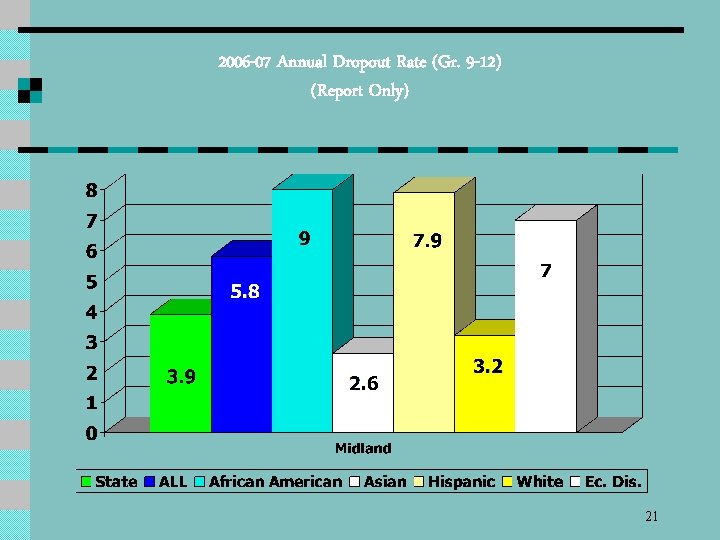
AEIS Reports (Section I - Performance) • District performance indicators include: • Attendance Rate (p. 9) • Annual Dropout Rate (2006 -07) (p. 9) • • Completion Rate II (p. 10) • • Grades 7 -8 [Standard Accountability Measure] Grades 7 -12 [Alternative Accountability Measure] Grades 9 -12 Class of 2007 (with GED) [Alternative Accountability Measure] Completion Rate I (p. 10) • Class of 2007 (without GED) [Standard Accountability Measure] 13
AEIS Reports (Section I - Performance) • District performance indicators include: • Attendance Rate (p. 9) • Annual Dropout Rate (2006 -07) (p. 9) • • Completion Rate II (p. 10) • • Grades 7 -8 [Standard Accountability Measure] Grades 7 -12 [Alternative Accountability Measure] Grades 9 -12 Class of 2007 (with GED) [Alternative Accountability Measure] Completion Rate I (p. 10) • Class of 2007 (without GED) [Standard Accountability Measure] 14
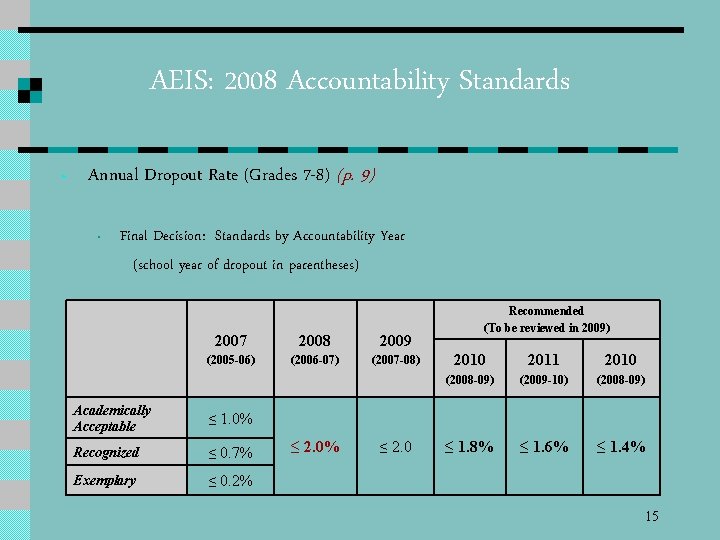
AEIS: 2008 Accountability Standards • Annual Dropout Rate (Grades 7 -8) (p. 9) • Final Decision: Standards by Accountability Year (school year of dropout in parentheses) 2007 2008 2009 (2005 -06) (2006 -07) (2007 -08) Academically Acceptable ≤ 1. 0% Recognized ≤ 0. 7% Exemplary ≤ 0. 2% ≤ 2. 0 Recommended (To be reviewed in 2009) 2010 2011 2010 (2008 -09) (2009 -10) (2008 -09) ≤ 1. 8% ≤ 1. 6% ≤ 1. 4% 15
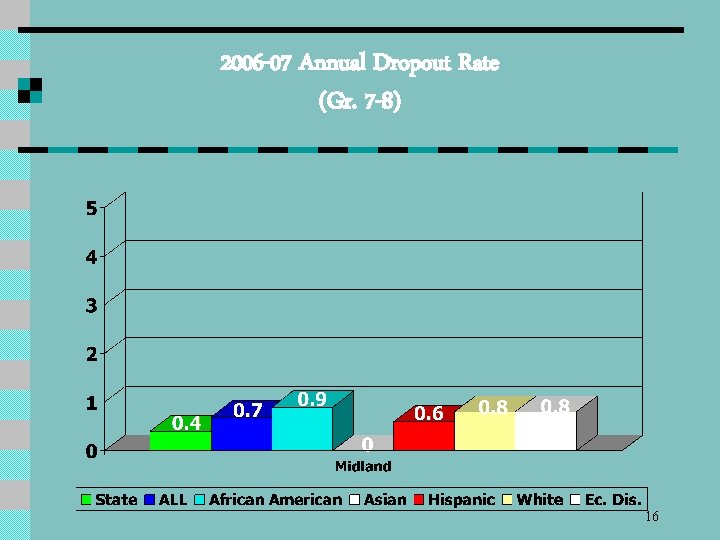
2006 -07 Annual Dropout Rate (Gr. 7 -8) 16
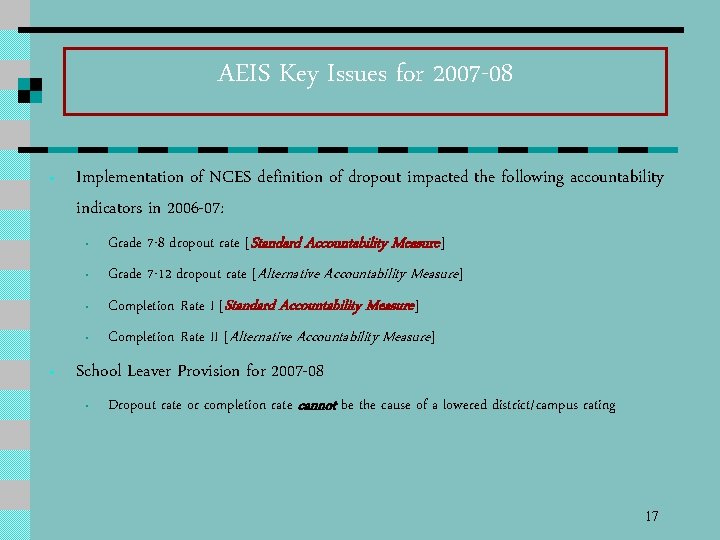
AEIS Key Issues for 2007 -08 • • Implementation of NCES definition of dropout impacted the following accountability indicators in 2006 -07: • Grade 7 -8 dropout rate [Standard Accountability Measure] • Grade 7 -12 dropout rate [Alternative Accountability Measure] • Completion Rate I [Standard Accountability Measure] • Completion Rate II [Alternative Accountability Measure] School Leaver Provision for 2007 -08 • Dropout rate or completion rate cannot be the cause of a lowered district/campus rating 17
AEIS Reports (Section I - Performance) • District performance indicators include: • Attendance Rate (p. 9) • Annual Dropout Rate (2006 -07) (p. 9) • • Completion Rate II (p. 10) • • Grades 7 -8 [Standard Accountability Measure] Grades 7 -12 [Alternative Accountability Measure] Grades 9 -12 Class of 2007 (with GED) [Alternative Accountability Measure] Completion Rate I (p. 10) • Class of 2007 (without GED) [Standard Accountability Measure] 18
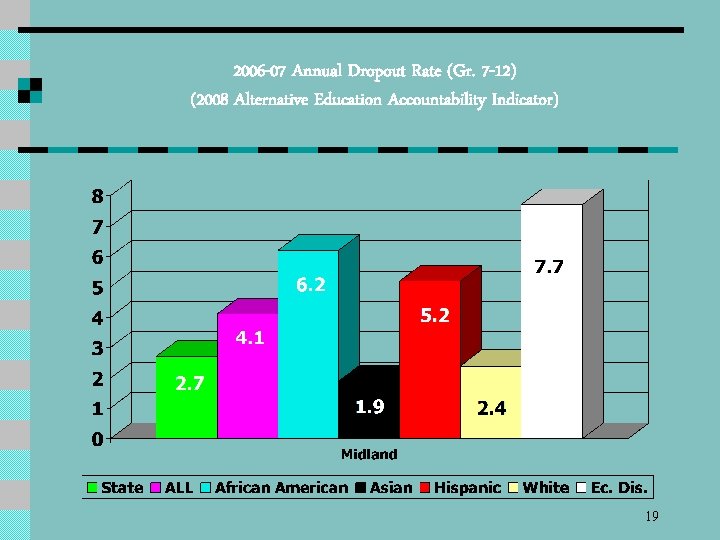
2006 -07 Annual Dropout Rate (Gr. 7 -12) (2008 Alternative Education Accountability Indicator) 19
AEIS Reports (Section I - Performance) • District performance indicators include: • Attendance Rate (p. 9) • Annual Dropout Rate (2006 -07) (p. 9) • • Completion Rate II (p. 10) • • Grades 7 -8 [Standard Accountability Measure] Grades 7 -12 [Alternative Accountability Measure] Grades 9 -12 Class of 2007 (with GED) [Alternative Accountability Measure] Completion Rate I (p. 10) • Class of 2007 (without GED) [Standard Accountability Measure] 20
2006 -07 Annual Dropout Rate (Gr. 9 -12) (Report Only) 21
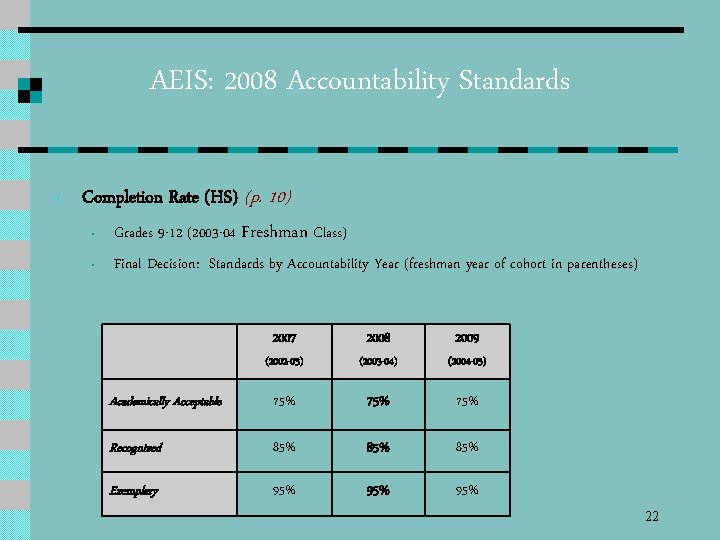
AEIS: 2008 Accountability Standards • Completion Rate (HS) (p. 10) • Grades 9 -12 (2003 -04 Freshman Class) • Final Decision: Standards by Accountability Year (freshman year of cohort in parentheses) 2007 2008 2009 (2002 -03) (2003 -04) (2004 -05) Academically Acceptable 75% 75% Recognized 85% 85% Exemplary 95% 95% 22
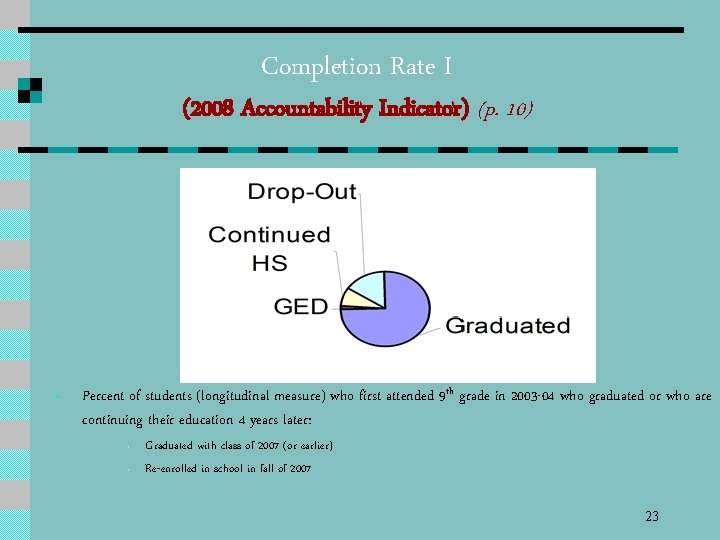
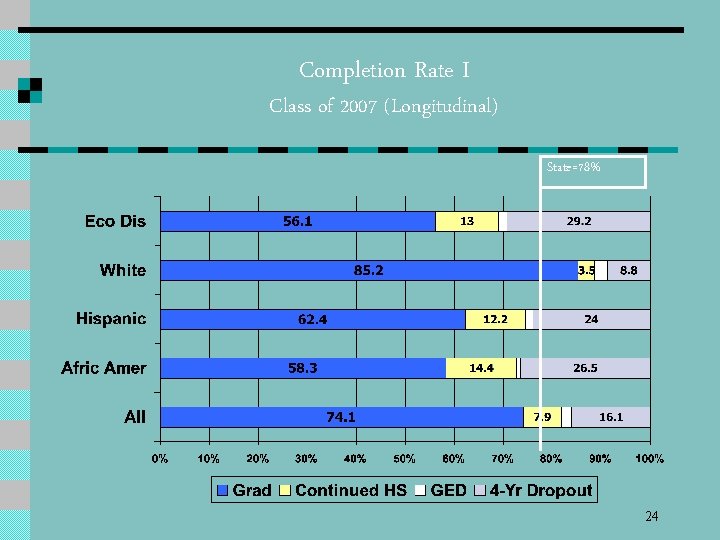
Completion Rate I (2008 Accountability Indicator) (p. 10) • Percent of students (longitudinal measure) who first attended 9 th grade in 2003 -04 who graduated or who are continuing their education 4 years later: • • Graduated with class of 2007 (or earlier) Re-enrolled in school in fall of 2007 23
Completion Rate I Class of 2007 (Longitudinal) State=78% 24
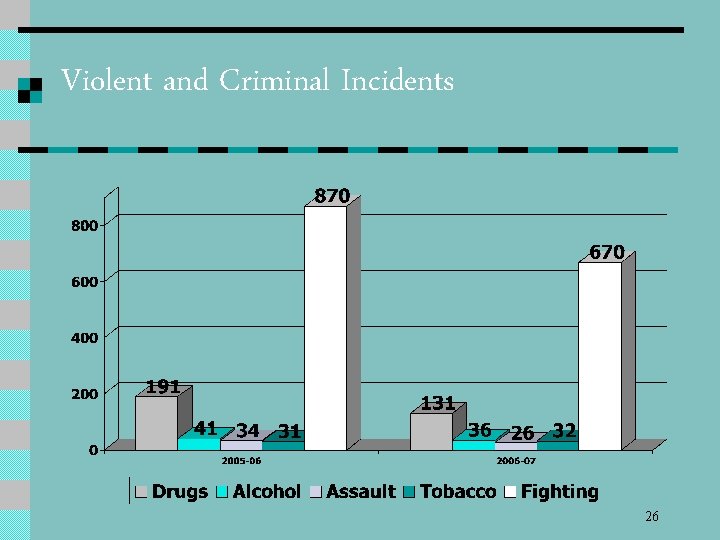
Violent and Criminal Incidents • Texas statute (TEC 39. 053) requires every district to publish an annual report on violent and criminal incidents at campuses in the district • • Number Rate Type No conduct reported punishable as a felony 25
Violent and Criminal Incidents 26
AEIS Reports College Readiness Indicators • District performance indicators include: • Advanced Courses/Dual Enrollment (p. 10) • Recommended High School Program (RHSP)/Distinguished Achievement Program (DAP) Graduates (p. 10) • AP/IB Results (p. 10) • Texas Success Initiative – Higher Education Readiness Component (HERC) (p. 10) • SAT/ACT Results (p. 11) • College-Ready Graduates (Class of 2007) (p. 11) • Scheduled future accountability indicator 27
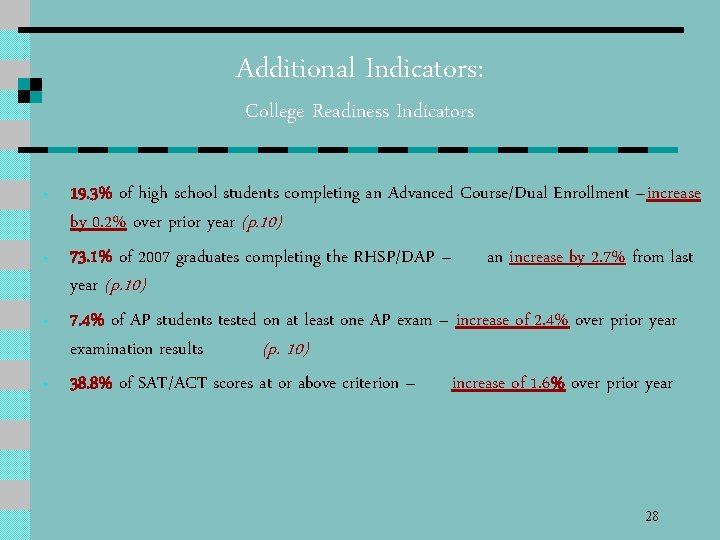
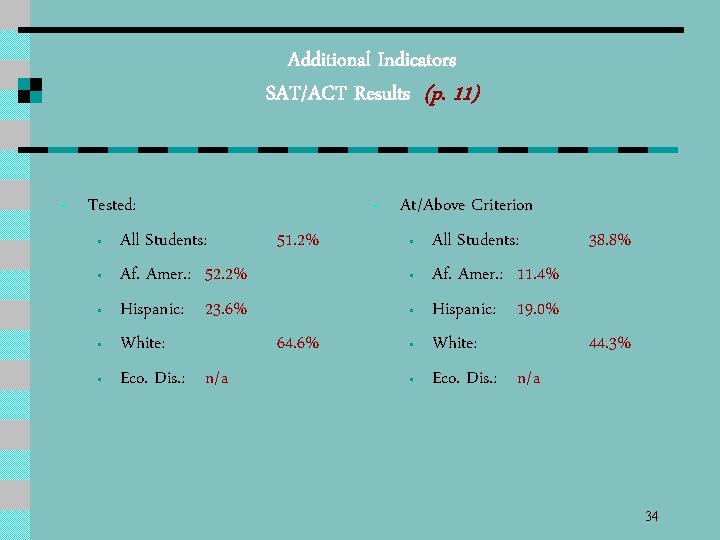
Additional Indicators: College Readiness Indicators • • 19. 3% of high school students completing an Advanced Course/Dual Enrollment –increase by 0. 2% over prior year (p. 10) 73. 1% of 2007 graduates completing the RHSP/DAP – an increase by 2. 7% from last year (p. 10) 7. 4% of AP students tested on at least one AP exam – increase of 2. 4% over prior year examination results (p. 10) 38. 8% of SAT/ACT scores at or above criterion – increase of 1. 6% over prior year 28
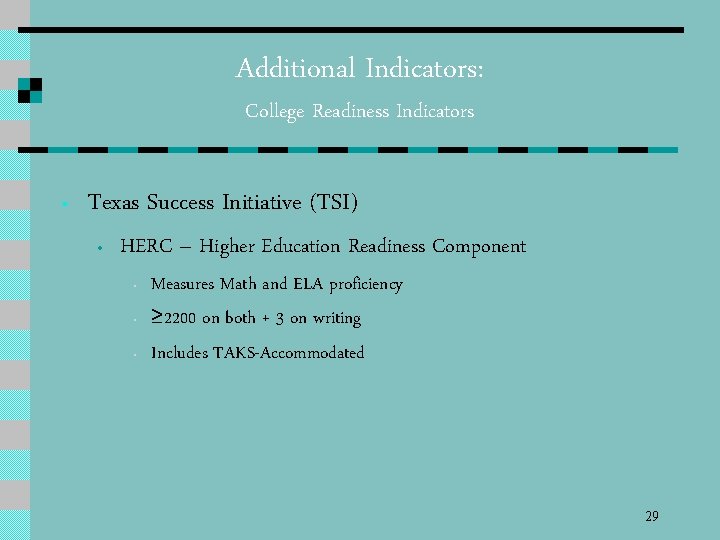
Additional Indicators: College Readiness Indicators • Texas Success Initiative (TSI) • HERC – Higher Education Readiness Component • • • Measures Math and ELA proficiency ≥ 2200 on both + 3 on writing Includes TAKS-Accommodated 29
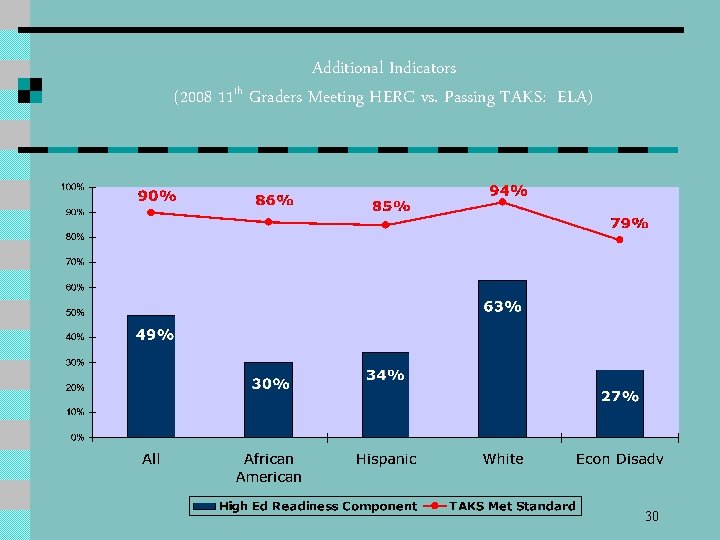
Additional Indicators (2008 11 th Graders Meeting HERC vs. Passing TAKS: ELA) 30
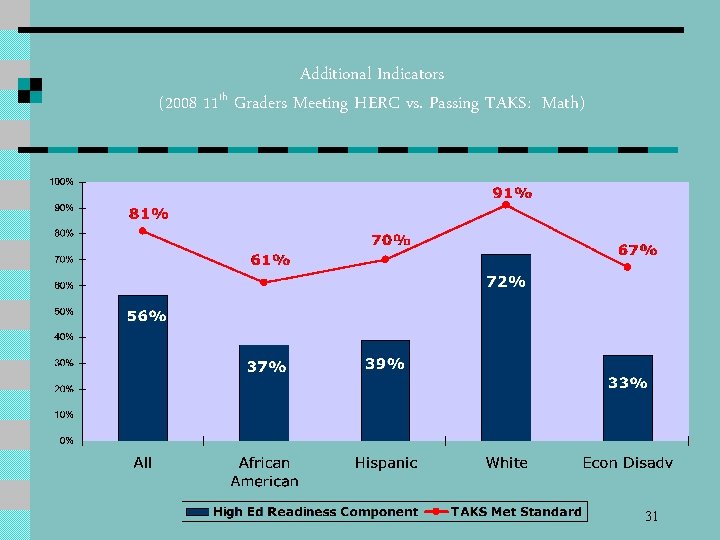
Additional Indicators (2008 11 th Graders Meeting HERC vs. Passing TAKS: Math) 31
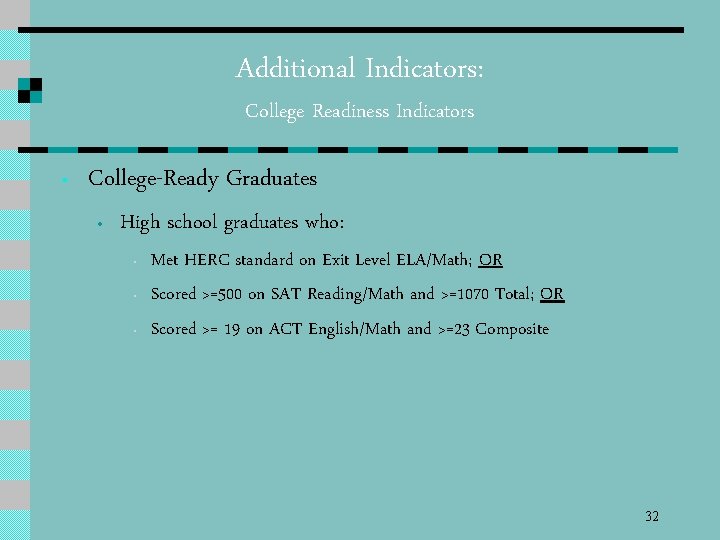
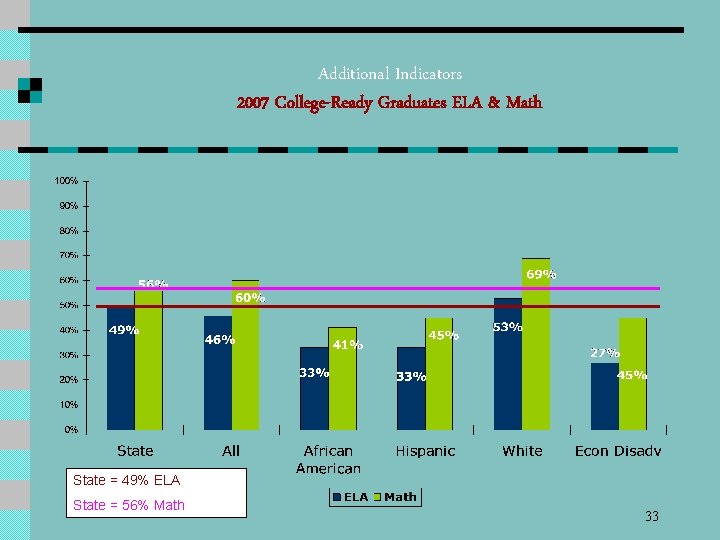
Additional Indicators: College Readiness Indicators • College-Ready Graduates • High school graduates who: • • • Met HERC standard on Exit Level ELA/Math; OR Scored >=500 on SAT Reading/Math and >=1070 Total; OR Scored >= 19 on ACT English/Math and >=23 Composite 32
Additional Indicators 2007 College-Ready Graduates ELA & Math State = 49% ELA State = 56% Math 33
Additional Indicators SAT/ACT Results (p. 11) • Tested: • All Students: • Af. Amer. : 52. 2% • Hispanic: 23. 6% • White: • Eco. Dis. : n/a • 51. 2% 64. 6% At/Above Criterion • All Students: • Af. Amer. : 11. 4% • Hispanic: 19. 0% • White: • Eco. Dis. : n/a 38. 8% 44. 3% 34
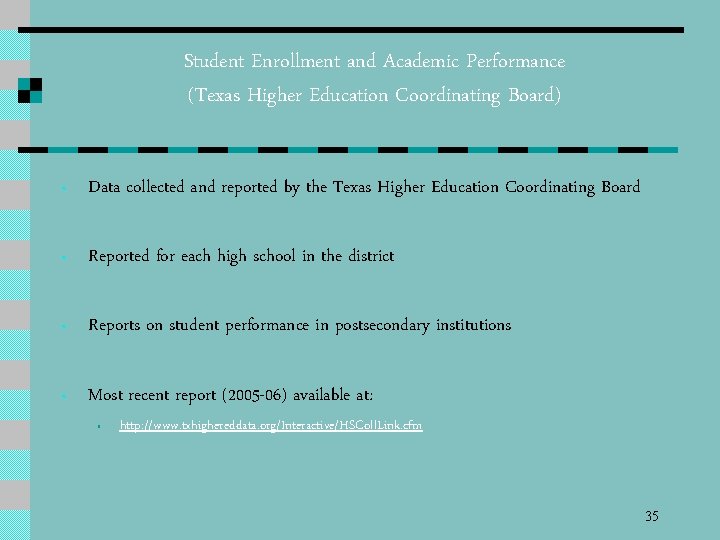
Student Enrollment and Academic Performance (Texas Higher Education Coordinating Board) • Data collected and reported by the Texas Higher Education Coordinating Board • Reported for each high school in the district • Reports on student performance in postsecondary institutions • Most recent report (2005 -06) available at: • http: //www. txhighereddata. org/Interactive/HSColl. Link. cfm 35
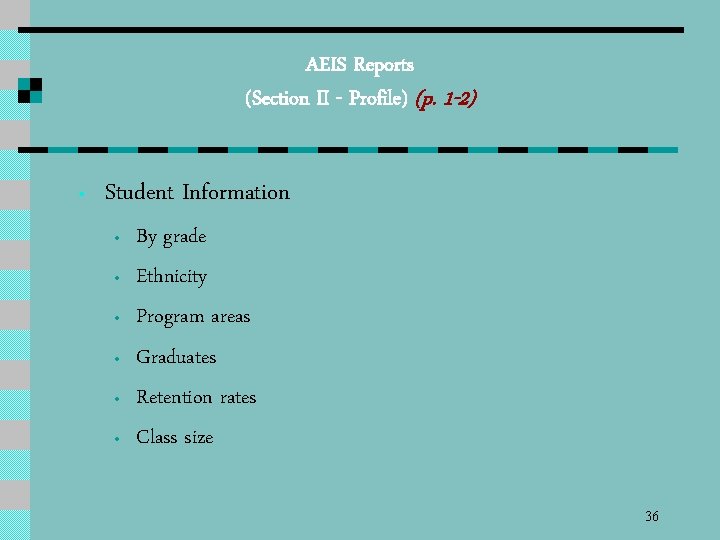
AEIS Reports (Section II - Profile) (p. 1 -2) • Student Information • • • By grade Ethnicity Program areas Graduates Retention rates Class size 36
AEIS Reports (Section II - Profile) • Staff Information (p. 3 -4) • • Professional staff Educational aides/auxiliary staff Ethnicity and gender Degrees held Experience Average teacher salary Turnover rate for teachers Financial Information (p. 5 -6) • • • Tax information Revenues Expenditures 37
Campus Performance Objectives • Campus Improvement Plans are based on the AEIS (available online on campus webpages) • • Performance Objectives are approved by the Board of Trustees (February Meeting) Data from the AEIS gives direction for the development of performance objectives that are low in relation to the accountability standards 38
Accessing the AEIS Report • Public Hearing • • • January 13, 2009 – Board Meeting Campuses schedule their own meetings Where the report is available • • • TEA website District website Campus libraries or offices 39