ABSCDO ABS Subprime Mortgage Portfolio ABS CDO Equity
 Not Rated repackage Equity")
从ABS到CDO:以次级贷为例 ABS Subprime Mortgage Portfolio ABS CDO Equity Tranche (5%) Not Rated repackage Equity Tranche (5%) Mezzanine Tranche (20%) BBB Mezzanine Tranche (15%) BBB Super Senior Tranche (75%) AAA Super Senior Tranche (80%) AAA
 • 是一种保险,对冲公 司债违约风险。 • 推广到MBS等资产证 券化产品。 CDS 买方 CDS spread")
CDS (Credit Default Swap) • 是一种保险,对冲公 司债违约风险。 • 推广到MBS等资产证 券化产品。 CDS 买方 CDS spread (e. g. , 50 bp per year) Payment if default CDS 卖方

MBS投资者:CMLTI 2006 -NC 2为例
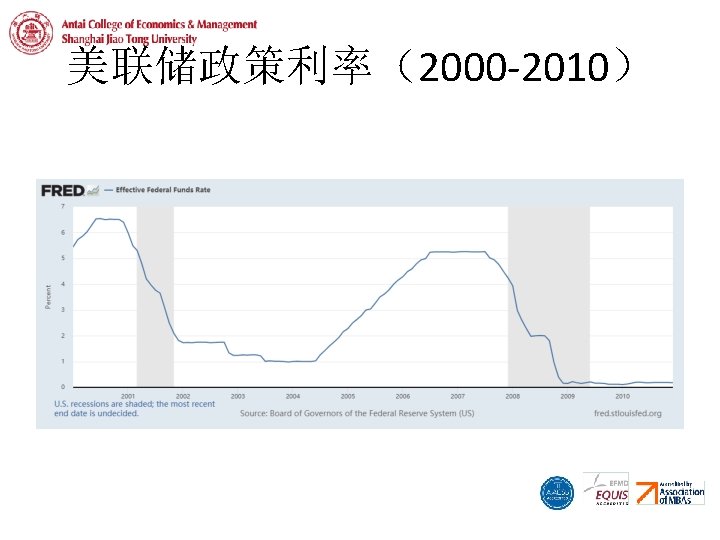

0 2019 2017 2015 2013 2011 2009 2007 2005 2003 2001 1999 1997 1995 1993 1991 1989 1987 1985 1983 1981 1979 1977 1975 1973 1971 1969 1967 1965 1963 1961 1959 1957 1955 1953 美国长期利率 10 -year Treasury Notes Yield (%) 18 16 14 12 10 8 6 4 2

54 60 19 62 19 64 19 66 19 68 19 70 19 72 19 74 19 76 19 78 19 80 19 82 19 84 19 86 19 88 19 90 19 92 19 94 19 96 19 98 20 00 20 02 20 04 20 06 20 08 20 10 20 12 20 14 20 16 20 18 20 20 19 58 19 56 19 19 利率倒挂 10 -year Yield minus EFFR 6 4 2 0 -2 -4 -6 -8

0 1961 1962 1963 1964 1965 1966 1967 1968 1969 1970 1971 1972 1973 1974 1975 1976 1977 1978 1979 1980 1981 1982 1983 1984 1985 1986 1987 1988 1989 1990 1991 1992 1993 1994 1995 1996 1997 1998 1999 2000 2001 2002 2003 2004 2005 2006 2007 2008 2009 2010 2011 2012 2013 2014 2015 2016 2017 2018 2019 信贷泡沫 Domestic Credit to Private Sector (% of GDP) 250 200 150 100 50
 10 000 9 000 8 000 7")
家庭债务 Household Mortgage Debt (unit: billion USD) 10 000 9 000 8 000 7 000 6 000 5 000 4 000 3 000 2 000 1 000 0 1999 2000 2001 2002 2003 2004 2005 2006 2007 2008 2009 2010 2011 2012
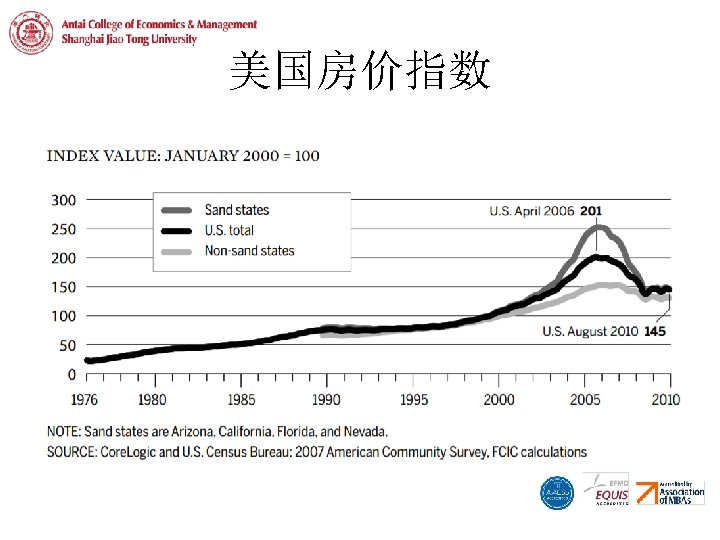

Case–Shiller指数
 – “No Income,")
按揭贷款标准下降 • “originate-to-distribute”取代“originate-tohold” • 获得按揭贷款的条件越来越宽松 – “Stated Income, Verified Assets" (SIVA) – “No Income, Verified Assets" (NIVA) – "No Income, No Assets" (NINA) • 贷款付息结构蕴藏更多风险 – interest-only adjustable-rate mortgage (ARM) – "option ARM" loans
 5%, 1000 bp/year 5万元 CDS 1 CDS 2 CDS 3 CDS n")
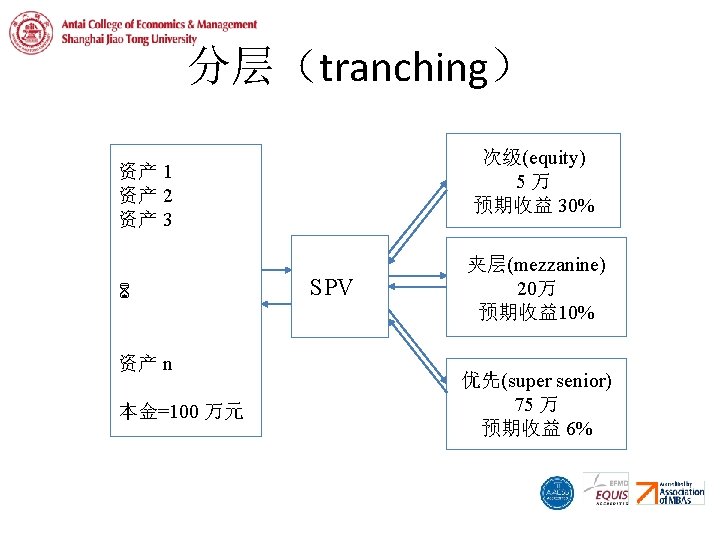
合成CDO 次级(equity) 5%, 1000 bp/year 5万元 CDS 1 CDS 2 CDS 3 CDS n 本金=100 万元 SPV 夹层(mezzanine) 5%-20%, 100 bp/year 15万元 优先(super senior) >20%, 10 bp/year 80万元

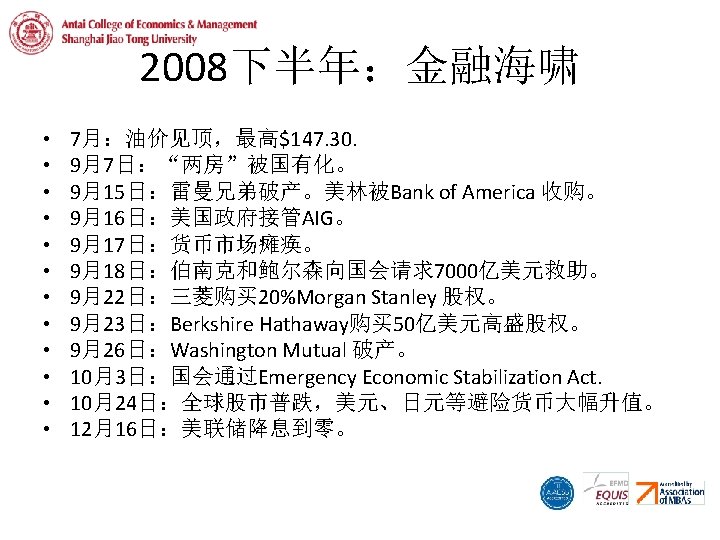
2008年上半年 • 1月:Bank of America 收购Countrywide Financial. • 2月:英国国有化Northern Rock. • 3月18日:美联储降息 75 bp,美元大跌,大宗商品大涨。 • 3月24日:JPMorgan Chase 收购 Bear Stearns, $10一股. • 3月28日:伯南克在国会听证会上说: “The impact on the broader economy and the financial markets of the problems in the subprime markets seems likely to be contained. ” • 同一天,Paulson 说: “From the standpoint of the overall economy, my bottom line is we’re watching it closely but it appears to be contained. ” • 次贷危机第一波结束。
 16 000 14 000 12 000 10 000 8 000 6 000")
道琼斯指数(2000 -2010) 16 000 14 000 12 000 10 000 8 000 6 000 4 000 2 000 0 2001 2002 2003 2004 2005 2006 2007 2008 2009 2010

20 -0 6 07 -0 20 7 07 -0 20 8 07 -0 20 9 07 -1 20 0 07 -1 20 1 07 -1 20 2 08 -0 20 1 08 20 02 08 -0 20 3 08 -0 20 4 08 -0 20 5 08 -0 20 6 08 -0 20 7 08 -0 20 8 08 -0 20 9 08 -1 20 0 08 -1 20 1 08 -1 20 2 09 -0 20 1 09 20 02 09 -0 20 3 09 -0 20 4 09 -0 20 5 09 -0 6 5 4 3 -0 -0 07 20 2 -0 07 20 1 -0 07 20 20 道琼斯指数(2007. 1 -2009. 9) 15 000 2007. 10. 9 14 000 13 000 12 000 2008. 10. 3 11 000 10 000 2008. 9. 15 9 000 8 000 7 000 2008. 10. 24 6 000

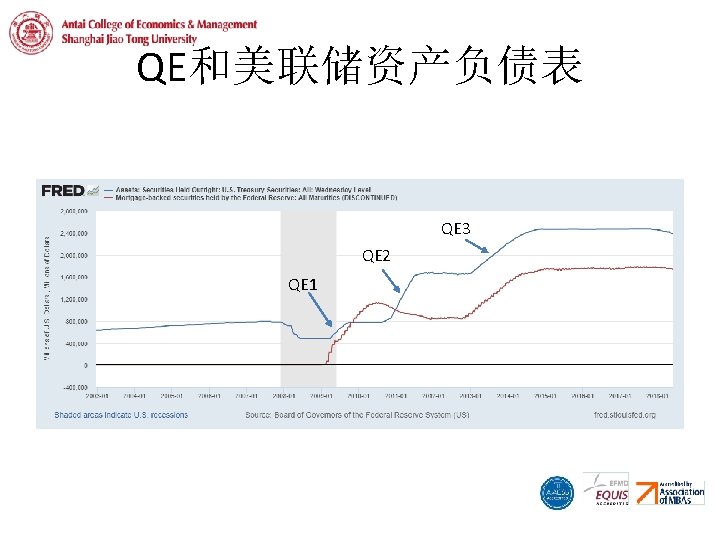
救市 • 救助金融机构 – “两房”, Bear Stearns, AIG, Citi, Goldman Sachs等 • 有毒资产购买 – 7000亿美元的Emergency Economic Stabilization Act, 主要为 Troubled Assets Relief Program (TARP) • 货币宽松 – 政策利率降到零 – 量化宽松(QE, 2008. 11, 2010. 11, 2012. 9)

Consumption Investment 9 9 00 00 /2 12 /2 09 /2 06 00 8 00 /2 03 /2 12 8 00 8 7 00 /2 09 /2 06 /2 03 00 7 7 00 /2 12 /2 09 /2 06 6 00 00 /2 03 6 00 /2 12 6 00 /2 09 5 6 00 /2 06 /2 03 00 5 00 /2 12 /2 09 5 00 4 4 00 /2 06 /2 03 /2 12 00 4 00 /2 09 4 00 /2 06 3 00 /2 03 3 3 00 /2 12 /2 09 3 00 /2 06 03 经济过热和衰退 Growth in Consumption and Investment (2002 -2009) 20% 15% 10% 5% 0% -5% -10% -15% -20% -25% -30%

3 3 3 -0 12 20 -0 11 20 3 -0 10 20 3 -0 09 20 3 -0 08 20 3 -0 07 20 3 -0 06 20 3 -0 05 20 3 -0 04 20 -0 03 3 • 2001年加入WTO ,经济高速增长。 • 过于依赖出口和 投资。 20 3 -0 02 20 3 -0 01 20 -0 00 20 中国 China Real GDP Growth (Quarterly, %) 16 14 12 10 8 6 4 2 0
 2007. 10. 16 7 000, 00 6 000, 00 2007. 5.")
A股大牛市 上证综指(2000 -2009) 2007. 10. 16 7 000, 00 6 000, 00 2007. 5. 30 5 000, 00 4 000, 00 2007. 2. 27 3 000, 00 2008. 11. 4 1 000, 00 2000 2001 2002 2003 2004 2005 2006 2007 2008 2009
 Export to the US")
中国 2008 -2009的减速 Quarter RGDP (Y 2 Y growth, %) Export to the US (Y 2 Y growth, %) 2008 Q 1 11. 5 5. 4 2008 Q 2 10. 9 12. 0 2008 Q 3 9. 5 15. 3 2008 Q 4 7. 1 0. 7 2009 Q 1 6. 4 -14. 8 2009 Q 2 8. 2 -18. 5 2009 Q 3 10. 6 -16. 7 2009 Q 4 11. 9 0. 6 Intermediate Macroeconomics
 China's Monthly Inflation Rate (%) 10 8 6 4 2 0 (2)")
通胀率(2004 -2014) China's Monthly Inflation Rate (%) 10 8 6 4 2 0 (2) (4) 2004 -01 2005 -01 2006 -01 2007 -01 2008 -01 2009 -01 2010 -01 2011 -01 2012 -01 2013 -01 2014 -01

存款准备金率 25% 20% 15% 10% 5% 0% 1998 1999 2000 2001 2002 2003 2004 2005 2006 Small Banks 2007 2008 Big Banks 2009 2010 2011 2012 2013 2014 2015
- Slides: 65