ABS Tablebuilder and Data Analyser Session 7 UNECE

ABS Tablebuilder and Data. Analyser Session 7 UNECE Work Session on Statistical Data Confidentiality 28 -30 October 2013 Daniel Elazar daniel. elazar@abs. gov. au

Traditional Framework for Analysis of Microdata • Users' Environment – Basic CURFs on CD-ROM • Remote Execution - RADL – Remote access to Basic and Expanded CURFs for statistical analysis in SAS, SPSS and STATA. • On-site - ABSDL - Access to Expanded or Specialist CURFs • Special Data Service/Consultancies

Most Sophisticated ABS Analysis Services by “Market Segment” Remot e Access Data Lab ess ophisticated CURFs Publica tion Output Survey Table Builder Analysi s Service Special Data Service / Consul tancies ABS Data Lab

Evaluation of Current Framework Pluses Minuses R Analysis of Confidentialised URF CD-ROM or RADL R RADL supports SAS, SPSS or STATA R ’Free’ coding suited to complex manipulations of data R Variety of household survey datasets available for analysis T RADL protections not tight enough to enable analysis of more detailed data T Limited to SAS, SPSS or STATA T Very few Business CURFs T Lengthy CURF creation process T Metadata not searchable

Future ABS Tabulation Environment MURF Output Table Builder Future ABS Research Environment User selects technique Data Transforms Tabular Linear MURF Logistic Probit Multinomial Confidentiality Filters Filter 1 Filter 2 Filter 3 Filter 4 Filter 5 Confidentialised Outputs Output

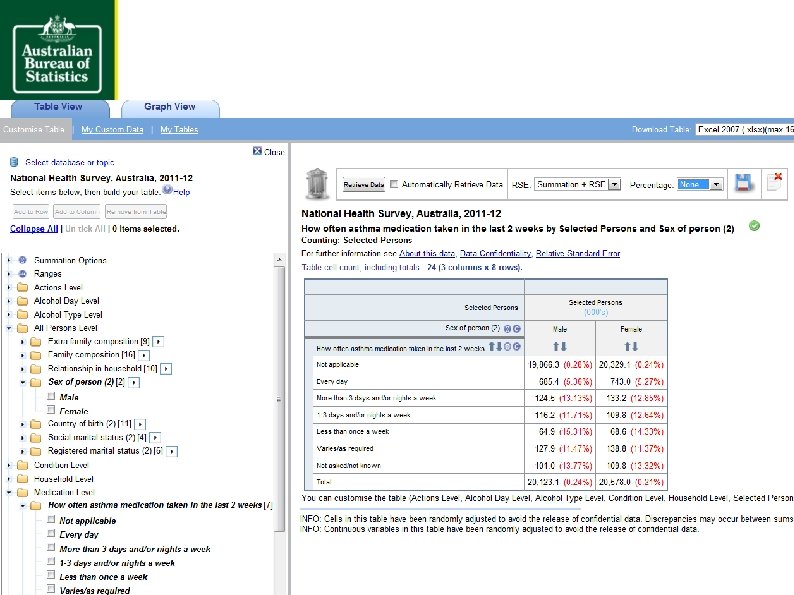
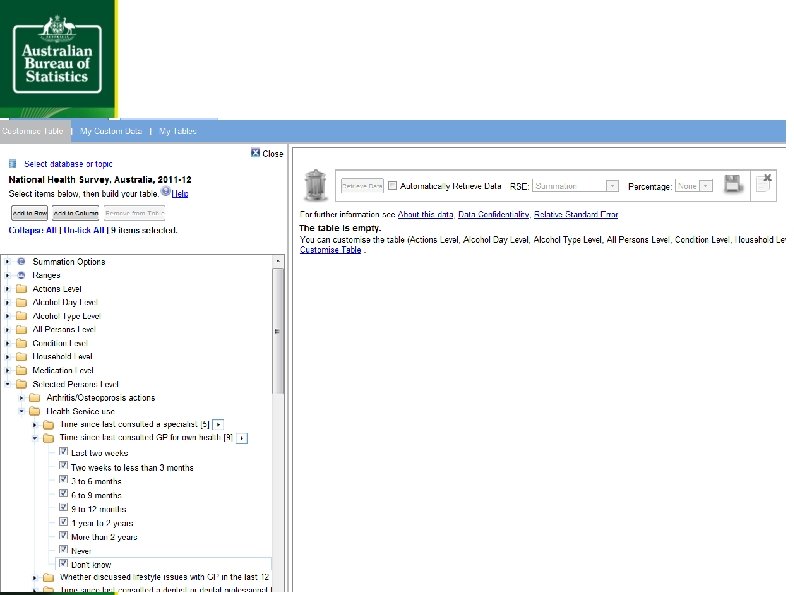
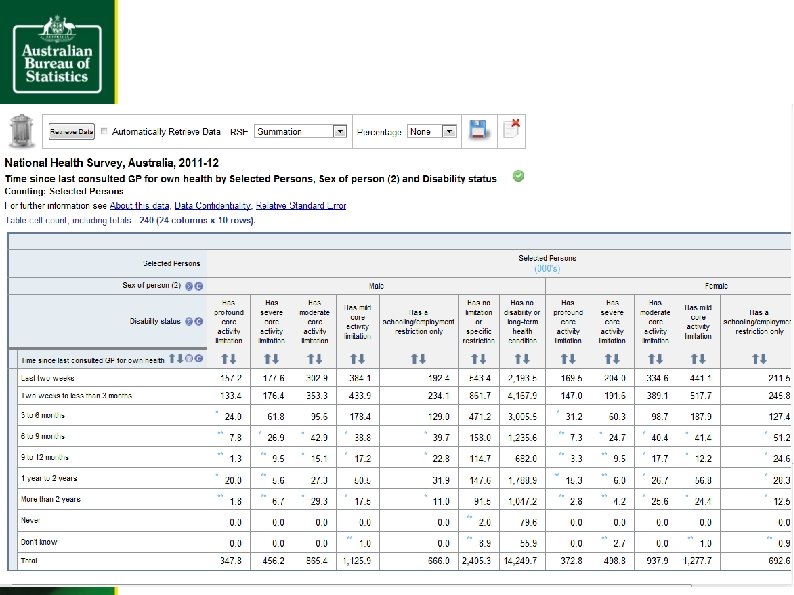
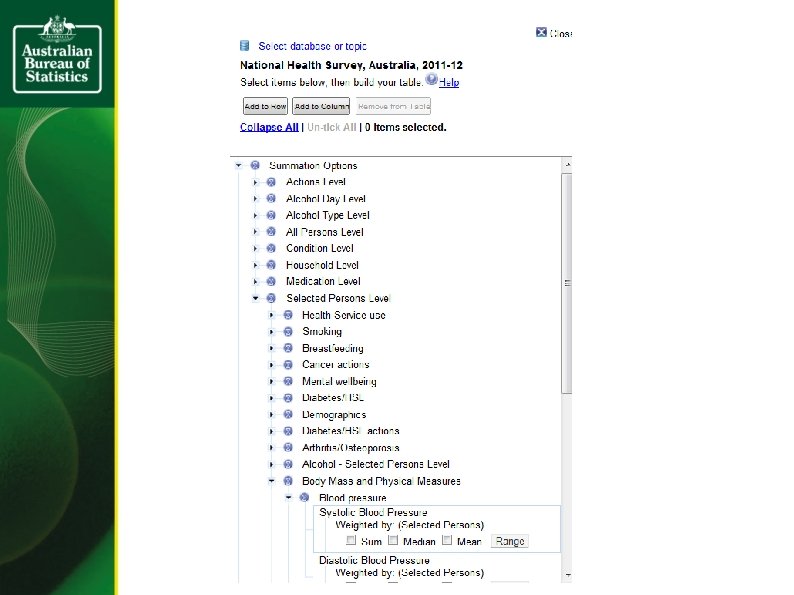
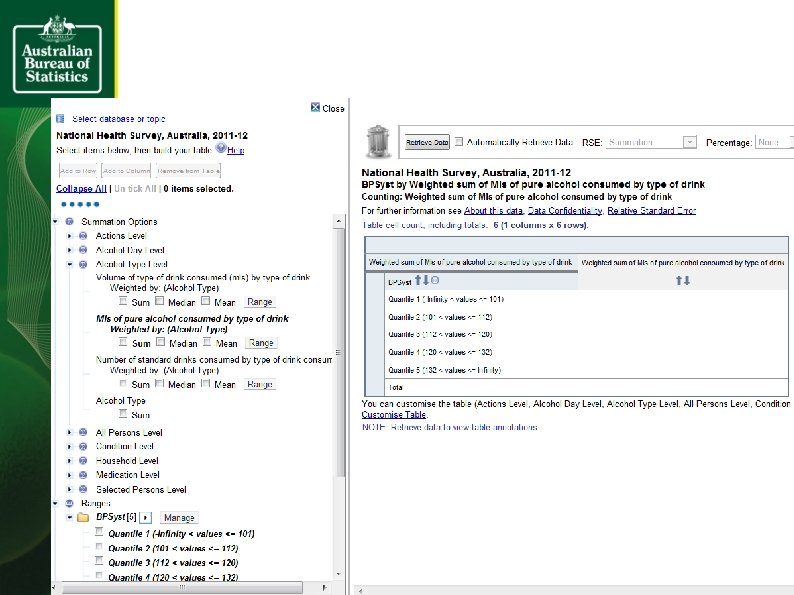
Table. Builder Functionality Weighted RSEs Counts R R Estimates R R Means R R Quantiles R R

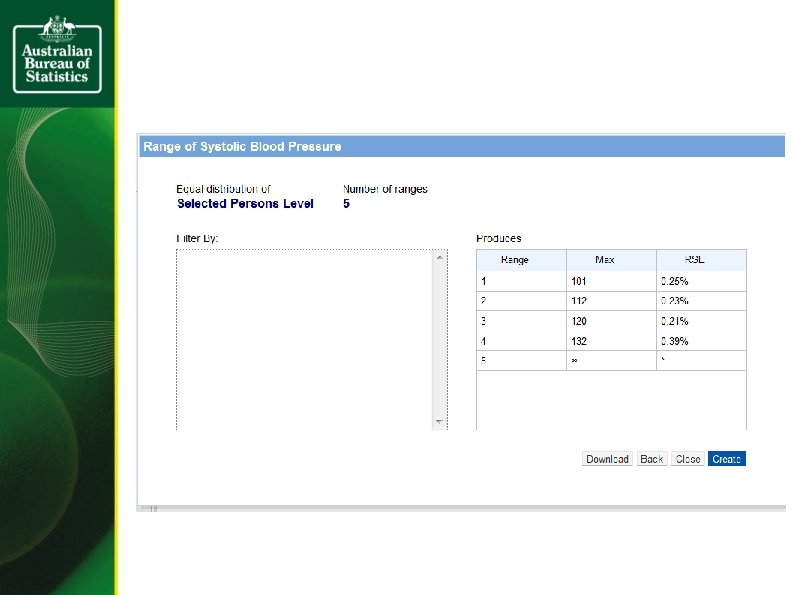
Table. Builder Protections Protection Description Perturbation Statistical noise added to values Custom Ranges min, max, min interval width Field Exclusion Rules Certain combinations of variable that increase identification risk are prohibited Additivity Restores additivity of inner cells to margins Sparsity checks Tables with too high a proportion of cells with a small number of contributors are not released RSEs Further adjusted; quality cutoff
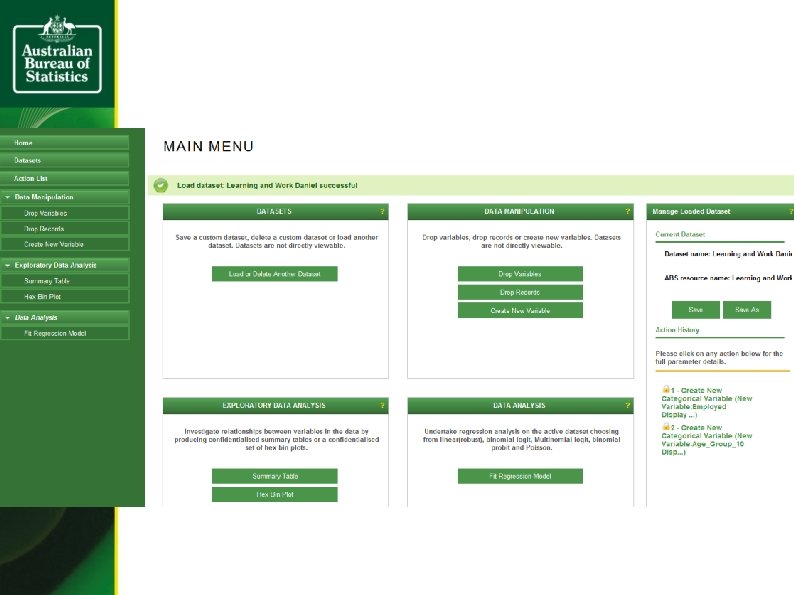
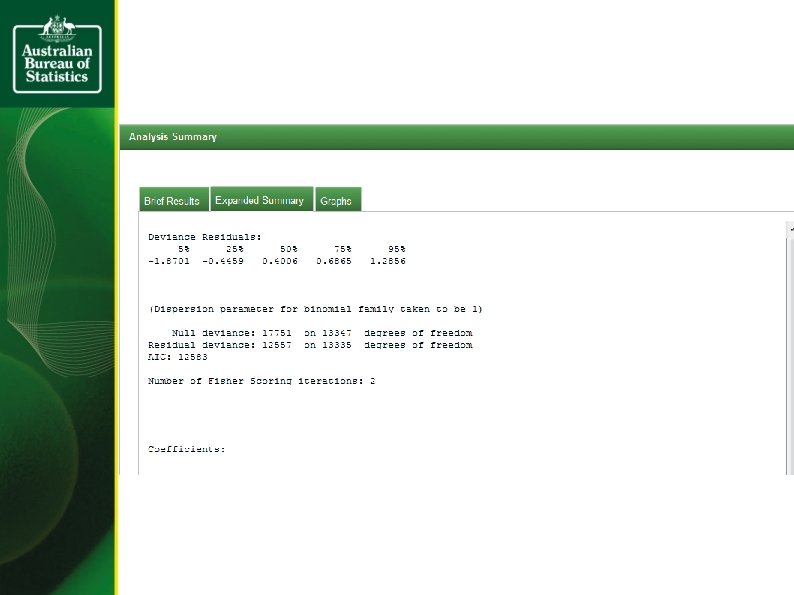
 Summary Tables Graphics (side-by-side")
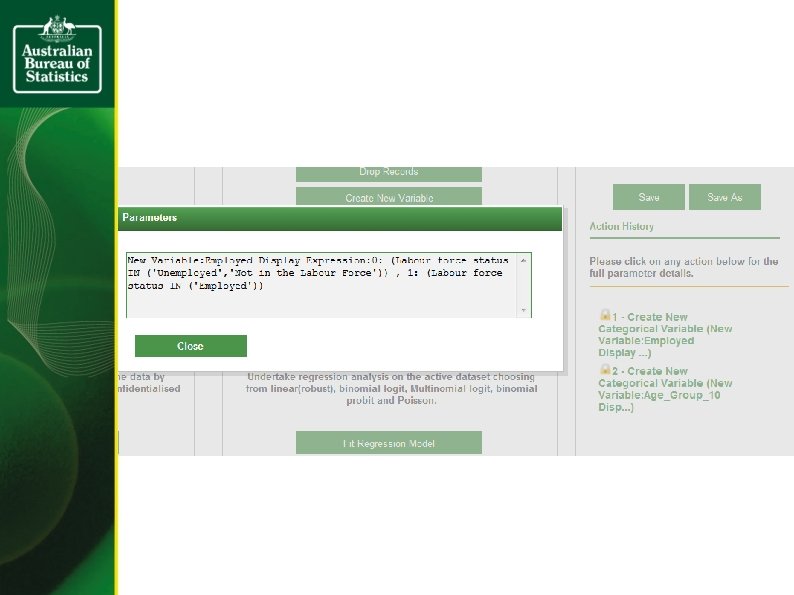
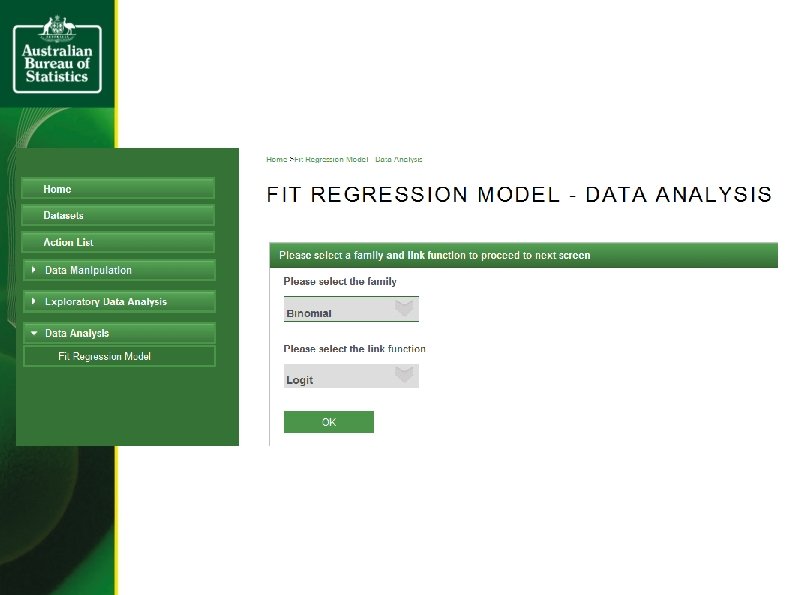
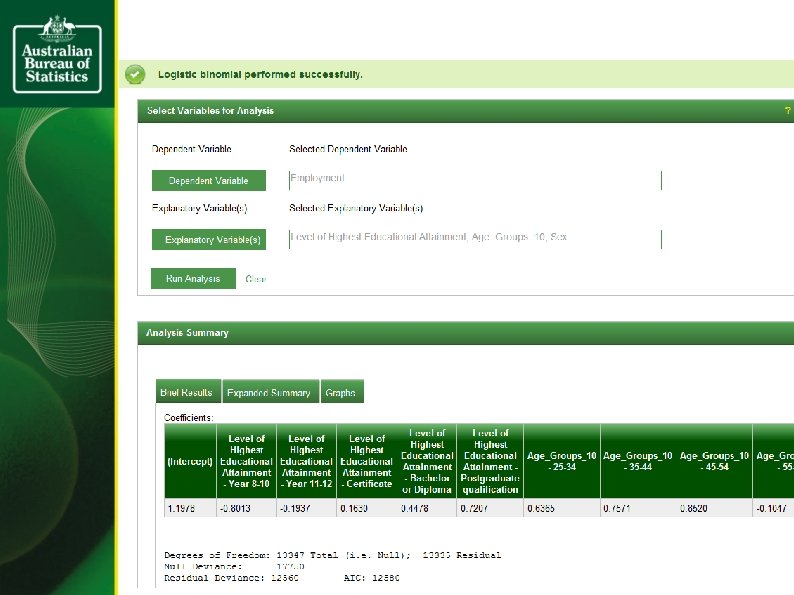
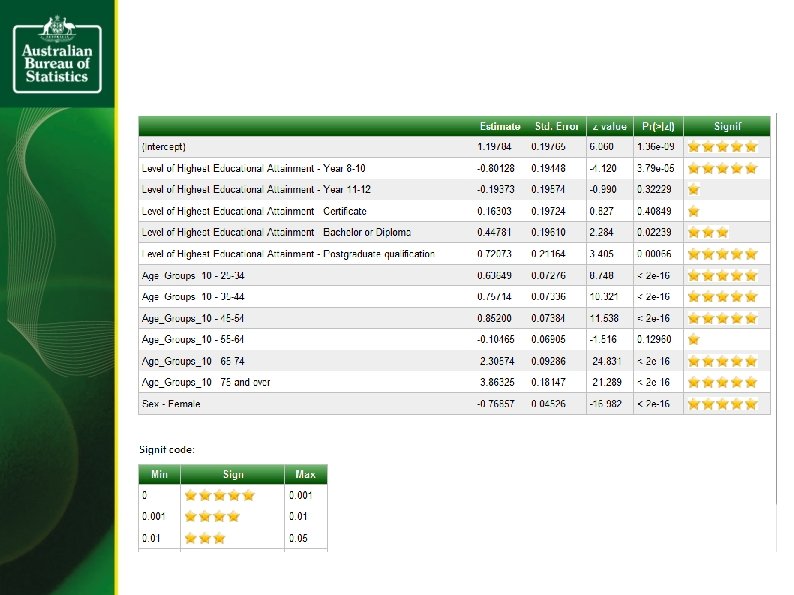
Data. Analyser Functionality Exploratory Data Analysis Summary statistics (sums, counts) Summary Tables Graphics (side-by-side box plots) Summary statistics (count) Analysis Transformations Procedures / Derivations /Specifications Logical derivations Robust Linear Regression Categorical/ Dummy variables Binomial logistic Category collapsing Probit Multinomial Expression Editor for categ. vars Poisson Drop variables / records Weighted Analysis Diagnostics Outputs R-squared CSV Pseudo Rsquared Storage of intermediate datasets Coefficients Standard errors Other Diagnostics Graphics Action List • Written in R • Full User Authentication • Audit System Output Formats • Workflow Control • Data Repository Interface
 Perturbation Statistical noise added to regression score function")
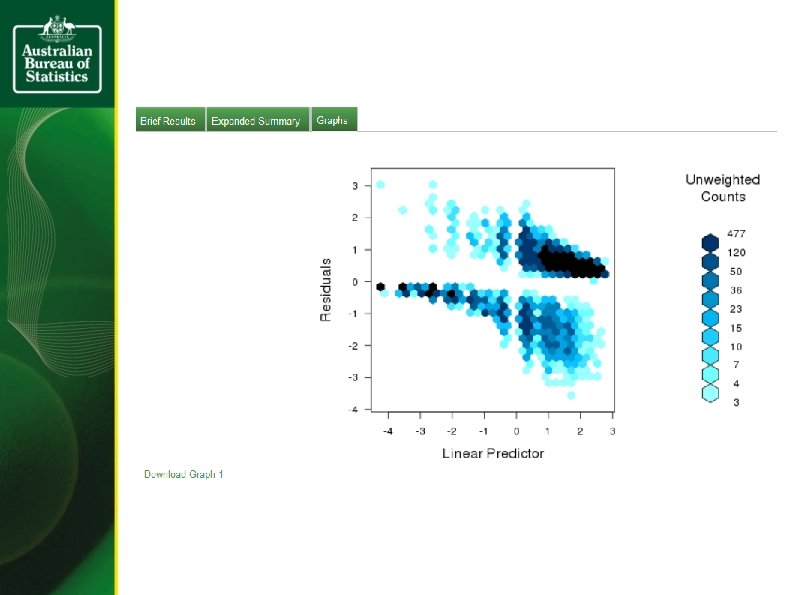
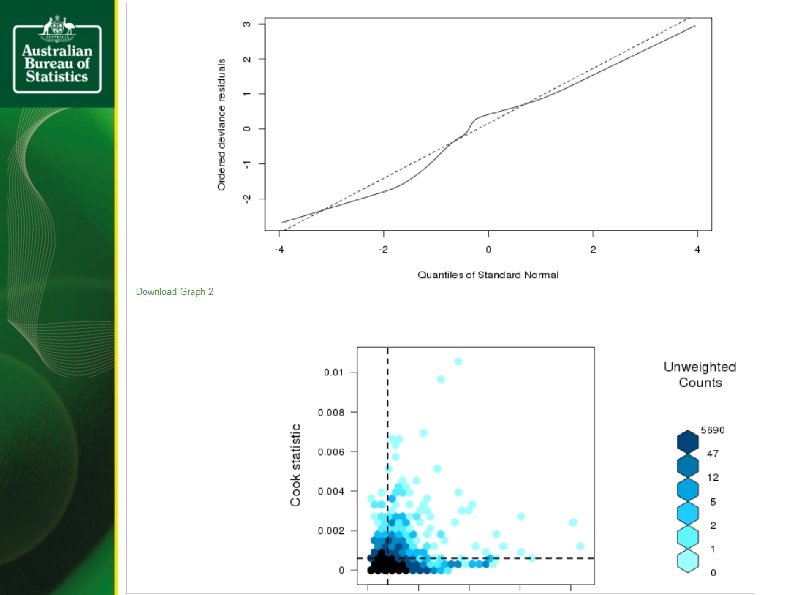
Data. Analyser Protections (additional to TB) Perturbation Statistical noise added to regression score function Linear Robust Huber Mallows robustness incorporating perturbation for outliers and leverage points Hex Bin Plots Replaces scatter plots Coverage and scope based Perturbation controlled by the specific units included in scope and the definition of scope Drop k units One record is dropped for each category of each explanatory categorical variable Explanatory Only Variables Demographic variables not allowed in the response variable field Sparsity Regressions based on to few units are not released Leverage Regressions on data containing units with excessive leverage are not released

Hex-bin plots

Future Directions 1 Collaborations with other NSIs 2 Enhancements to Table. Builder and Data. Analyser: - hierarchical datasets - better performance with large datasets / high loads - linked datasets - sophisticated metadata handler 3 Conduct user consultation More advanced functionality for Data. Analyser - e. g. multilevel models 4 Business data 5 Single ABS publication system (single source of truth – consistency of confidentialised outputs) 6 Measures of utility – information loss
- Slides: 31