About Nationwide Childrens Hospital Provide more than 122

About Nationwide Children’s Hospital » Provide more than $122 million in charity care and community benefit services annually » Ranked in all 10 specialties on U. S. News & World Report’s 2013 -2014 list of “America’s Best Children’s Hospitals” » Ranked 9 th on Parents magazine’s 2013 "Best Children's Hospital's" list » Fourth busiest children's hospital in the country** » Fourth largest children's hospital in the country** » More than 1 million patient visits in 2013 » Patients came from 50 U. S. states and 31 foreign countries in 2013 » The Research Institute at Nationwide Children’s Hospital is one of the top 10 NIH-funded freestanding pediatric research facilities in the U. S. …………………………………………………………………. .

My View Point on Accountability • Every dollar spent on the Marketing/PR agenda is one less $ that goes directly into clinical care • Proactive accountability now = less pain at the negotiating table later • Key to gaining new resources and not losing the ones you have now • Creates the clear roadmap for staff/clients/resources • It’s the right thing to do! ………………. . …………………………………………………………………. .

Operational Accountability • Marketing & PR for your Marketing & PR – Monthly: Tactical Reports – Show and Tell ( very little data) – Quarterly: Strategic Reports – Results and course Corrections. This is where our VP Manages Up – Reporting of Scorecard – Staff: manages out – client reporting with dashboards • Personal Performance Management – Quarterly: staff review personal goals with Mgr. …………………………………………………………………. .

Goal Setting can be overwhelming…. My goal is simple. It is complete understanding of the universe, why it as it is and why it exists as all. Stephen Hawking ………………. . …………………………………………………………………. .

Great Questions to Ask Goal: Increase local awareness of our service • What questions might you ask to refine this goal? – among who? (Target Audience) – increase from what to what – what’s current awareness? (What can we measure? ) – increase awareness of us as what? (Key message/positioning points? ) – Is awareness the ultimate goal or only part of another goal – increase awareness so that… (what is my role? ) HINT – more helpful tips at the back of the PPT via Danny Fell ………………. . …………………………………………………………………. .

Marketing Evaluation Can Be Strategic • Attitudinal – Impact on awareness, perception, preference • Behavioral – Response to Call-to-Action Messages • Financial – Measurable impact to the “bottom line” ………………. . …………………………………………………………………. .

Establish KPI’s Financial Attitudinal Behavioral National Visibility • Research funding • Media share of voice/ Ad Value • Donations • U. S. News & World Reports Ranking • Child Magazine Ranking • Increased national & international referrals • Pediatric Directions Mailing Response • Increase web traffic Regional/ Local Market Share • Increased referrals • Increase Welcome Center Referrals (Measures expanded regional referrals) • Consumer advertising ROI • Media share of voice/Ad Value • Consumer/Opinion Leader Brand Tracking Study • Referral Physician Awareness • Physician Satisfaction Survey • Increase web traffic • Increase calls to Physician Referral/ Assistance Line • Increase physician participation in NCH events • Increased participation in editorial contributions • Increase participation in NCH media panel ………………. . …………………………………………………………………. . • Recommend NCH as place to work Client Satisfaction • Physician Leadership end-of -year survey

Goals Build Scorecard Metrics* Q 4 National Media Share of Voice (measures share of all media coverage garnered among target group) Q 4 Goal 2 nd place 72 60 70 Surgeries (Neurosurgery, Orthopedic, Ped Surg, Thoracic & Urology) – Target 2% growth in select geography 6, 000 (2% Growth) 8, 148 8, 311 Region II – Net Revenue from Targeted Referring Physicians (6% growth) 4% (on-track for year-end 1% 6% Cause Marketing Revenue $72, 000 $25, 000 $40, 000 Choice for Sports Medicine 51% 43% On-line consults for signature product lines via Internet minus Research (yearend financial reconciliation) Status Notes Regional Strategy for Surgical Services Local *Example Only Not Real Data Maternity leave for three physicians

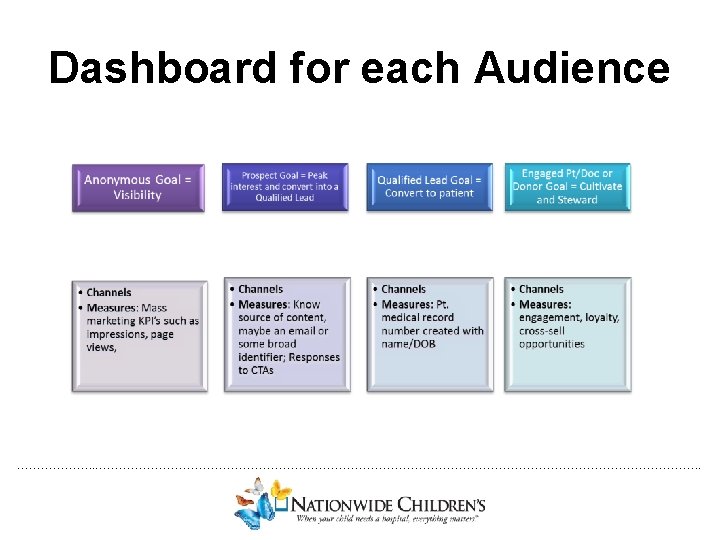
Dashboards =Different For our Department here is our Purpose: • Show effectiveness of channels in lead generation process (to show when and where $ are spent) Here is our Process: • By audience look at sales model what feeding • Consensus of metrics reporting and by channel • Who’s responsible to report ………………. . …………………………………………………………………. .

Nationwide Children’s Hospital Interactive Dashboard – Q 1 2014 1 000 800 000 600 000 400 000 200 0 January February Pageviews 2014 March Pageviews 2013 Geographic Website Traffic 45, 580 Visits at other Nationwide Children’s Websites* 500 000 450 000 400 000 350 000 300 000 250 000 200 000 150 000 100 000 50 000 0 International Pageviews; 140 044 Ohio Pageviews; 1 615 830 January February Visits 2014 Visits 2013 March United States Pageviews; 532 333 Regional Pageviews; 133 392

Social Media Impressions* Website Traffic from Social Media 7600000 25000 7400000 20000 7200000 Yelp Weebly Twitter 15000 7000000 reddit Pinterest 10000 6800000 Linked. In 5000 6600000 Google+ Facebook 0 6400000 You. Tube January February March Blogger 6200000 Jan Feb Mar 21, 201, 406 Social Media Impressions* Q 1 Website Events from Social Media Event Name Number of Events Careers Portal Click 702 External Link Click 572 Downloaded File 506 Email Address Click 101 Form Submission 58 Homepage Carousel Click 41 Requested Directions 8 Request an Appointment Form Completion 3 Bariatric Info Session Click 3 Grand Total Key Website Traffic Drivers Bookmarked/Direct 10% Pay Per Click 32% Email Organic Search Results 54% Other Websites 3% 1% 1994 *Impression data from Twitter and Facebook accounts

Referral Lifecycle Website Visits Started Referral Form Parent/Guardian Referrals Completed Referral Form Physician Referrals ………………. . …………………………………………………………………. .

Search Marketing Results Center for Colorectal and Pelvic Reconstruction Campaign Request Appointment Events 2 Carousel Clicks 1 External Link Clicks 21 11 Form Submissions 3 Downloads Email Address Clicks 7 Ad Impression History - Colorectal Center 6000 Distribution of Ad Clicks in Anorectal Ad Groups Colorectal malformations 16% 5000 Marc Levitt Idiopathic 2% Constipation. Encopresis 37% 6% Hirschsprung Disease 35% 4000 3000 2000 1000 0 Colorectal Problems in Kids 3% 1 2 3 4 5 6 7 8 9 10 11 12 13 14 15 16 17 18 19 20 21 22 23 24 25 26 27 28 29 30 31 32 33 34 35 36 Colorectal Center Ad. Group Performance, This Reporting Period Ad. Group Anorectal malformations Carlo Dilorenzo Cincinnati Children’s Colorectal Center Colorectal Problems in Kids Encopresis Fecal Incontinence Hirschsprung Disease Idiopathic Constipation Marc Levitt Total Ad Impressions 10, 025 87 99 3, 758 1, 767 773 14, 053 16, 379 417 47, 358 Ad Clicks 163 2 1 26 61 2 352 370 23 1, 000 Click-Thru Rate 1. 63% 2. 30% 1. 01% 0. 69% 3. 45% 0. 26% 2. 50% 2. 26% 5. 52% 2. 18%

The Boss Is Happy Note to Self…This IS your MOST IMPORTANT metric!

Experiment and Expand • TBIH what next? • Managers must realize that the balanced scorecard is not set in stone data typically points out areas that should be modified or adapted. • Teach your team about metrics – Brown bag lunches – Provide data regularly ………………. . …………………………………………………………………. .

Questions? Stephanie. Cannon@Nationwide. Childrens. org Twitter: @cannons ………………. . …………………………………………………………………. .

Handouts of Q’s to ask for foundation of data needs • Philosophy and Processes – Do we have strong examples that illustrate our measurement efforts and our successes? – Is there internal agreement on commonly employed measures and formulas, such as conversion rates , revenue reconciliation, and ROI – What processes are in place to ensure measurement and reporting? What processes do we need to have? Source: Daniel Fell “Marketing Analytics: The New Imperative to Measure and Improve Marketing” Strategic Health Care Marketing January 2012 ………………. . …………………………………………………………………. .

Handouts of Q’s to ask for foundation of data needs • Data Sources – What do we spend on al the carious data services and subscription-based tools today, and can we consolidate and/or make better use of them – Who within the marketing function should be tasked with managing analytics efforts – How do we best compile, share, analyze, and report on the most meaningful data and marketing measures Source: Daniel Fell “Marketing Analytics: The New Imperative to Measure and Improve Marketing” Strategic Health Care Marketing January 2012 ………………. . …………………………………………………………………. .

Handouts of Q’s to ask for foundation of data needs • Knowledge and Training – How families is our marketing staff with designing and implementing a meaningful analytics program – What processes are in place to ensure our marketing department is keeping up with new approaches to measurement and staying ahead of the curve – How are we training our staff on standard practices and measurement requirements Source: Daniel Fell “Marketing Analytics: The New Imperative to Measure and Improve Marketing” Strategic Health Care Marketing January 2012 ………………. . …………………………………………………………………. .

Handouts of data needs • Data from your web traffic reports – Visitors – Bounce rates – Unique visitors – Geo of visitors – Time on site – Number of pates visited – Path of visitor sessions – Referring domain – 404 errors – Search terms used to find site (SEO) – Browser type – Platform type (including mobile) – Top entry and exit pages ………………. . …………………………………………………………………. .
 – – – Request for appointment")
Handouts of data needs • Business Value (ROI) – – – Request for appointment Calls to call center – referral based Class registrations Call tracking (across the board) Donations (if you work with your development team) Event registrations Online gift shop Enewsletter registrations Job applications Online bill payment Clinical trial recruitment Anything you can count as a conversion! ………………. . …………………………………………………………………. .

Handouts of data needs • Data from your social media channels – Channel growth – you can (for free) easily track growth of visitors, views and subscribers – referrals to website – downstream traffic – Clicks on URL’s like bit. ly to track conversion rates – Buzz by channel (brand mentions) – Facebook offers daily – “people talking about this” you can compare across competition for how engaged people are with you – Facebook offers “Who’s talking about us” – demographics of engaged people – Track most popular post for that given timeframe – Twitter interactions and mentions via your @handle – Twitter retweets – Customer service requests or assists via social media channels – You. Tube offers geographic information – You. Tube offers traffic sources ………………. . …………………………………………………………………. .

Handouts of data needs • Marketing Data – Publications • Readership Surveys • Tracking CTA Response • New Customer Referral/Acquisition – Media – Attitudinal • New Media Contacts Acquired – Ad Equivalency per contact • Web site registrations – Events • Cost per contact • New Contacts • Business Generated ………………. . …………………………………………………………………. .

Handouts of data needs • Ad Data – – – Media mix Impressions Demographics of channels CTR ( if digital or SEM campaign) Conversion rates of people coming from ad-specific URL’s ………………. . …………………………………………………………………. .
 – – – Customer")
Handouts of data needs • Business Value (non ROI quantifiable) – – – Customer satisfaction (Press Gainey or others) Operational efficiency Brand overall Competitive positioning Market exposure ………………. . …………………………………………………………………. .

Sources • • • http: //www. encyclopedia. com/topic/Balanced_Scorecard. aspx Sonar 6’s color paper http: //www. motivitysolutions. com/Culture. Changing. Technology/Business. Intelligence. a spx Analytics: The new path to value (IBM Global Business Services Executive Report) Greystone. net – ROI and effectiveness Webmaster Workshop ………………. . …………………………………………………………………. .
- Slides: 30