
About Georgia Transmission Corporation GTC Transmissiononly notforprofit cooperative
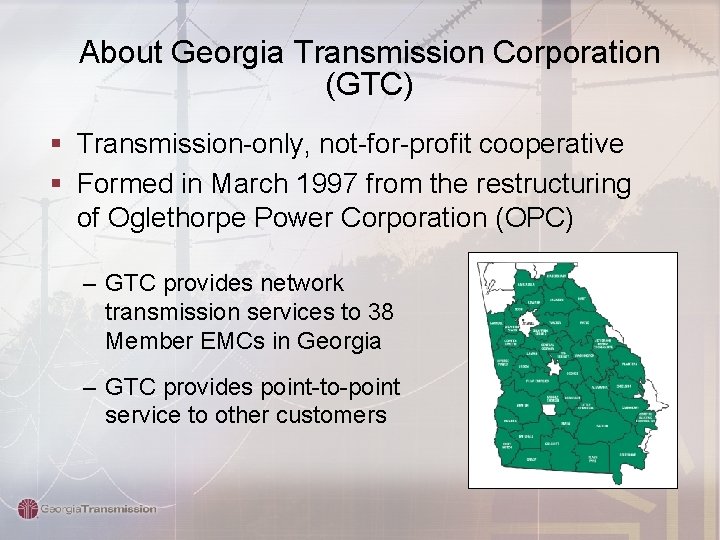
About Georgia Transmission Corporation (GTC) § Transmission-only, not-for-profit cooperative § Formed in March 1997 from the restructuring of Oglethorpe Power Corporation (OPC) – GTC provides network transmission services to 38 Member EMCs in Georgia – GTC provides point-to-point service to other customers
GTC Overview – System Assets Transmission Lines 46 k. V lines 69 k. V lines 115 k. V lines 230 k. V lines 500 k. V lines Total lines Substations Transmission substations Distribution substations Total substations 275 miles 14 miles 1, 132 miles 1, 274 miles 477 miles 3, 172 miles 91 569 660
Georgia ITS • GTC owns more than 3, 100 miles of transmission lines • GTC has access to more than 17, 000 miles of transmission lines in Georgia through the Georgia Integrated Transmission System (ITS) – Assets owned by GTC, Georgia Power, MEAG Power and Dalton Utilities
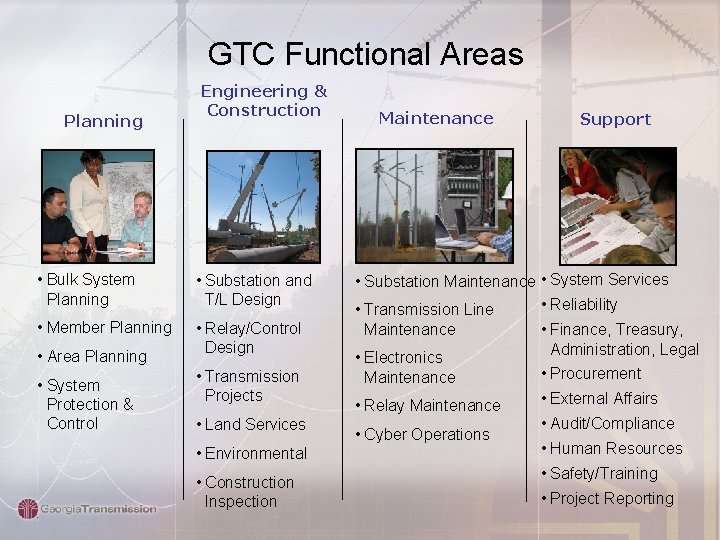
GTC Functional Areas Planning Engineering & Construction • Bulk System Planning • Substation and T/L Design • Member Planning • Relay/Control Design • Area Planning • System Protection & Control • Transmission Projects • Land Services • Environmental • Construction Inspection Maintenance Support • Substation Maintenance • System Services • Reliability • Transmission Line Maintenance • Finance, Treasury, Administration, Legal • Electronics • Procurement Maintenance • External Affairs • Relay Maintenance • Cyber Operations • Audit/Compliance • Human Resources • Safety/Training • Project Reporting
GTC Goals for the PQ Dashboard Project (DFR) 1. Use the PQ Dashboard, with records from the Digital Fault Recorders (DFR), to look at nontrip events that were recorded (Voltage and Current Sags and Swells) 2. Using DFR data to perform automatic double ended fault location calculations and send out email 3. Using the DFR data to monitor breaker trip times and send out notifications for slow operating breakers
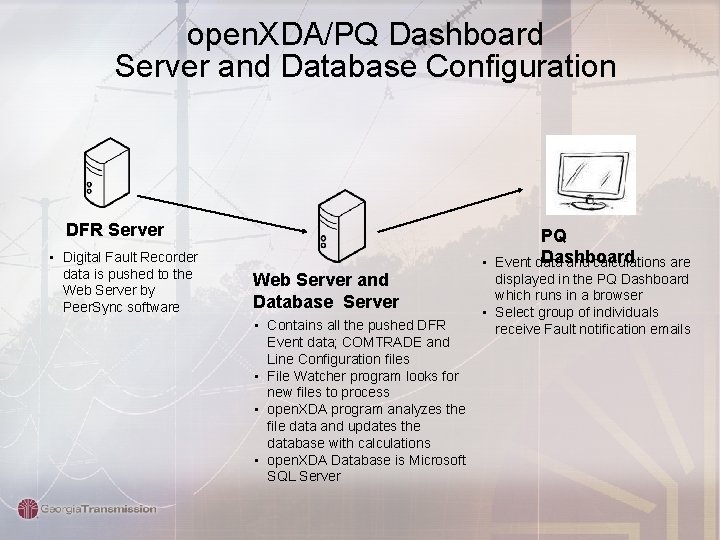
open. XDA/PQ Dashboard Server and Database Configuration DFR Server • Digital Fault Recorder data is pushed to the Web Server by Peer. Sync software PQ Dashboard • Event data and calculations are Web Server and Database Server • Contains all the pushed DFR Event data; COMTRADE and Line Configuration files • File Watcher program looks for new files to process • open. XDA program analyzes the file data and updates the database with calculations • open. XDA Database is Microsoft SQL Server displayed in the PQ Dashboard which runs in a browser • Select group of individuals receive Fault notification emails
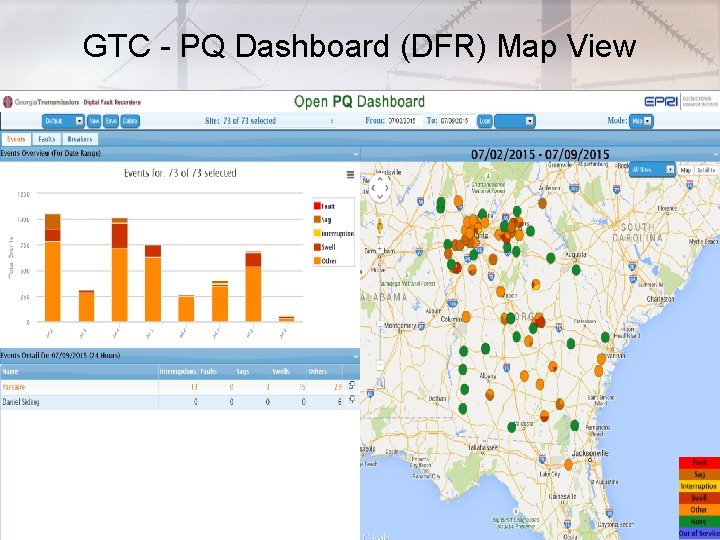
GTC - PQ Dashboard (DFR) Map View
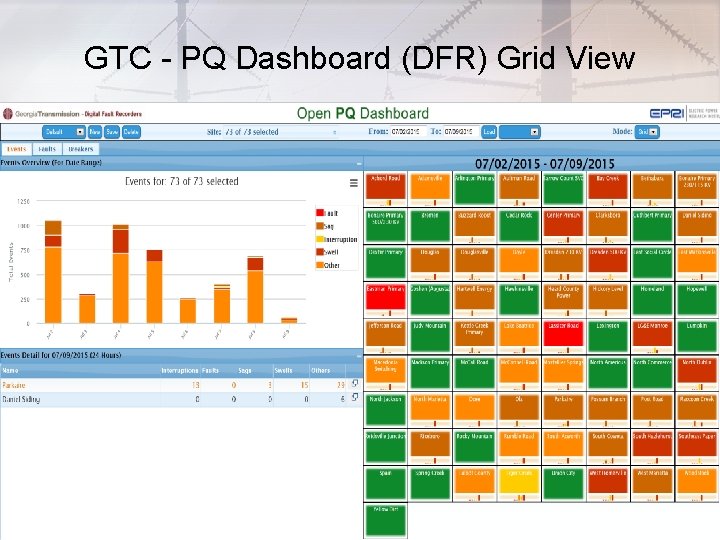
GTC - PQ Dashboard (DFR) Grid View
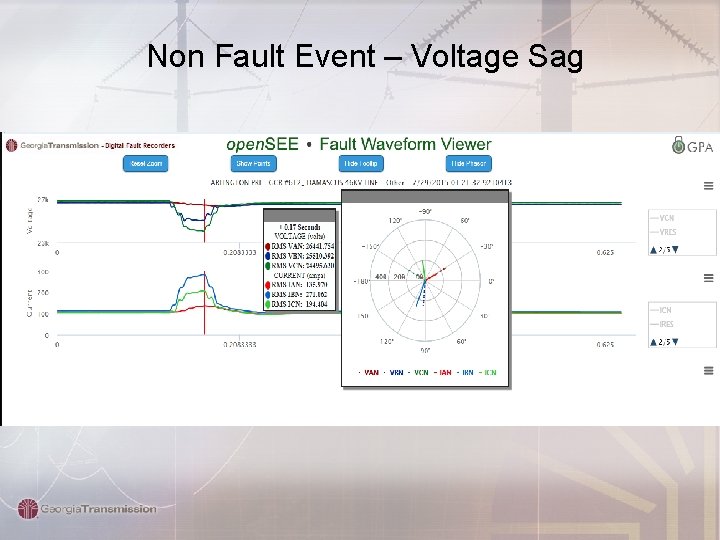
Non Fault Event – Voltage Sag
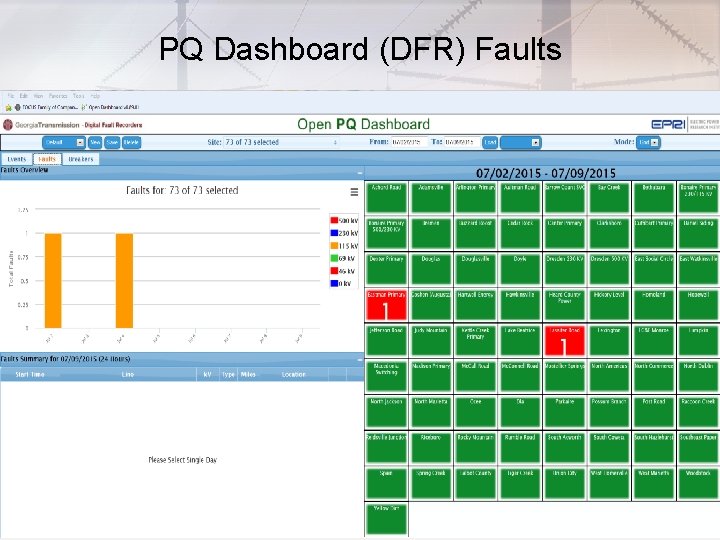
PQ Dashboard (DFR) Faults
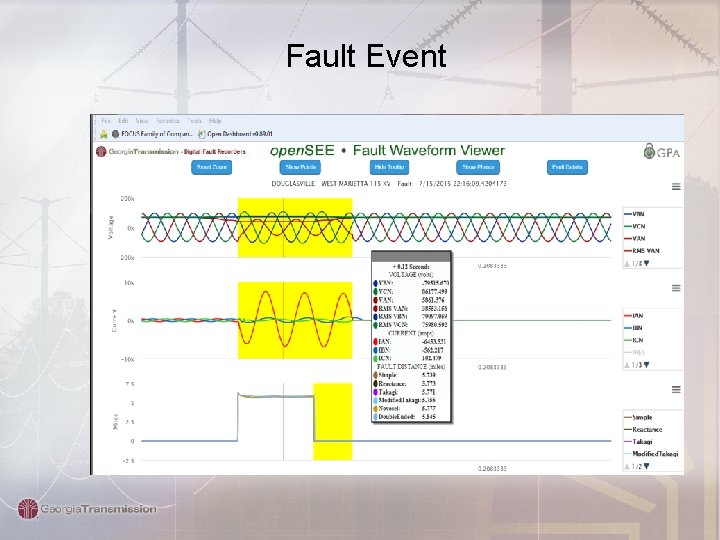
Fault Event
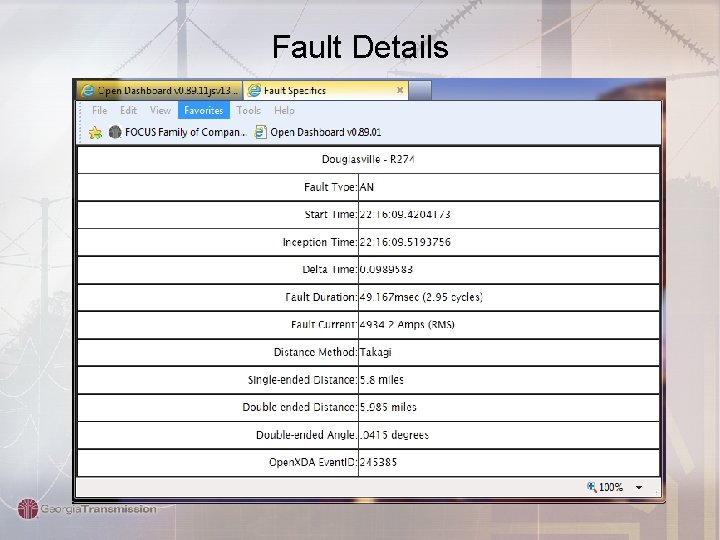
Fault Details
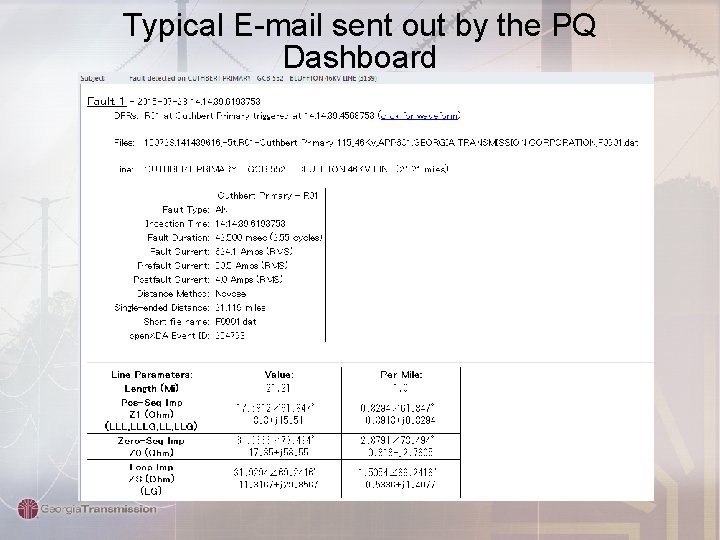
Typical E-mail sent out by the PQ Dashboard
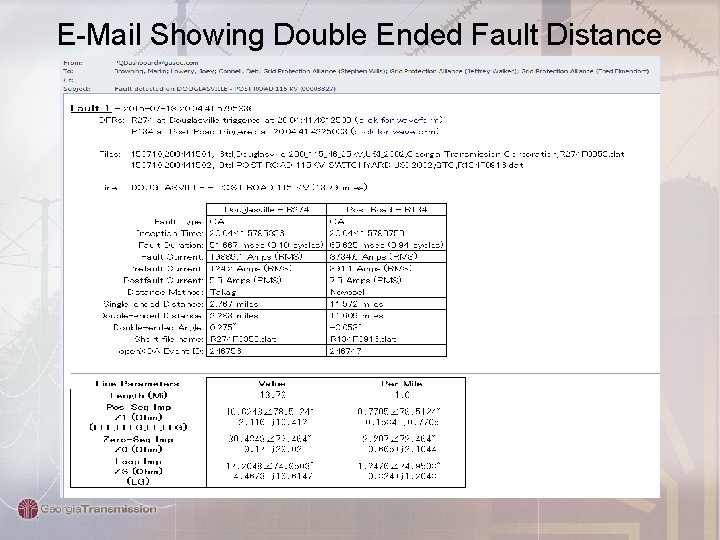
E-Mail Showing Double Ended Fault Distance
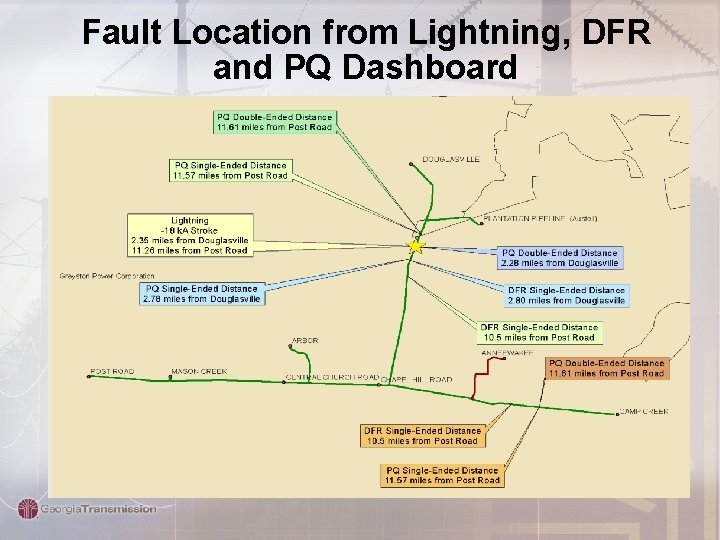
Fault Location from Lightning, DFR and PQ Dashboard
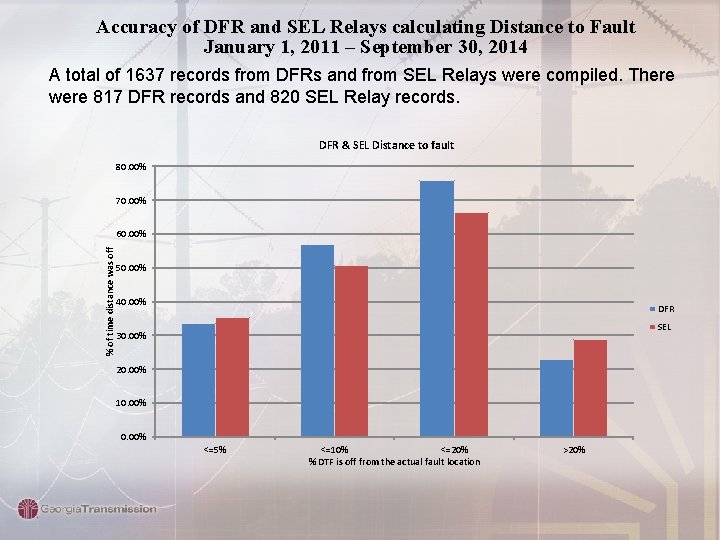
Accuracy of DFR and SEL Relays calculating Distance to Fault January 1, 2011 – September 30, 2014 A total of 1637 records from DFRs and from SEL Relays were compiled. There were 817 DFR records and 820 SEL Relay records. DFR & SEL Distance to fault 80. 00% 70. 00% % of time distance was off 60. 00% 50. 00% 40. 00% DFR SEL 30. 00% 20. 00% 10. 00% <=5% <=10% <=20% % DTF is off from the actual fault location >20%
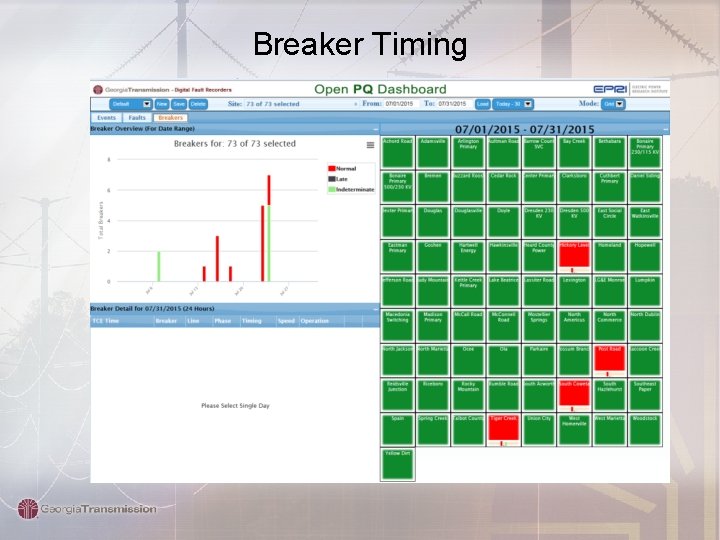
Breaker Timing
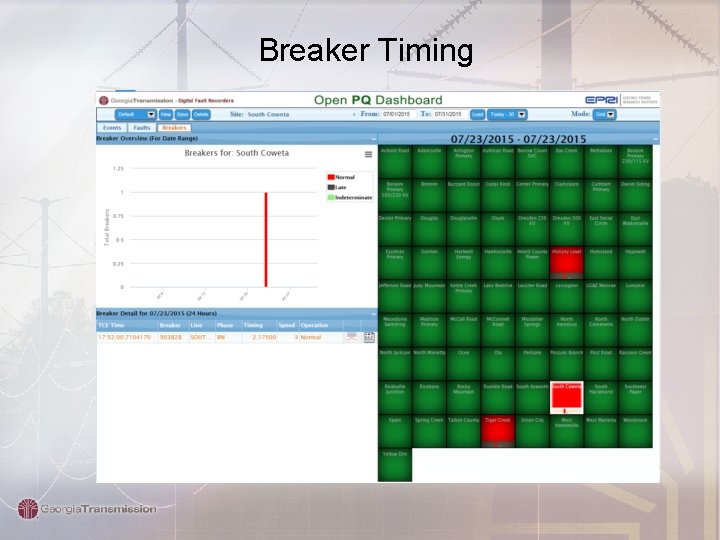
Breaker Timing
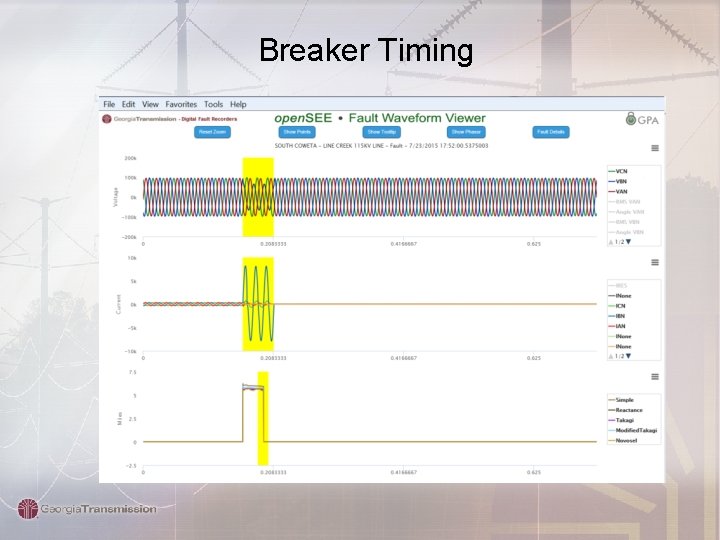
Breaker Timing
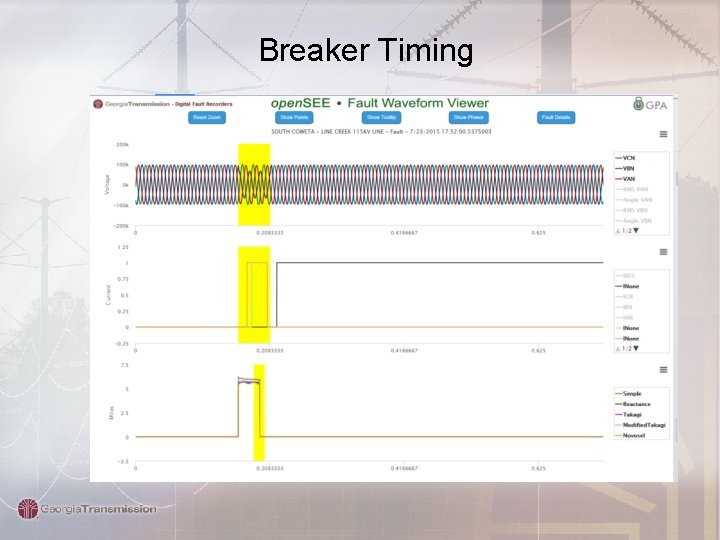
Breaker Timing
Things we had to do to apply the PQ Dashboard 1. Worked with USI and APP to modify the line files. Added the breaker number in order to link to MAXIMO. 2. Cleaned up line file numbers in the DFRs to match the STOMP data base. Lots of files were brought up to date. 3. Added non-line breakers to the DFR line files for breaker timing. 4. Large data clean up effort with the MAXIMO data. Added breaker operate time to data base. 5. Created a database with thermal line rating for each line.
2016 and Beyond 1. Geographic enhancements and reporting (GIS) - Show T/L with fault location, lightning location, and other information 2. Event correlation with lightning 3. Incorporate Fault Indicator data 4. Add GTC Power Quality meters to the dashboard 5. Additional breaker analytics and reporting 6. Add functions to the PQ Dashboard such as Event Reclassification and Tagging 7. Identification and reporting of out of service DFRs and Power Quality meters
- Slides: 22