AAD 7 3 Performance Analysis with JMeter June

- Slides: 14

AAD 7. 3 Performance Analysis with JMeter June 2014

Contents § Acceptance Criteria § Configuration § Method and Tools § End-User Transactions § Results for Login Page § Results for Home Page § Memory Footprint § Memory Consumption 1

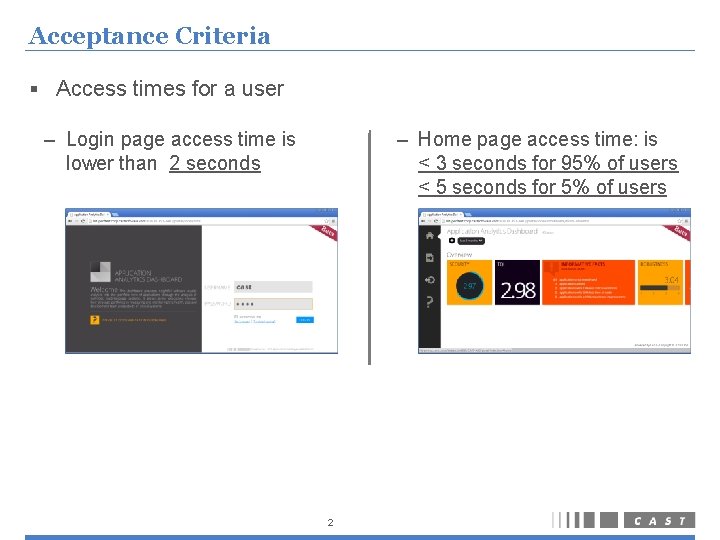
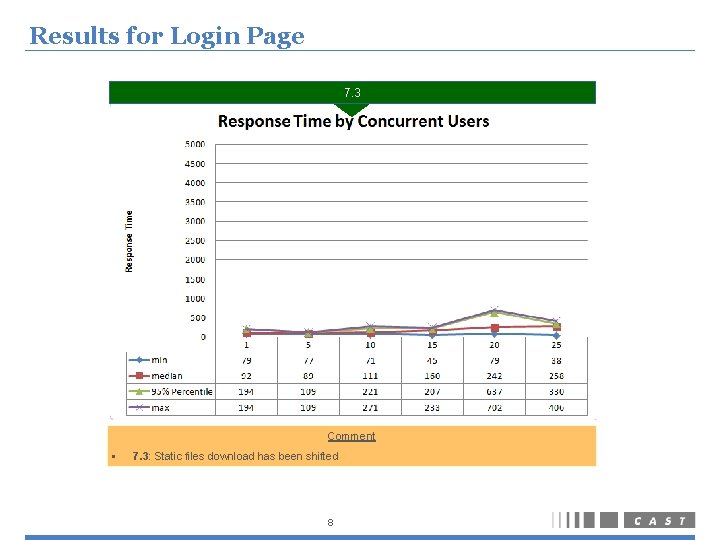
Acceptance Criteria § Access times for a user – Login page access time is lower than 2 seconds – Home page access time: is < 3 seconds for 95% of users < 5 seconds for 5% of users 2

Acceptance Criteria (Cont’d) § Measure the most realistic worst case – Measure response of time of « new users » • Navigators of these users request all server resources, because there is not yet any resource loaded in cache navigator – Concurrent users • All concurrent users connect to the application in a ramp-up period of 0 second Scope Outside the scope – Server side processing • Static Files accesses • REST Services processing – Client side processing: Java. Script processing on tablet, smartphone, laptop – Network with latency (Wide Area Network) 3

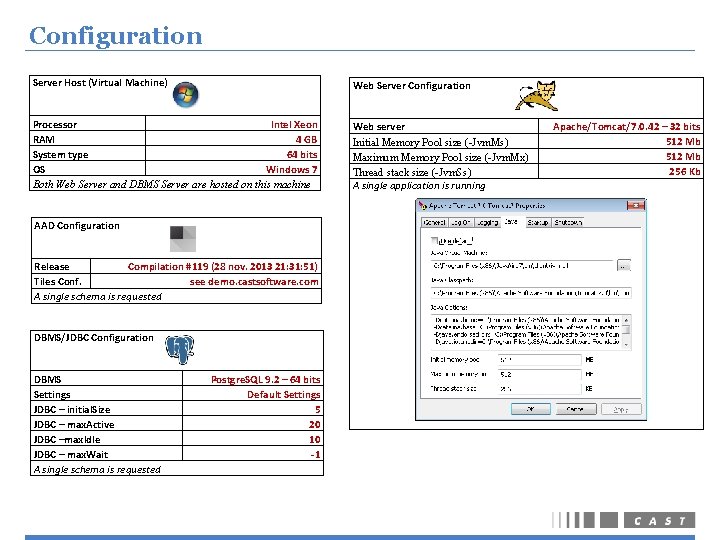
Configuration Server Host (Virtual Machine) Web Server Configuration Processor Intel Xeon RAM 4 GB System type 64 bits OS Windows 7 Both Web Server and DBMS Server are hosted on this machine Web server Initial Memory Pool size (-Jvm. Ms) Maximum Memory Pool size (-Jvm. Mx) Thread stack size (-Jvm. Ss) A single application is running AAD Configuration Release Compilation #119 (28 nov. 2013 21: 31: 51) Tiles Conf. see demo. castsoftware. com A single schema is requested DBMS/JDBC Configuration DBMS Settings JDBC – initial. Size JDBC – max. Active JDBC –max. Idle JDBC – max. Wait A single schema is requested Postgre. SQL 9. 2 – 64 bits Default Settings 5 20 10 -1 Apache/Tomcat/7. 0. 42 – 32 bits 512 Mb 256 Kb

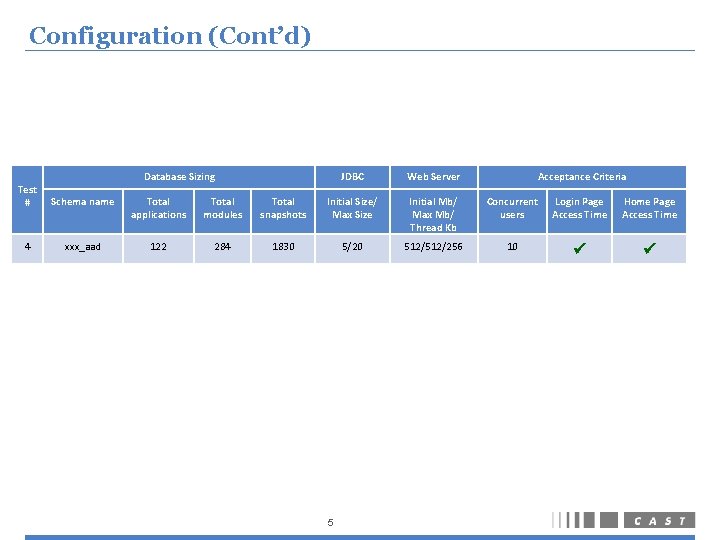
Configuration (Cont’d) Database Sizing JDBC Web Server Acceptance Criteria Test # Schema name Total applications Total modules Total snapshots Initial Size/ Max Size Initial Mb/ Max Mb/ Thread Kb Concurrent users Login Page Access Time Home Page Access Time 4 xxx_aad 122 284 1830 5/20 512/256 10 5

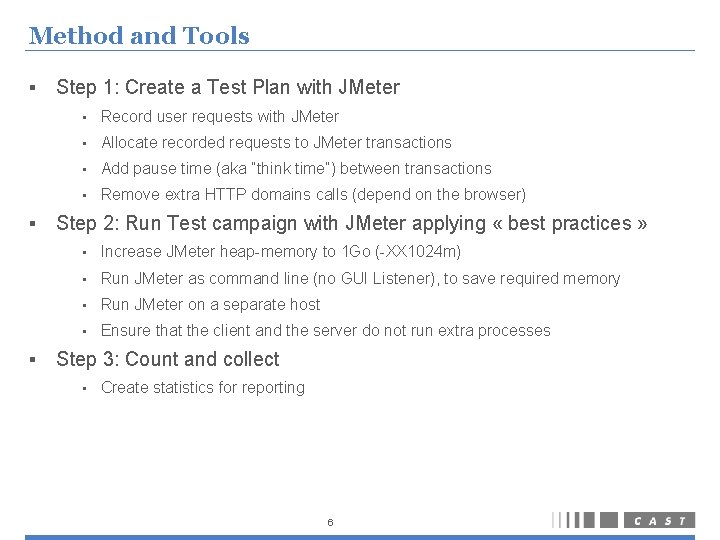
Method and Tools § § § Step 1: Create a Test Plan with JMeter • Record user requests with JMeter • Allocate recorded requests to JMeter transactions • Add pause time (aka “think time”) between transactions • Remove extra HTTP domains calls (depend on the browser) Step 2: Run Test campaign with JMeter applying « best practices » • Increase JMeter heap-memory to 1 Go (-XX 1024 m) • Run JMeter as command line (no GUI Listener), to save required memory • Run JMeter on a separate host • Ensure that the client and the server do not run extra processes Step 3: Count and collect • Create statistics for reporting 6

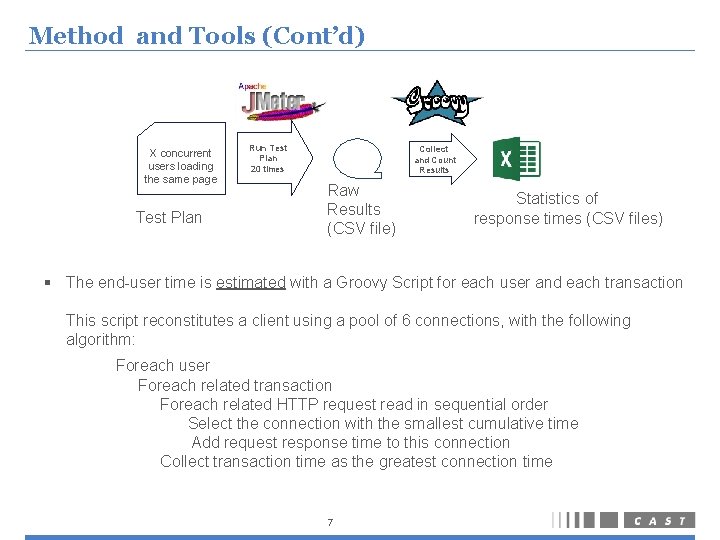
Method and Tools (Cont’d) X concurrent users loading the same page Test Plan Run Test Plan 20 times Collect and Count Results Raw Results (CSV file) Statistics of response times (CSV files) § The end-user time is estimated with a Groovy Script for each user and each transaction This script reconstitutes a client using a pool of 6 connections, with the following algorithm: Foreach user Foreach related transaction Foreach related HTTP request read in sequential order Select the connection with the smallest cumulative time Add request response time to this connection Collect transaction time as the greatest connection time 7

Results for Login Page 7. 3 Comment § 7. 3: Static files download has been shifted 8

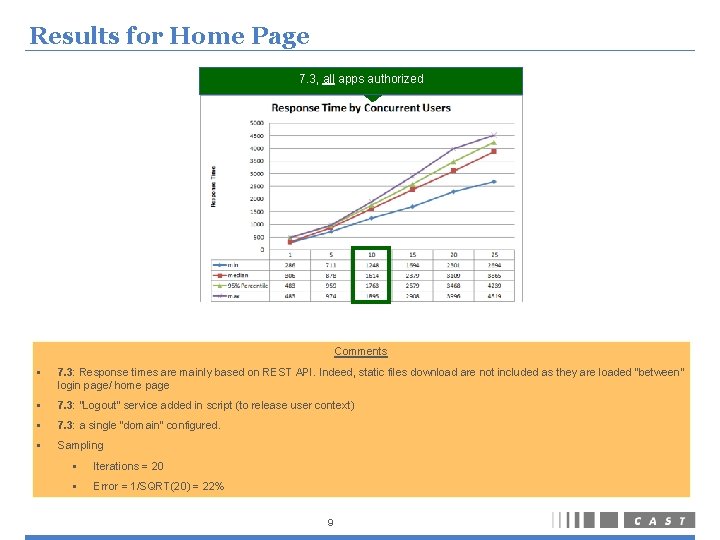
Results for Home Page 7. 3, all apps authorized Comments § 7. 3: Response times are mainly based on REST API. Indeed, static files download are not included as they are loaded “between” login page/ home page § 7. 3: “Logout” service added in script (to release user context) § 7. 3: a single “domain” configured. § Sampling § Iterations = 20 § Error = 1/SQRT(20) = 22% 9

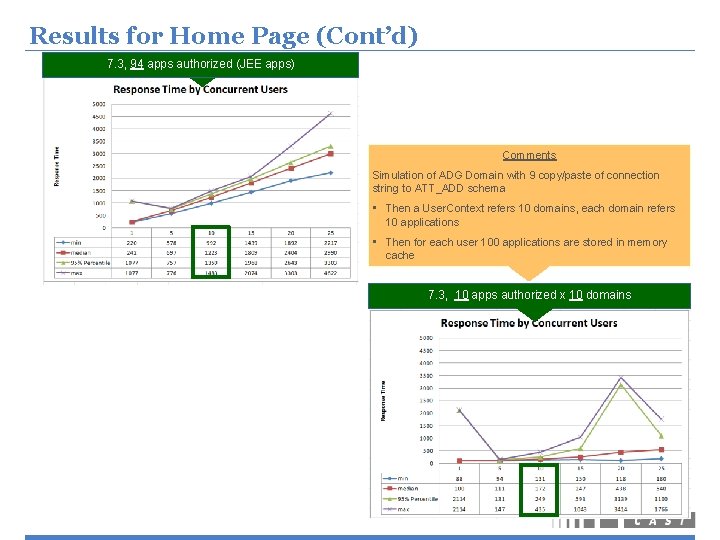
Results for Home Page (Cont’d) 7. 3, 94 apps authorized (JEE apps) Comments Simulation of ADG Domain with 9 copy/paste of connection string to ATT_ADD schema • Then a User. Context refers 10 domains, each domain refers 10 applications • Then for each user 100 applications are stored in memory cache 7. 3, 10 apps authorized x 10 domains

Results for Home Page (Cont’d) 11

Memory Footprint (94 apps authorized) Before Run After Run 12

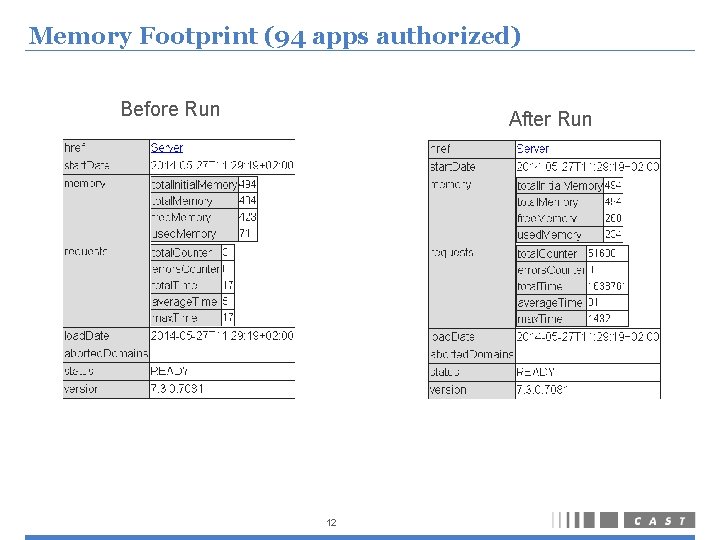
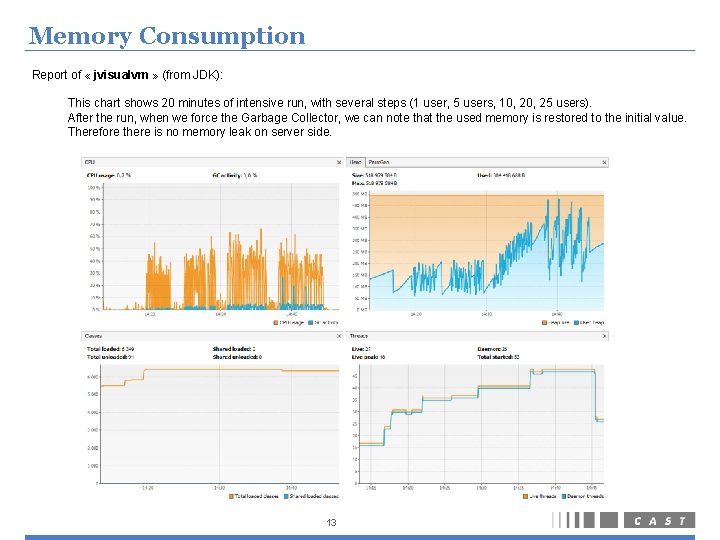
Memory Consumption Report of « jvisualvm » (from JDK): This chart shows 20 minutes of intensive run, with several steps (1 user, 5 users, 10, 25 users). After the run, when we force the Garbage Collector, we can note that the used memory is restored to the initial value. Therefore there is no memory leak on server side. 13