A SYSTEM DYNAMICS APPROACH TO DATA CENTER CAPACITY


 � Distributed-services users (DS) 16")


- Slides: 52
A SYSTEM DYNAMICS APPROACH TO DATA CENTER CAPACITY PLANNING: A CASE STUDY Thesis by: Kaveh Dianati Supervisor: Pål Davidsen Summer 2012
AGENDA Introduction Problem Definition Model Structure Model Analysis and Validation Policy and Scenario Analysis Conclusions & Areas for Future Improvement 2
INTRODUCTION 3
INTRODUCTION Subject: System Dynamics modeling project for a Norwegian cloud computing company. Cloud computing is the provisioning of centralized IT services and infrastructure, such as processing or storage capacity, to businesses in a flexible, reliable, and inexpensive fashion. Two-fold purpose of this thesis: � Help the client in medium-term capacity planning � Establish the usefulness of the System Dynamics methodology in data center planning and cloud computing business fields. Model was built in close client interaction with the CTO of the company. 4
PROBLEM DEFINITION 5
PROBLEM DEFINITION Design a tool to estimate when the limit of the company’s main data center, in terms of power capacity, would be reached. Main consumers of power: Physical servers We need to model the development of servers. 6
REFERENCE MODE OF BEHAVIOUR 7
MODEL STRUCTURE 8
MODEL BASE: AGING CHAINS AND CO-FLOWS 9
MODEL STRUCTURE PHYSICAL SERVERS Acquisition, Inventory, Installation. 10
MODEL STRUCTURE PHYSICAL SERVERS Disengagement of physical servers 11
MODEL STRUCTURE CO-FLOWS OF HOSTS AND STAND-ALONES Physical servers are two types: - Stand-alones - Hosts 12
MODEL STRUCTURE VIRTUAL SERVERS 13
MODEL STRUCTURE CPUS AND CORES 14
MODEL STRUCTURE POWER DEMAND 15
MODEL STRUCTURE USERS User types: � Full-desktop users (FD) � Distributed-services users (DS) 16
MODEL STRUCTURE USER PROCESSOR REQUIREMENTS 17
MODEL STRUCTURE REVENUES 18
MODEL STRUCTURE DATA CENTER 19
MODEL STRUCTURE ACCOUNTING 20
MODEL STRUCTURE FINANCE 21
MODEL STRUCTURE FINANCE 22
MODEL ANALYSIS AND VALIDATION 23
PARTIAL MODEL TESTING Partial model testing: validating the structure of the model part by part Validating each part by simulating with all other parts driven by data 24
VALIDATION OF PHYSICAL SERVER INSTALLATION 25
VALIDATION OF PHYSICAL SERVER INSTALLATION 26
VALIDATION OF PHYSICAL SERVER INSTALLATION 27
CLD FORINVENTORY OSCILLATIONS
REFERENCE MODE COMPARISON TESTS Comparing the simulated behavior of the whole model with actual time-series data 29
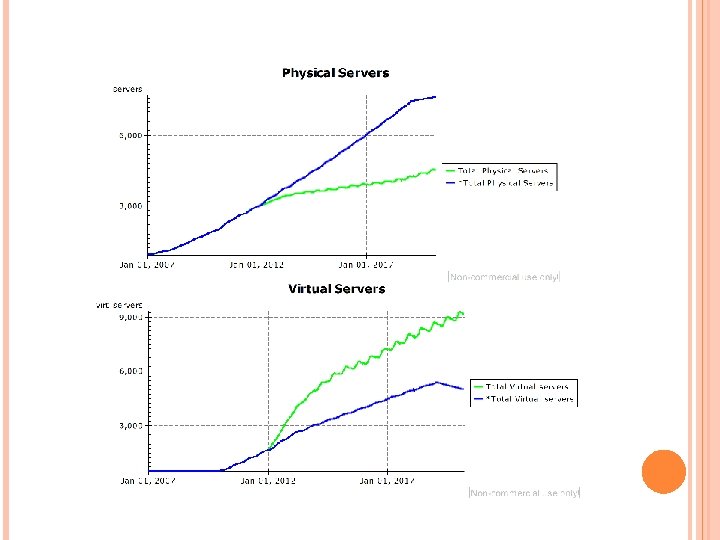
SIMULATION VS. DATA TOTAL PHYSICAL SERVERS RMSE divided by run average = 2. 9% correlation coefficient = 0. 998 30
SIMULATION VS. DATA HOSTS • • RMSE divided by run average = 17. 7% correlation coefficient = 0. 991 31
SIMULATION VS. DATA VIRTUAL SERVERS • • RMSE divided by run average = 4. 4% correlation coefficient = 0. 997 32
SIMULATION VS. DATA TOTAL LOGICAL SERVERS 33
SIMULATION VS. DATA LOGICAL SERVERS PER PHYSICAL SERVER 34
SIMULATION VS. DATA USERS PER LOGICAL SERVER 35
SIMULATION VS. DATA TOTAL CPUS 36
SIMULATION VS. DATA TOTAL VIRTUAL CORES 37
SIMULATION VS. DATA CORES PER PHYSICAL SERVER 38
SIMULATION VS. DATA POWER DEMAND 39
SIMULATION VS. DATA AVERAGE POWER DEMAND OF PHYSICAL SERVERS 40
POLICY AND SCENARIO ANALYSIS 41
INTO THE FUTURE – BUSINESS AS USUAL User Growth: 5. 9% per year Share of Distributed Services Users in New Users: 50% Ø Power limit reached in: 2019 42
INTO THE FUTURE – HIGHER GROWTH User Growth rate: 9% per year Ø Power limit reached in: 2017 43
SENSITIVITY OF DATA CENTER POWER RUNOUT TIME TO FUTURE GROWTH RATE Future Growth: Normal distribution Expected value: 5. 9% per year Standard deviation: 3% per year 44
SENSITIVITY OF DATA CENTER POWER RUN-OUT TIME TO PROCESSOR REQUIREMENTS OF NEW FD USERS Users per logical server for new FD users: Normal distribution Expected Value: 1. 6 [user/server] Standard deviation: 1 [user/server] 45
Sensitivity of Data Center Power Run-out Time to Future Share of DS Users in New contracts Future share of distributed –services users in new users: Normal distribution Expected value: 60% Standard deviation: 30% 46
LIKELY FUTURE SCENARIO: COUNTER-INTUITIVE RESULT Growth: 10% All new servers installed as hosts. Each server hosts 4 virtual servers. 47
CONCLUSION AND AREAS FOR IMPROVEMENT 49
CONCLUSION The main research question: to estimate the time at which the data center would run out of power capacity, under different policies and environmental outcomes. We observed that the answer is sensitive to several parameters: � future growth, � future market policy, � future desired level of customer service. This thesis demonstrates the usefulness of the System Dynamics methodology in policymaking for data centers. 50
AREAS FOR IMPROVEMENT The concept of capacity of hosts in terms of number of virtual machines supported is not modeled. RAM sector not calibrated server installations dependent only on processor requirements of users. Storage spindles are not fully characterized. I/O capacity of spindles for instance is not modeled. Market sector is preliminary: flow of clients not modeled, types of clients not included, etc. The data center sector can be modeled with much more detail: space, racks, rack density, etc. Accounting & Finance and HR sector are quite crude. User interface can be developed.
Thank you for your attention.