
A STRATEGY FOR PERFORMANCE EXCELLENCE 2000 Quality Tool



- Slides: 32
A STRATEGY FOR PERFORMANCE EXCELLENCE 2000, Quality. Tool. Box. com, LLC, all rights reserved 1
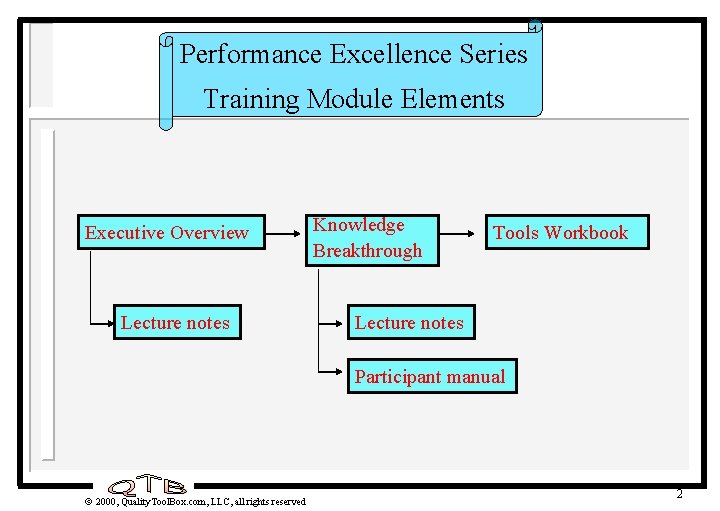
Performance Excellence Series Training Module Elements Executive Overview Lecture notes Knowledge Breakthrough Tools Workbook Lecture notes Participant manual 2000, Quality. Tool. Box. com, LLC, all rights reserved 2
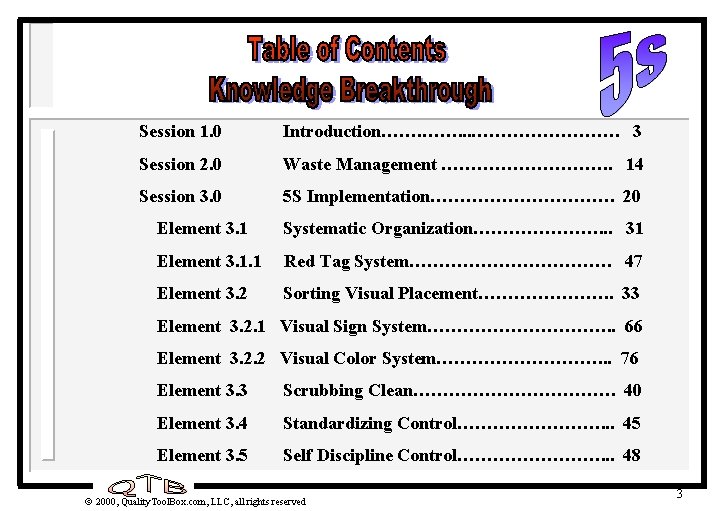
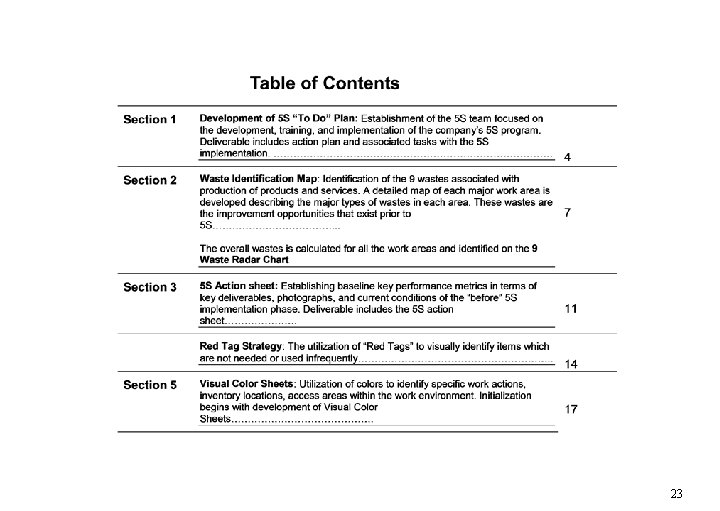
Session 1. 0 Introduction……. . . …………. 3 Session 2. 0 Waste Management ……………. . 14 Session 3. 0 5 S Implementation……………. 20 Element 3. 1 Systematic Organization…………………. . . 31 Element 3. 1. 1 Red Tag System………………. 47 Element 3. 2 Sorting Visual Placement…………………. . 33 Element 3. 2. 1 Visual Sign System……………. . 66 Element 3. 2. 2 Visual Color System……………. . . 76 Element 3. 3 Scrubbing Clean………………. 40 Element 3. 4 Standardizing Control…………. . . 45 Element 3. 5 Self Discipline Control…………. . . 48 2000, Quality. Tool. Box. com, LLC, all rights reserved 3
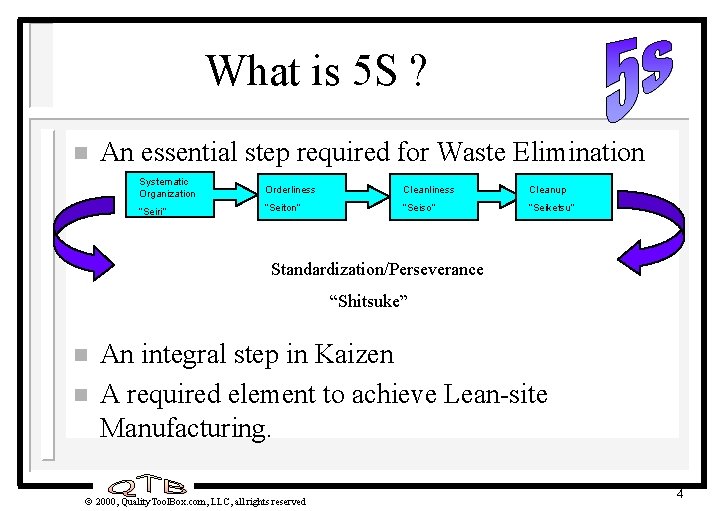
What is 5 S ? n An essential step required for Waste Elimination Systematic Organization Orderliness Cleanup “Seiri” “Seiton” “Seiso” “Seiketsu” Standardization/Perseverance “Shitsuke” n n An integral step in Kaizen A required element to achieve Lean-site Manufacturing. 2000, Quality. Tool. Box. com, LLC, all rights reserved 4
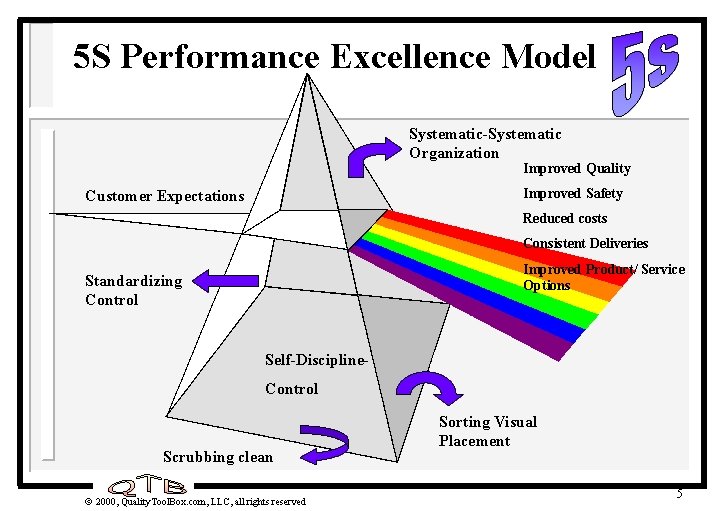
5 S Performance Excellence Model Systematic-Systematic Organization Improved Quality Improved Safety Customer Expectations Reduced costs Consistent Deliveries Improved Product/ Service Options Standardizing Control Self-Discipline. Control Scrubbing clean 2000, Quality. Tool. Box. com, LLC, all rights reserved Sorting Visual Placement 5
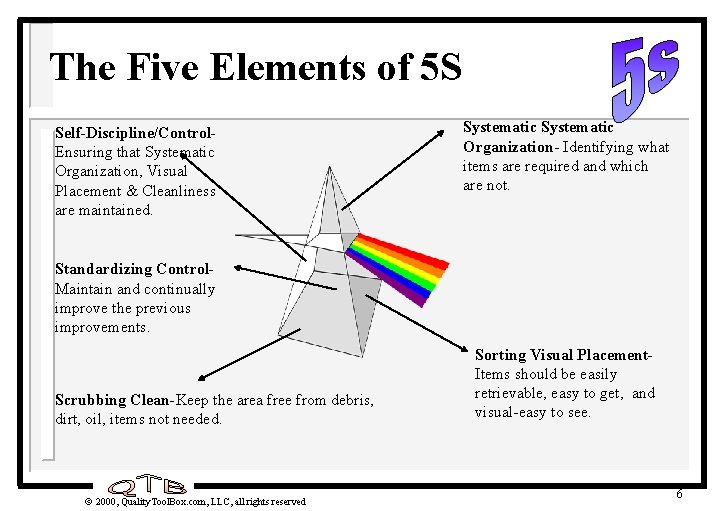
The Five Elements of 5 S Self-Discipline/Control. Ensuring that Systematic Organization, Visual Placement & Cleanliness are maintained. Systematic Organization- Identifying what items are required and which are not. Standardizing Control. Maintain and continually improve the previous improvements. Scrubbing Clean-Keep the area free from debris, dirt, oil, items not needed. 2000, Quality. Tool. Box. com, LLC, all rights reserved Sorting Visual Placement. Items should be easily retrievable, easy to get, and visual-easy to see. 6
Tool Kit Comparison Major Tools CPI (6 s) Kaizen Lean Cp/Cpk 4 DOE 4 SPC 4 FMEA 4 Regression 4 Process Map 4 4 5 whys /2 hows 4 methods for root cause discovery Pareto 4 4 Fishbone 4 5 S 4 Visual Mgmt 4 Poka-Yoke Spagetti Chart 4 Kanban Takt Time 4 Std Work 4 SMED 4 TPM Cellular Flow 4 4 4 4 Description Process capability assessment Design of experiments Process control based on statistics and data analysis Risk assessment tool Correlate effect one variable has on another Map process steps to communicate and identify opportunities 4 4 Determination Column chart ranking items highest to lowest 4 Cause / Effect Diagram Elimination waste 4 Emphasis on visual techniques to manage process 4 Error proofing techniques 4 Material storage technique used to control process Determine pace or beat of a process Evaluate tasks done during a process Single minute exchange of dies - Quick machine set up Integrate maintenance strategy with process Reduce inventory & cycle time thru process layout and pull production techniques Expand Process Improvement Program to Utilize Kaizen Tool Kit 2000, Quality. Tool. Box. com, LLC, all rights reserved 7
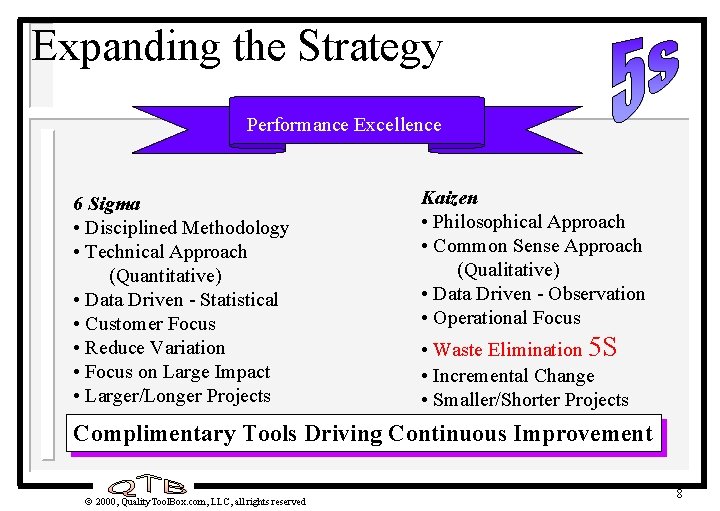
Expanding the Strategy Performance Excellence 6 Sigma • Disciplined Methodology • Technical Approach (Quantitative) • Data Driven - Statistical • Customer Focus • Reduce Variation • Focus on Large Impact • Larger/Longer Projects Kaizen • Philosophical Approach • Common Sense Approach (Qualitative) • Data Driven - Observation • Operational Focus • Waste Elimination 5 S • Incremental Change • Smaller/Shorter Projects Complimentary Tools Driving Continuous Improvement 2000, Quality. Tool. Box. com, LLC, all rights reserved 8
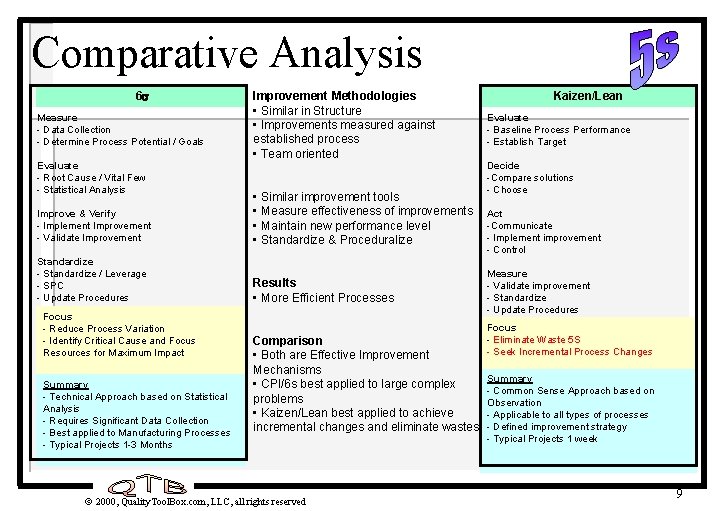
Comparative Analysis 6 s Measure - Data Collection - Determine Process Potential / Goals Evaluate - Root Cause / Vital Few - Statistical Analysis Improvement Methodologies • Similar in Structure • Improvements measured against established process • Team oriented Improve & Verify - Implement Improvement - Validate Improvement • Similar improvement tools • Measure effectiveness of improvements • Maintain new performance level • Standardize & Proceduralize Standardize - Standardize / Leverage - SPC - Update Procedures Results • More Efficient Processes Focus - Reduce Process Variation - Identify Critical Cause and Focus Resources for Maximum Impact Summary - Technical Approach based on Statistical Analysis - Requires Significant Data Collection - Best applied to Manufacturing Processes - Typical Projects 1 -3 Months Comparison • Both are Effective Improvement Mechanisms • CPI/6 s best applied to large complex problems • Kaizen/Lean best applied to achieve incremental changes and eliminate wastes. 2000, Quality. Tool. Box. com, LLC, all rights reserved Kaizen/Lean Evaluate - Baseline Process Performance - Establish Target Decide -Compare solutions - Choose Act -Communicate - Implement improvement - Control Measure - Validate improvement - Standardize - Update Procedures Focus - Eliminate Waste 5 S - Seek Incremental Process Changes Summary - Common Sense Approach based on Observation - Applicable to all types of processes - Defined improvement strategy - Typical Projects 1 week 9
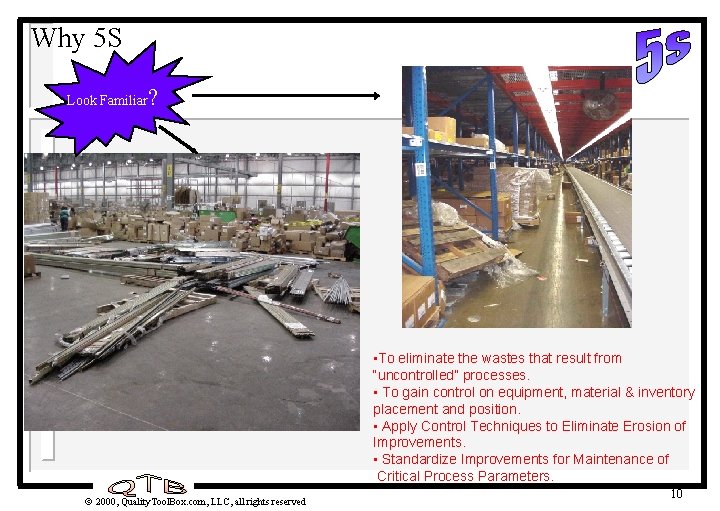
Why 5 S Look Familiar ? • To eliminate the wastes that result from “uncontrolled” processes. • To gain control on equipment, material & inventory placement and position. • Apply Control Techniques to Eliminate Erosion of Improvements. • Standardize Improvements for Maintenance of Critical Process Parameters. 2000, Quality. Tool. Box. com, LLC, all rights reserved 10
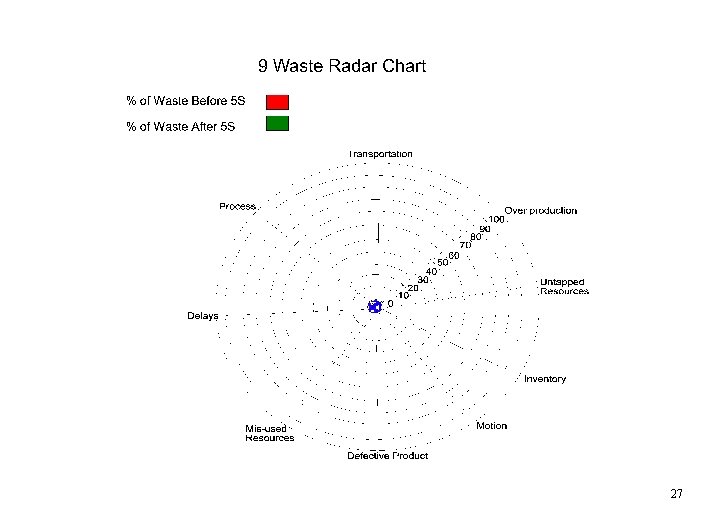
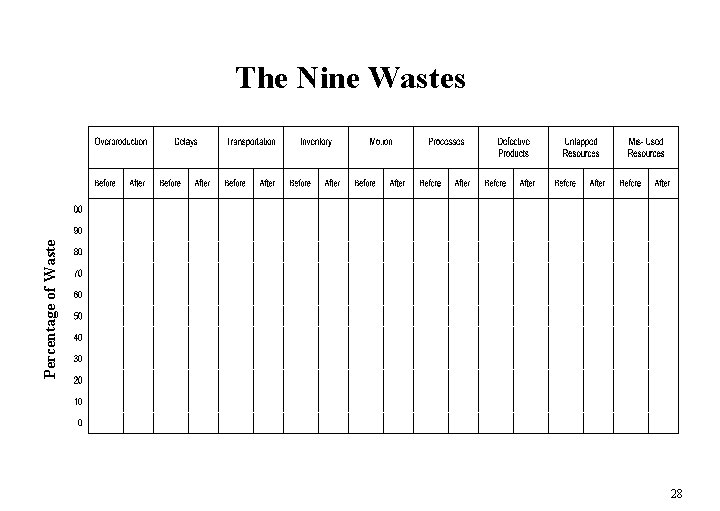
The Nine types of wastes. 9 Wastes n n n n n Overproduction Delays (waiting time) Transportation Process Inventories Motions Defective products Untapped Resources Mis-used Resources 2000, Quality. Tool. Box. com, LLC, all rights reserved 11
Think Break The Nine types of wastes Give an example of each type of waste. n n n n n Overproduction _______________ 9 Delays (waiting time)_____________ Wastes Transportation ________________ Process___________________ Inventories_________________ Motions __________________ Defective products ______________ Untapped Resources _____________ Mis-used Resources ______________ 2000, Quality. Tool. Box. com, LLC, all rights reserved 12
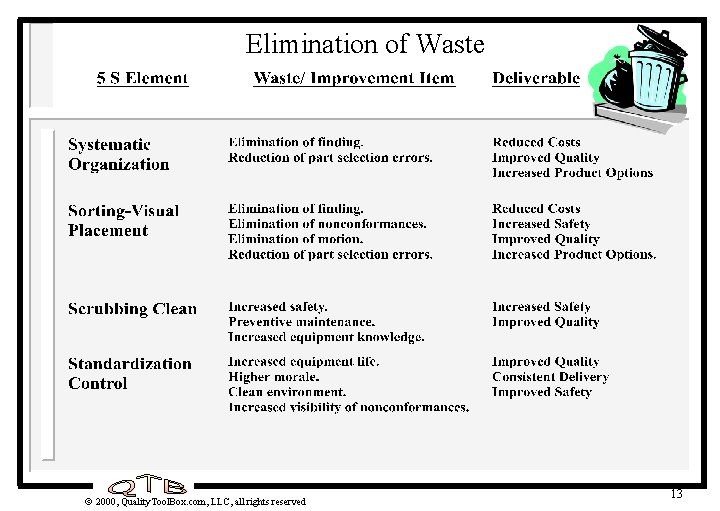
Elimination of Waste 2000, Quality. Tool. Box. com, LLC, all rights reserved 13
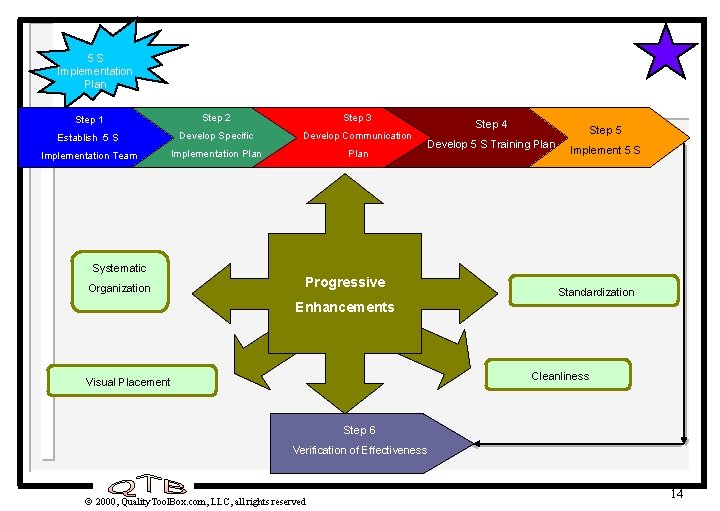
5 S Implementation Plan Step 1 Step 2 Step 3 Establish 5 S Develop Specific Develop Communication Implementation Team Implementation Plan Systematic Organization Progressive Step 4 Step 5 Develop 5 S Training Plan Implement 5 S Standardization Enhancements Cleanliness Visual Placement Step 6 Verification of Effectiveness 2000, Quality. Tool. Box. com, LLC, all rights reserved 14
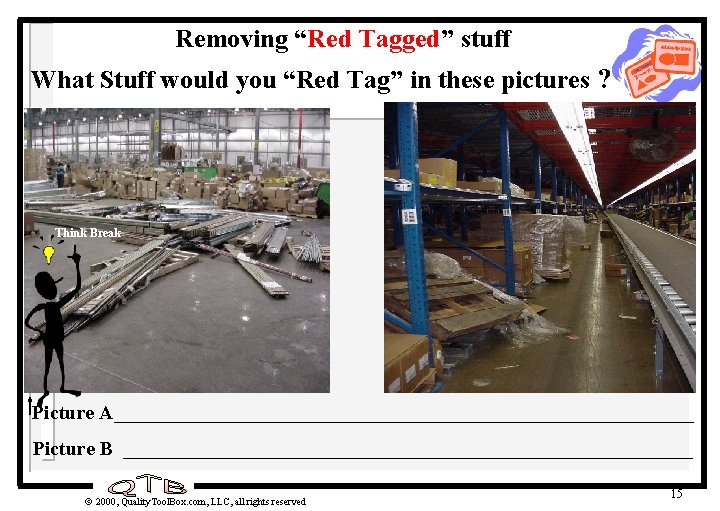
Removing “Red Tagged” stuff What Stuff would you “Red Tag” in these pictures ? Think Break Picture A_____________________________ Picture B _____________________________ 2000, Quality. Tool. Box. com, LLC, all rights reserved 15
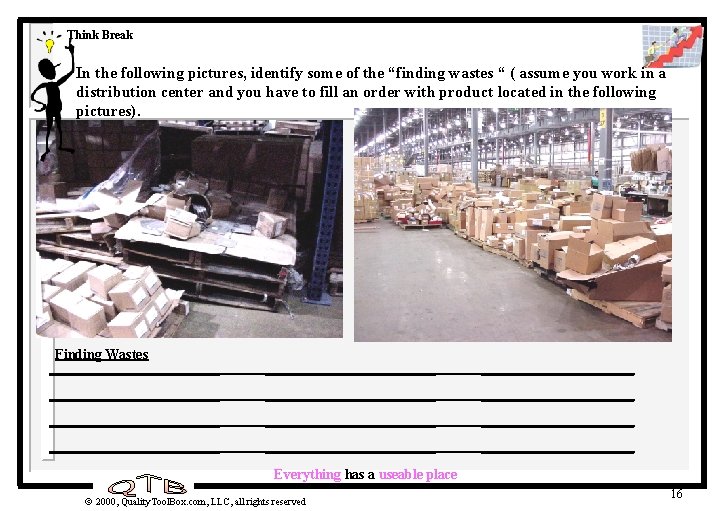
Think Break In the following pictures, identify some of the “finding wastes “ ( assume you work in a distribution center and you have to fill an order with product located in the following pictures). Finding Wastes ___________________ ___________________ _________________ Everything has a useable place 2000, Quality. Tool. Box. com, LLC, all rights reserved 16
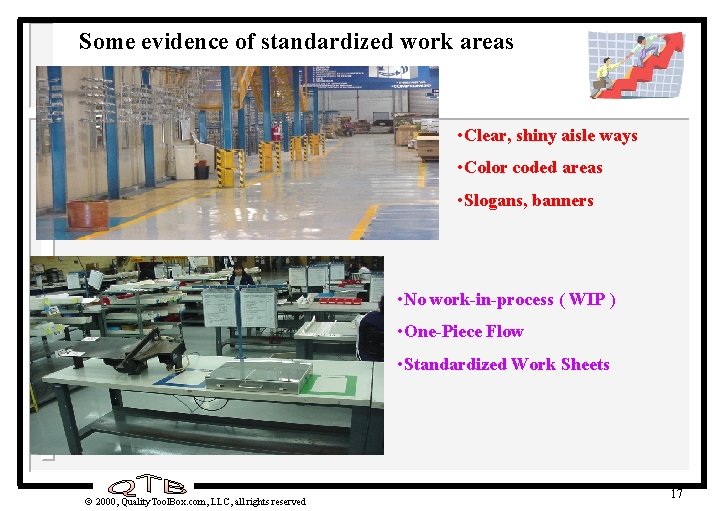
Some evidence of standardized work areas • Clear, shiny aisle ways • Color coded areas • Slogans, banners • No work-in-process ( WIP ) • One-Piece Flow • Standardized Work Sheets 2000, Quality. Tool. Box. com, LLC, all rights reserved 17
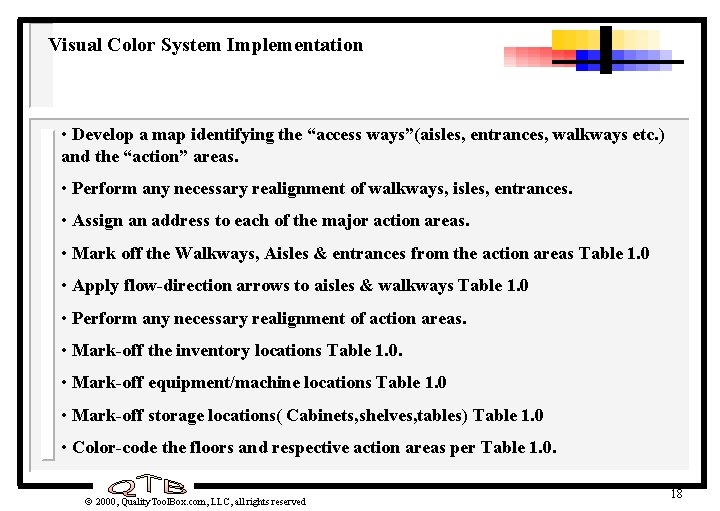
Visual Color System Implementation • Develop a map identifying the “access ways”(aisles, entrances, walkways etc. ) and the “action” areas. • Perform any necessary realignment of walkways, isles, entrances. • Assign an address to each of the major action areas. • Mark off the Walkways, Aisles & entrances from the action areas Table 1. 0 • Apply flow-direction arrows to aisles & walkways Table 1. 0 • Perform any necessary realignment of action areas. • Mark-off the inventory locations Table 1. 0. • Mark-off equipment/machine locations Table 1. 0 • Mark-off storage locations( Cabinets, shelves, tables) Table 1. 0 • Color-code the floors and respective action areas per Table 1. 0. 2000, Quality. Tool. Box. com, LLC, all rights reserved 18
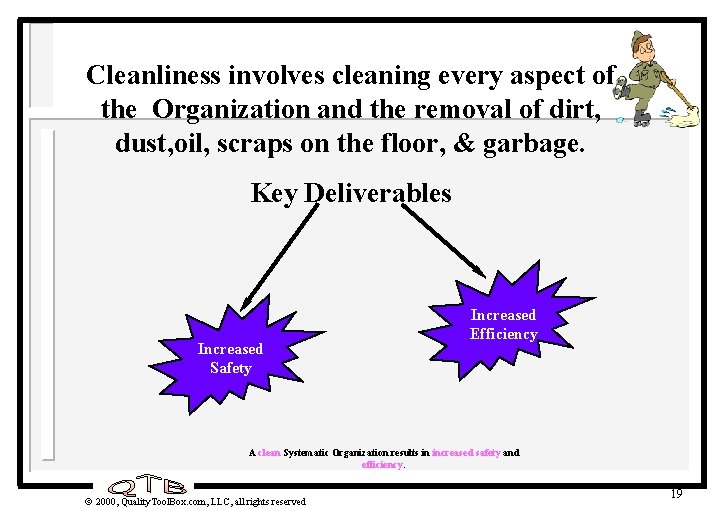
Cleanliness involves cleaning every aspect of the Organization and the removal of dirt, dust, oil, scraps on the floor, & garbage. Key Deliverables Increased Safety Increased Efficiency A clean Systematic Organization results in increased safety and efficiency. 2000, Quality. Tool. Box. com, LLC, all rights reserved 19
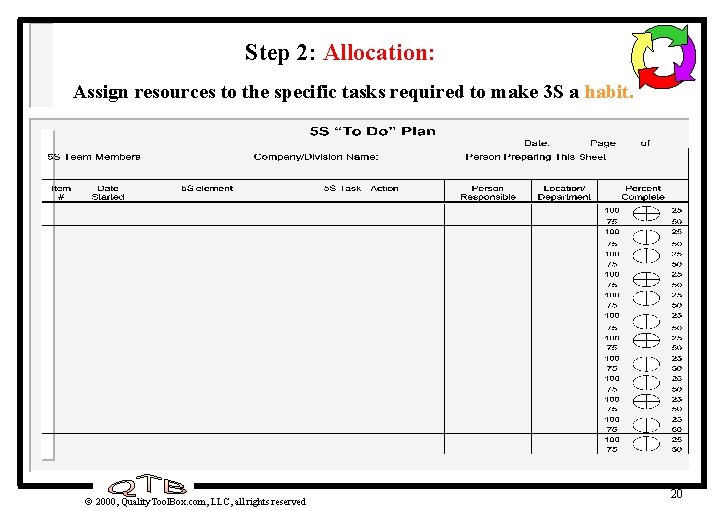
Step 2: Allocation: Assign resources to the specific tasks required to make 3 S a habit. 2000, Quality. Tool. Box. com, LLC, all rights reserved 20
21
22
23
24
25
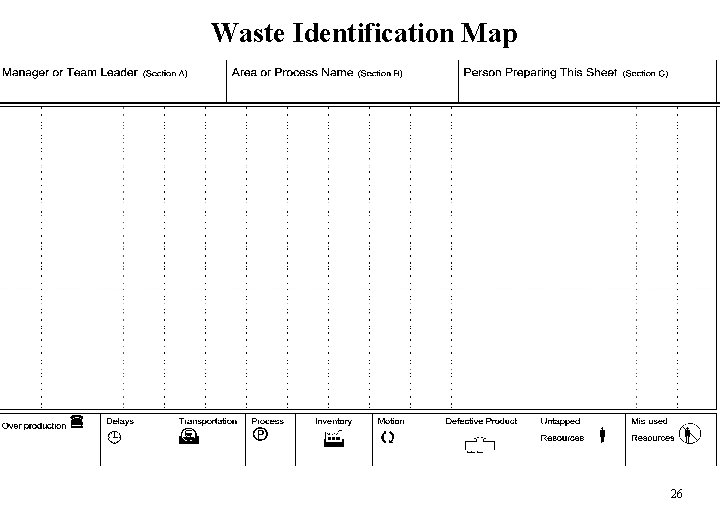
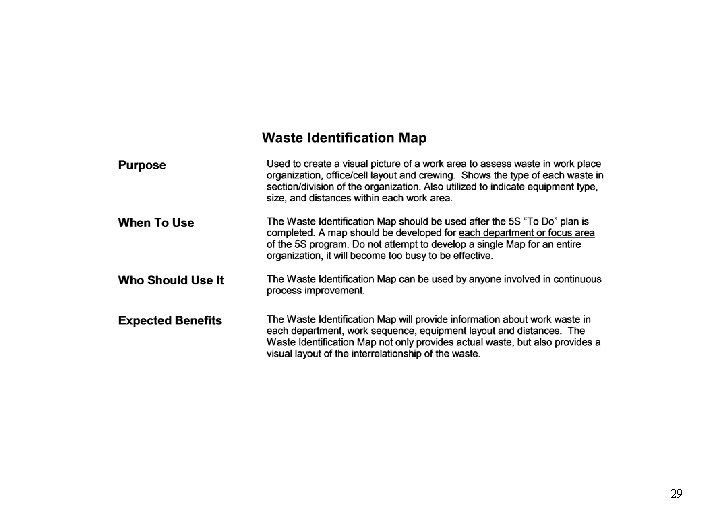
Waste Identification Map 26
27
Percentage of Waste The Nine Wastes 28
29
30
31
32