A stock assessment for eastern Bering Sea snow

A stock assessment for eastern Bering Sea snow crab Cody Szuwalski September 12, 2020

GMACS BYCATCH • • OFL & PROJ UNCERTAINTY Hopefully ready to transition (pending CPT and SSC approval) Good fits Difficulties in comparison Reference points working

GMACS BYCATCH OFL & PROJ • Change in bycatch data downloaded from AKFIN • Revision of method for creating. DAT files (no more one year at a time) • Will not talk further about this; all 2020 models (20. 1, 20. 2, 20. 3) use the updated bycatch data • Deep dive on data next year UNCERTAINTY

GMACS BYCATCH • 2020 OFL from author preferred model is >3 x 2019 • Reaching the peak in MMB driven by the large recruitment in 2015 OFL & PROJ UNCERTAINTY

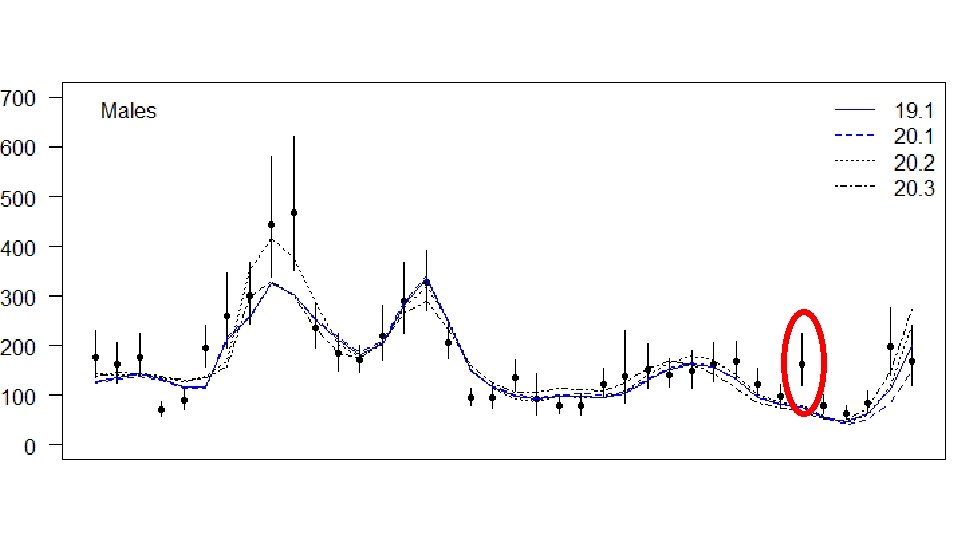
GMACS BYCATCH OFL & PROJ UNCERTAINTY • Discrepancy between 2018 and 2019 survey data • Missed survey: – Imputed survey – Retrospective analyses including and excluding terminal year of survey data • Change in size of estimated recruitment from 2019 to 2020
 What do we do with that")
What model do we choose? (I hope easy) What do we do with that model? (Perhaps less easy)

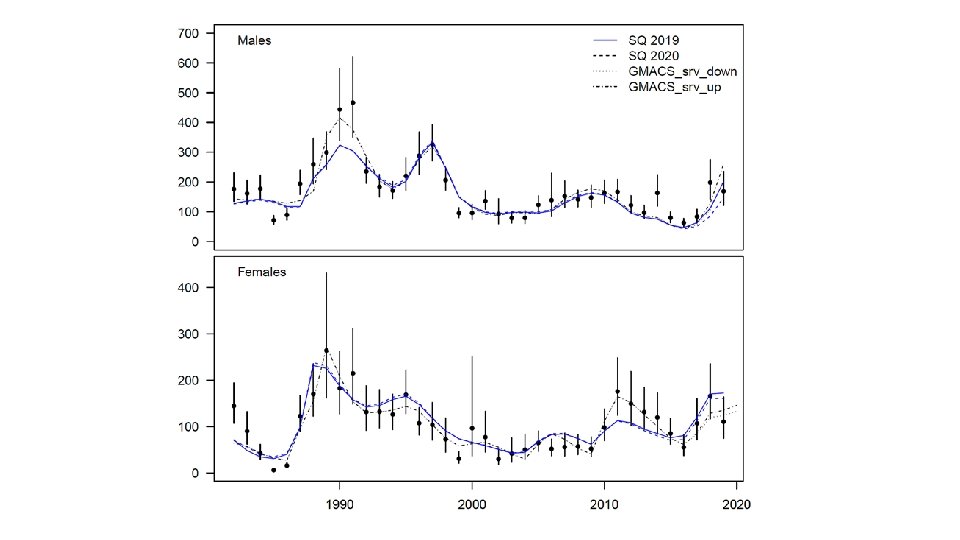
2020 model scenarios • • 19. 1: Status quo fit to 2018/2019 data with updated bycatch 20. 1: 19. 1 fit to 2019/2020 data 20. 2: GMACS fit to the same data as 20. 1 20. 3: 20. 2 + increased weight on 2010 BSFRF data to ‘force’ catchability

Model overview July 1 Survey 7. 5/12 M Directed fishery Non-directed fishery Mating 4. 5/12 M Molting Growth Recruitment 1. Logistic selectivity in 2 ‘eras’ 2. Linked to BSFRF data 3. Size composition and biomass index

Model overview Survey 7. 5/12 M Directed fishery Non-directed fishery Mating 4. 5/12 M Molting Growth Recruitment 1. Mature males, immature for both sexes, mature females 2. Estimated with a prior

Model overview Survey 7. 5/12 M Directed fishery Non-directed fishery Mating 4. 5/12 M Molting Growth Recruitment 1. Logistic selectivity 2. Retention selectivity 3. Discard mortality equal to 30% Fit to: Retained length comps Total length comps Retained biomass Male and female discard biomass

Model overview Survey 7. 5/12 M Directed fishery Non-directed fishery Mating 4. 5/12 M Molting Growth Recruitment 1. Logistic selectivity 2. Discard mortality equal to 80%

Model overview Survey 7. 5/12 M Directed fishery Non-directed fishery Mating 4. 5/12 M Molting Growth Recruitment 1. Freely estimated maturity curves 2. February 15

Model overview Survey 7. 5/12 M Directed fishery Non-directed fishery Mating 4. 5/12 M Molting Growth Recruitment 1. All immature crab assumed to molt 2. Terminal molt to maturity

Model overview Survey 7. 5/12 M Directed fishery Non-directed fishery Mating 4. 5/12 M Molting Growth Recruitment 1. Linear growth in GMACS; kinked growth curve for females in SQ

Key changes in model structure in GMACS • Fishing mortality – Definitions of ‘total mortality’ and how female mortality is treated are different between models • Growth – Both sexes linear in GMACS – Male linear, female kinked in SQ • BSFRF availability – All year/sex combinations of BSFRF data have a freely estimated availability curve in GMACS (not so in status quo model) • Recruitment – GMACS estimates a yearly recruitment and a parameter that divides that recruitment between sexes – SQ estimates separate recruitment deviations for both sexes with smoothing penalties on devs

Model MMB B 35 FOFL 19. 1 109. 56 123. 71 1. 80 54. 05 20. 1 144. 29 120. 51 1. 60 95. 40 20. 2 207. 19 113. 66 1. 65 184. 91 20. 3 517. 13 183. 95 2. 61 448. 38

Difficulties in model comparison • GMACS and status quo likelihoods are not comparable • How to compare models? – Visual fits – Mean relative absolute error (survey and catch) • Mean(abs(obs-pred)/obs) – Mean absolute error (size comps) • Mean(abs(obs-pred))

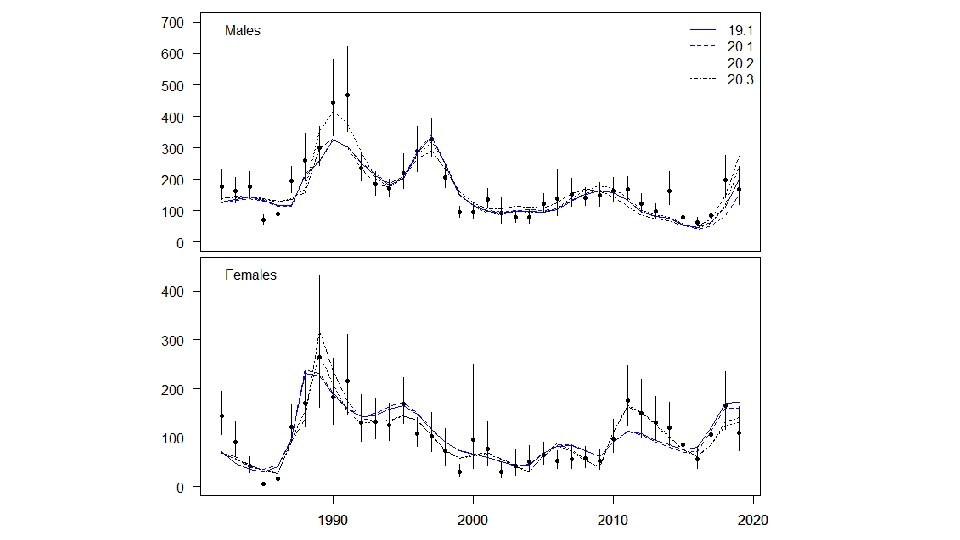
Fits to data Data source Survey biomass Growth Catch Retained size comp Total size comp Bycatch size comp BSFRF size comp Survey size comp (imm M) Survey size comp (imm F) Survey size comp (mat M) Survey size comp (mat F) 20. 1 20. 2 20. 3 X

Fits to data Data source 20. 1 20. 2 20. 3 Survey biomass X Growth X Catch Retained size comp Total size comp Bycatch size comp BSFRF size comp Survey size comp (imm M) Survey size comp (imm F) Survey size comp (mat M) Survey size comp (mat F) X

Fits to data Data source 20. 1 20. 2 20. 3 Survey biomass X Growth X X Catch X X Retained size comp Total size comp Bycatch size comp BSFRF size comp Survey size comp (imm M) Survey size comp (imm F) Survey size comp (mat M) Survey size comp (mat F)

Fits to data Data source 20. 1 20. 2 20. 3 Survey biomass X Growth X X Catch X X Retained size comp Total size comp Bycatch size comp BSFRF size comp Survey size comp (imm M) Survey size comp (imm F) Survey size comp (mat M) Survey size comp (mat F) X

Fits to data Data source 20. 1 20. 2 20. 3 Survey biomass X Growth X X Catch X X ~ ~ Retained size comp X Total size comp ~ Bycatch size comp BSFRF size comp Survey size comp (imm M) Survey size comp (imm F) Survey size comp (mat M) Survey size comp (mat F)

Fits to data Data source 20. 1 20. 2 20. 3 Survey biomass X Growth X X Catch X X Retained size comp X Total size comp ~ ~ ~ Bycatch size comp ~ ~ ~ BSFRF size comp Survey size comp (imm M) Survey size comp (imm F) Survey size comp (mat M) Survey size comp (mat F)

Fits to data Data source 20. 1 20. 2 20. 3 Survey biomass X Growth X X Catch X X Retained size comp X Total size comp ~ ~ ~ Bycatch size comp ~ ~ ~ X X BSFRF size comp Survey size comp (imm M) Survey size comp (imm F) Survey size comp (mat M) Survey size comp (mat F)

Fits to data Data source 20. 1 20. 2 20. 3 Survey biomass X Growth X X Catch X X Retained size comp X Total size comp ~ ~ ~ Bycatch size comp ~ ~ ~ X X ~ ~ BSFRF size comp Survey size comp (imm M) Survey size comp (imm F) Survey size comp (mat M) Survey size comp (mat F) ~

Fits to data Data source 20. 1 20. 2 20. 3 Survey biomass X Growth X X Catch X X Retained size comp X Total size comp ~ ~ ~ Bycatch size comp ~ ~ ~ X X BSFRF size comp Survey size comp (imm M) Survey size comp (imm F) Survey size comp (mat M) Survey size comp (mat F) ~

Fits to data Data source 20. 1 20. 2 20. 3 Survey biomass X Growth X X Catch X X Retained size comp X Total size comp ~ ~ ~ Bycatch size comp ~ ~ ~ X X ~ ~ BSFRF size comp Survey size comp (imm M) ~ Survey size comp (imm F) Survey size comp (mat M) Survey size comp (mat F) ~

Fits to data Data source 20. 1 20. 2 20. 3 Survey biomass X Growth X X Catch X X Retained size comp X Total size comp ~ ~ ~ Bycatch size comp ~ ~ ~ X X BSFRF size comp Survey size comp (imm M) ~ Survey size comp (imm F) Survey size comp (mat M) ~ ~ ~ Survey size comp (mat F) ~ ~ ~

Estimated population processes Population process 20. 1 20. 2 Mature male biomass Survey selectivity Probability of maturing Fishing mortality Recruitment Natural mortality Status X X 20. 3

Estimated population processes Population process 20. 1 20. 2 Mature male biomass X X Survey selectivity ~ ~ 20. 3 ~ Probability of maturing Fishing mortality Recruitment Natural mortality Status • Female q for 20. 2 is the implied q from the BSFRF data, without the extra weight of 20. 3 • Consider difference in functional form for survey selectivity

Estimated population processes Population process 20. 1 20. 2 Mature male biomass X X Survey selectivity ~ ~ Probability of maturing ~ ~ Fishing mortality Recruitment Natural mortality Status 20. 3 ~

Estimated population processes Population process 20. 1 20. 2 Mature male biomass X X Survey selectivity ~ ~ Probability of maturing ~ ~ Fishing mortality Recruitment Natural mortality Status X 20. 3 ~ X

Estimated population processes Population process 20. 1 20. 2 Mature male biomass X X Survey selectivity ~ ~ Probability of maturing ~ ~ Fishing mortality Recruitment ~ 20. 3 ~ X X ~ ~ Natural mortality Status • Survey q influences the scales • Smoothness penalties on status quo devs

Estimated population processes Population process 20. 1 20. 2 Mature male biomass X X Survey selectivity ~ ~ Probability of maturing ~ ~ Fishing mortality Recruitment Natural mortality Status ~ 20. 3 ~ X X ~ ~ X

Estimated population processes Population process 20. 1 20. 2 Mature male biomass X X Survey selectivity ~ ~ Probability of maturing ~ ~ Fishing mortality Recruitment ~ ~ X X ~ ~ X Natural mortality Status 20. 3 ~ ~ ~

• LOWER IS BETTER PREDICTION *this is not ideal because it does not consider the uncertainty in the point estimates

Data source 20. 1 20. 2 20. 3 Survey biomass X Growth X X Catch X X Retained size comp X Total size comp ~ ~ ~ Bycatch size comp ~ ~ ~ X X BSFRF size comp Survey size comp (imm M) ~ Survey size comp (imm F) Survey size comp (mat M) ~ ~ ~ Survey size comp (mat F) ~ ~ ~

• LOWER IS BETTER PREDICTION

Data source 20. 1 20. 2 20. 3 Survey biomass X Growth X X Catch X X Retained size comp X Total size comp ~ ~ ~ Bycatch size comp ~ ~ ~ X X BSFRF size comp Survey size comp (imm M) ~ Survey size comp (imm F) Survey size comp (mat M) ~ ~ ~ Survey size comp (mat F) ~ ~ ~

Rationale for author’s preference for GMACS • Model structure – Fishing mortality – Linear growth – Natural mortality – BSFRF availability • Survey biomass • Fits to the data Data source 20. 1 20. 2 20. 3 Survey biomass X Growth X X Catch X X Retained size comp X Total size comp ~ ~ ~ Bycatch size comp ~ ~ ~ X X BSFRF size comp Survey size comp (imm M) ~ Survey size comp (imm F) Survey size comp (mat M) ~ ~ ~ Survey size comp (mat F) ~ ~ ~

Uncertainty in the OFL • • Mismatch between 2018 and 2019 survey Missed survey Retrospective patterns Increase in estimated recruitment in GMACS from 2019 to 2020
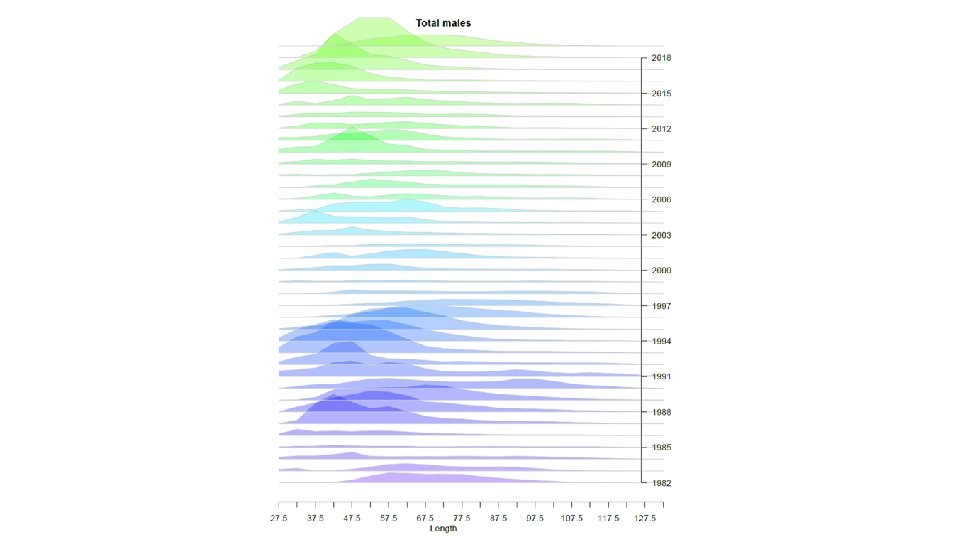
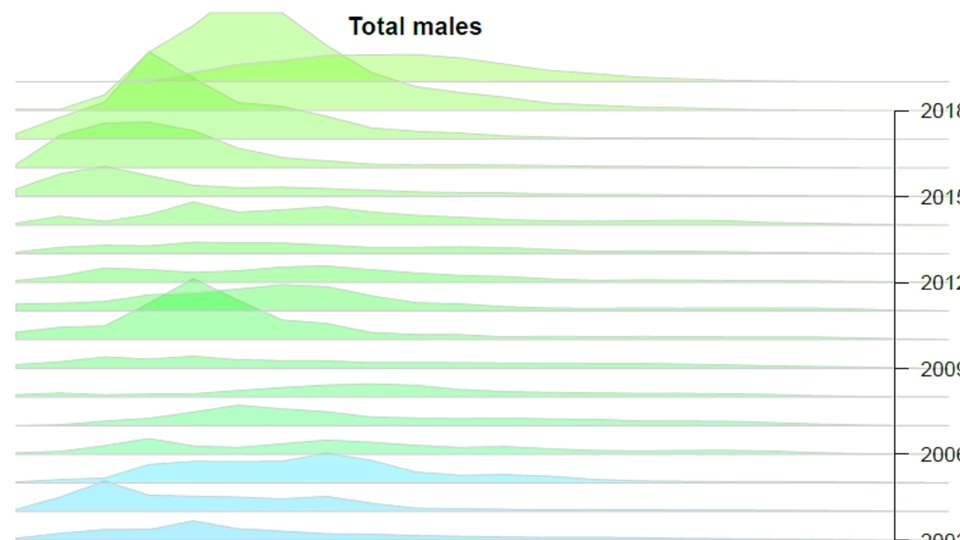

Immature males Mature males

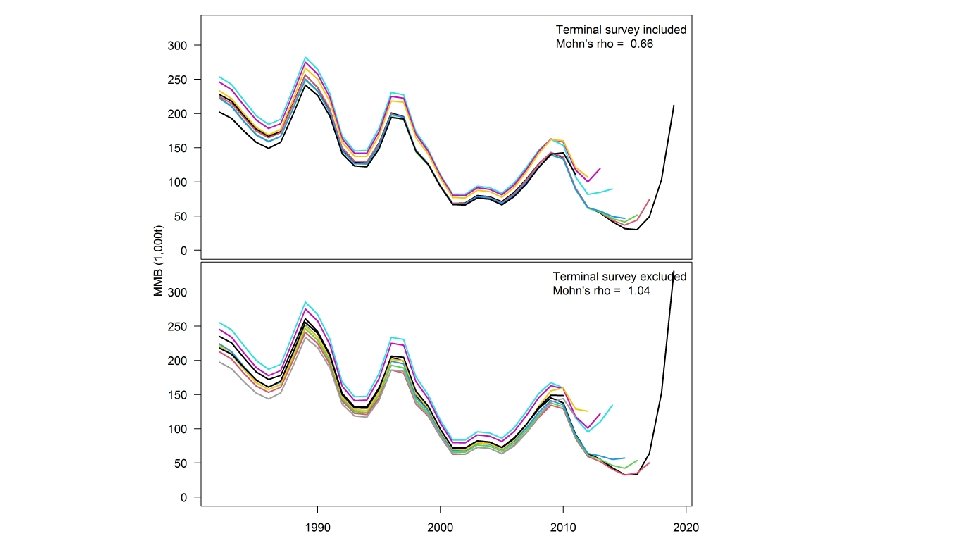
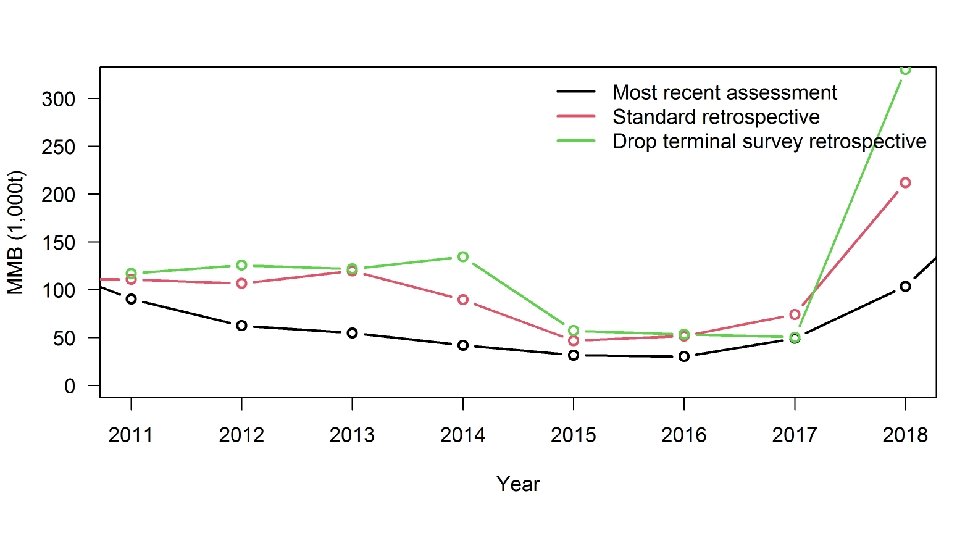
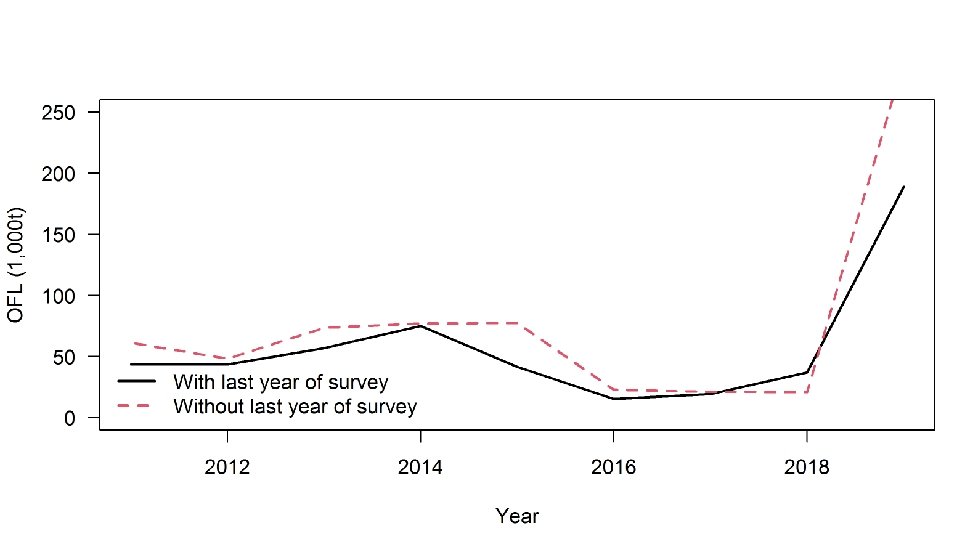
Uncertainty due to a missed survey • Many stocks on a biennial cycle • Snow crab is ‘special’—positive retrospective patterns • Two analyses: – Retrospective analysis + include/exclude last year of survey data – Imputed survey: • run the model with a value for 2020 index (but no size data) with a very high CV • Calculate the 25 th and 75 th quantiles for the residuals of fits to the survey MMB and FMB • Impute a value for the survey based on the quantiles (2 runs)

Imputed survey

Estimated recruitment
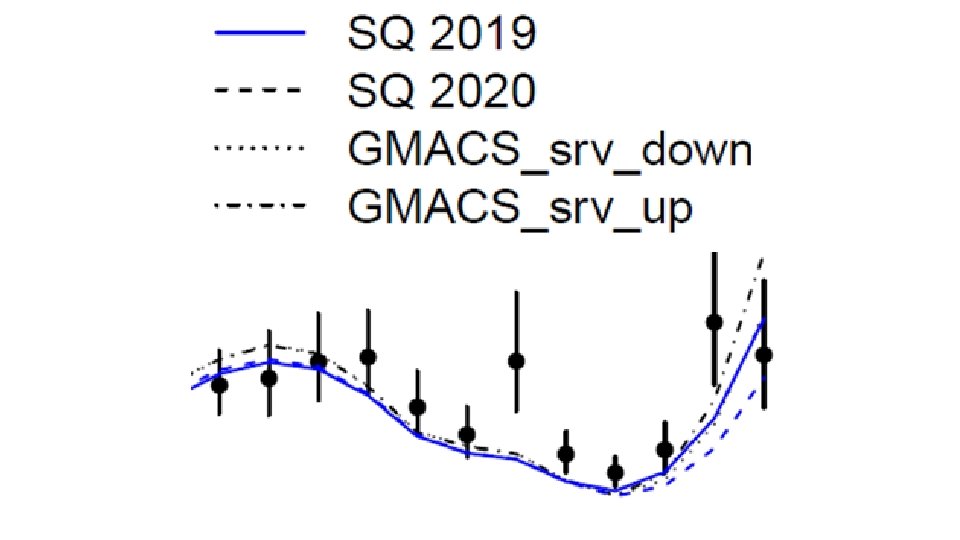
 vs. Status quo (solid line) 2020 data: GMACS (dotted")
2019 data: GMACS (dotted lines) vs. Status quo (solid line) 2020 data: GMACS (dotted lines) vs. Status quo (solid line) Why would 2015 recruitment be so much higher for GMACS than for SQ with 2019 data? Why would the GMACS recruitment increase so much from 2019 to 2020? Why didn’t SQ increase with the new data?

Sequential addition of catch data GMACS trawl GMACS discard female GMACS ret + total GMACS, add retained catch GMACS, no new catch data


• Why would 2015 recruitment be so much higher for GMACS than for SQ with 2019 data? – GMACS has no constraining smoothing parameter for recruitment – GMACS immature natural mortality is much higher than SQ • Why would the GMACS recruitment increase so much from 2019 to 2020? – The ratio between discarded catch and retained catch is a big signal. • Why wouldn’t the SQ recruitment estimates increase in 2020 too? – 2020 SQ does not get the trend in the last two years of survey MMB

Discard biomass mortality / retained biomass 0. 35 0. 3 0. 25 0. 2 0. 15 0. 1 0. 05 0 1980 * Selectivity changed a bit with rationalization so these are not perfect comparisons 1990 2000 2010 2020

What model do we choose? I prefer GMACS.

Model MMB B 35 FOFL 19. 1 109. 56 123. 71 1. 80 54. 05 20. 1 144. 29 120. 51 1. 60 95. 40 20. 2 207. 19 113. 66 1. 65 184. 91 20. 3 517. 13 183. 95 2. 61 448. 38

What do we do with that model? Potential for an additional buffer based on: 1. discrepancies in 2018 & 2019 survey 2. changes in estimated recruitment 3. worsening of retrospective patterns with no survey
- Slides: 64