A Simple Physically Based Snowfall Algorithm Daniel K

A Simple Physically Based Snowfall Algorithm Daniel K. Cobb Jr. Science Operations Officer WFO – Caribou, ME

Introduction I. Motivation and Goals II. Description of Algorithm III. Example Case IV. Summary V. Future Work VI. References VII. Questions

Motivation & Goals • Improve on 10: 1 snow ratio assumption • Incorporate aerial and temporal variation of snow ratio over a storm.

Motivation & Goals • Develop a Snow Amount Smart. Tool for GFE – Physically based population of snowfall from QPF – Good base tool in terms of collaboration • Develop complimentary snow amount/ratio code for use in Bufkit – Excellent Interpretation/interrogation tool forecaster

Motivation & Goals HISTORY • Initial interest began in 2000. • Idea further inspired by – Top-Down microphysics of Baumgardt – Crosshair approach of Waldstreicher – Canadian snow ratio decision tree algorithm by Dubè – Snow density diagnostic of Roebber

Algorithm SNOW CRYSTAL BASICS • Crystal habit depends – Primarily on temperature – Secondarily on relative humidity • Largest crystals (dendrites) form at temperatures between (-12°C and -18°C) • Crystal growth rates are also the largest in this temperature range.

Algorithm

Algorithm • To a first approximation, the amount of cloud mixing ratio formed in any layer will be related to its relative humidity and vertical motion. • This provides a basis for inferring the amount of crystal habit any one layer will contribute.

Algorithm FOUR STEP PROCESS 1. Layer snow ratios are calculated for all available NWP levels based on temperature. 2. The vertical motion of each layer is scaled based on the relative humidity of the layer. 3. A column total vertical motion is calculated as the sum of the scaled layer vertical motion. 4. The layer snow ratios from step one are weighted by the percent of column vertical motion and summed to obtain a base snow ratio. 5. The base snow ratio is then multiplied by the QPF to obtain snowfall.

Algorithm Example Consider a 3 layer cloud with the following layer average temperatures and vertical motion: First map temperatures to a snow ratio: T = -25 C ω = -5 μbs-1 T = -15 C ω = -10 μbs-1 T = -5 C ω = -5 μbs-1

Algorithm Example
 SR =")
Algorithm Example Layer temperature has now been mapped to snow ratio (SR) SR = 8: 1 %ω = -5/-20 μbs-1 The percent layer contribution to vertical motion is now being calculated. SR = 24: 1 %ω = -10/-20 μbs-1 SR = 9: 1 %ω = -5/-20 μbs-1

Algorithm Example The weighted layer snow ratios are summed up over the cloud yielding the base snow ratio. The snow ratio would then be: 2. 0 + 12. 0 + 2. 3 = 16. 3 Or ~16: 1 SR = 8: 1 %ω = -5/-20 μbs-1 8. 0 * 0. 25 = 2. 0 SR = 24: 1 %ω = -10/-20 μbs-1 24. 0 * 0. 50 = 12. 0 SR = 9: 1 %ω = -5/-20 μbs-1 9. 0 * 0. 25 = 2. 25

Algorithm Example The snowfall is obtained by multiplying the snow ratio by the QPF. A QPF of 1. 50” and the calculated snow ratio of 16: 1 would yield: 1. 50 * 16 = 24 inches
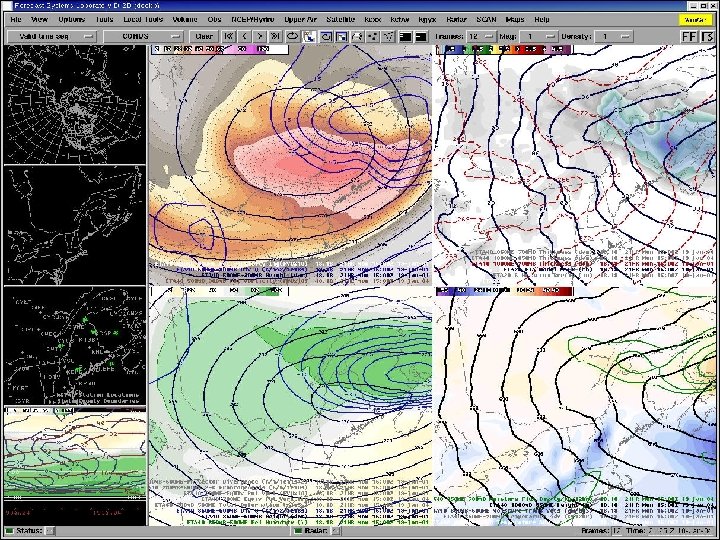
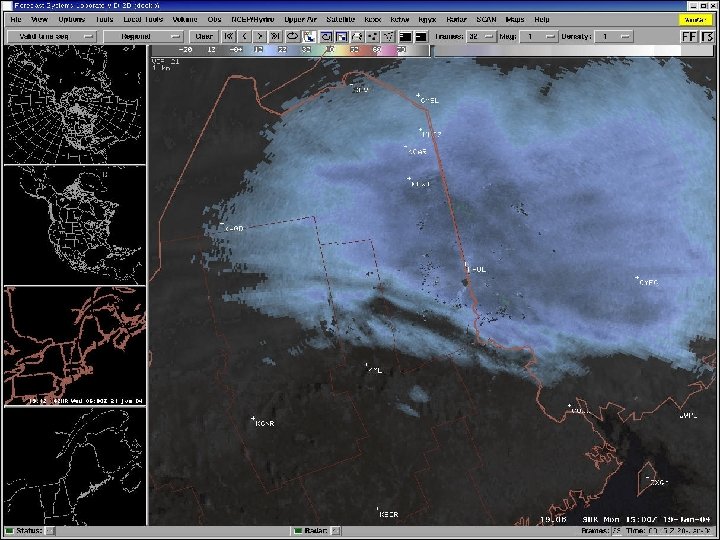
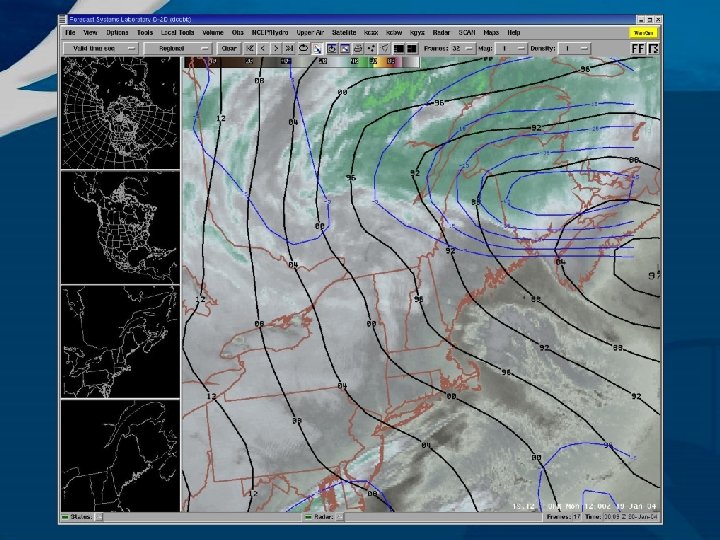
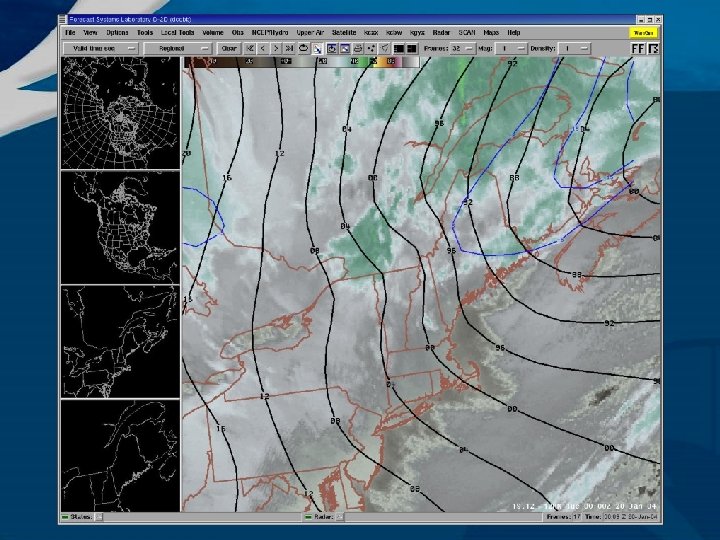
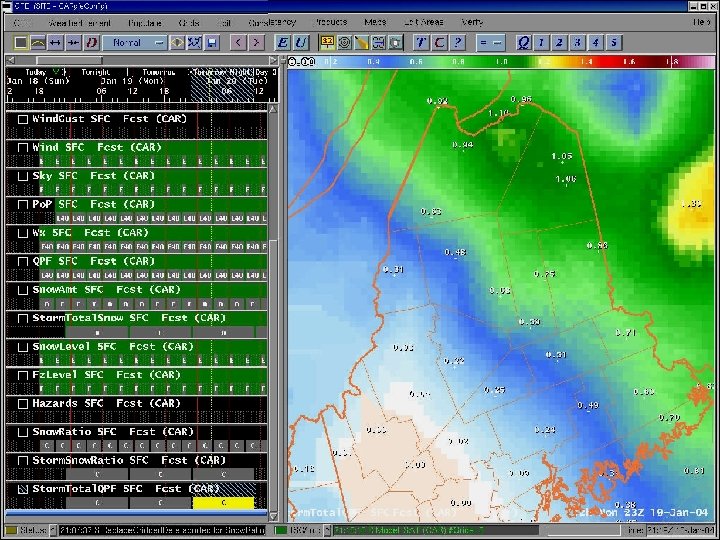
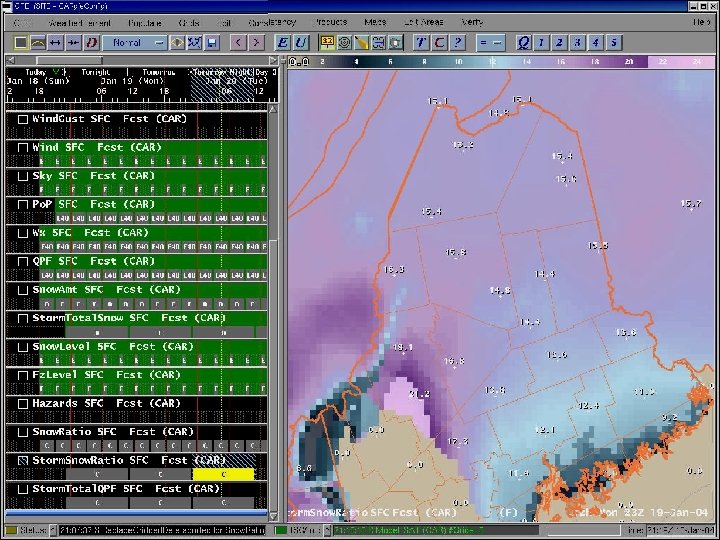
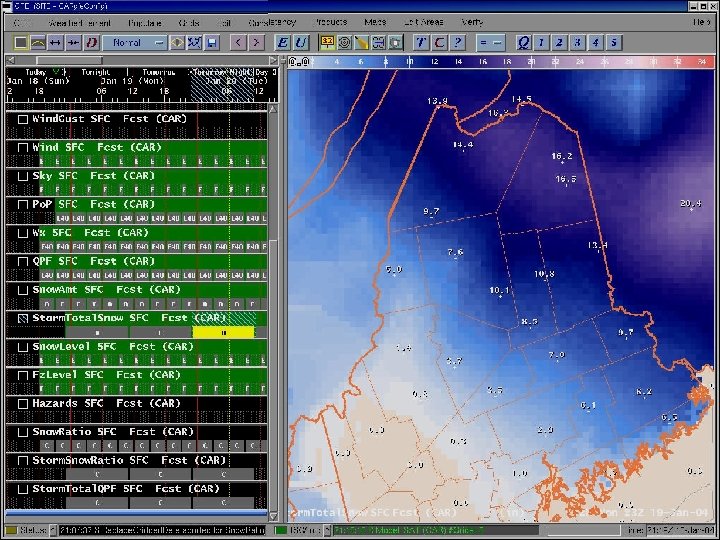
 • Localized heavy snowfall from pivoting inverted surface trough and")
Example (2004 Jan 19) • Localized heavy snowfall from pivoting inverted surface trough and eastward extending upper low. • SOO’s neighborhood was ground zero with 21 inches of rather fluffy snow! • Maximum snowfall rates approaching 3 inches per hour occurred at about 15 Z on Jan 19 th.


 – Jeff")
Car. Snow. Amt Smart. Tool • Collaborators – Dave Novak (ERH, SSD) – Jeff Waldstreicher (ERH, SSD) – Tom Lebvre (FSL) • Test version now available from STR – Currently useable with Eta 80, Eta 40, and WSEta. (GFS 80 coming in OB 4)

Snow Amount Bufkit • Planned incorporation into Bufkit • Currently exists as Perl program which uses Bufkit files to perform calculations • Compliments GFE Smar. Tool by allowing forcaster to critique the answer. • Additional precipitation type logic currently being developed.

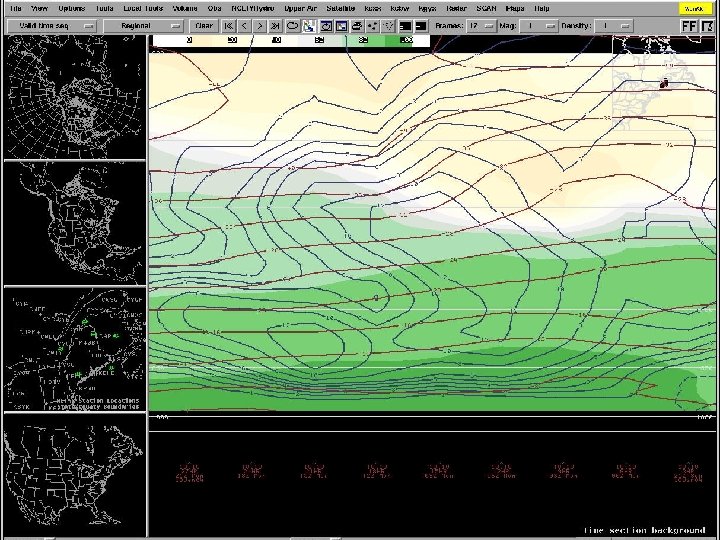
Bufkit Example 2004 Jan 19

Stn. ID Date/hour Fcst. HR QPF Sfc. T Sn. R Snow Cum. Snw Cum. QPF ===================================== 727130 040118/1800 0 0. 000 -7. 8 0. 00 727130 040118/1900 1 0. 004 -6. 9 20. 4 0. 1 0. 00 727130 040118/2000 2 0. 016 -7. 0 19. 5 0. 3 0. 4 0. 02 727130 040118/2100 3 0. 024 -7. 0 19. 9 0. 5 0. 9 0. 04 727130 040118/2200 4 0. 024 -7. 2 17. 1 0. 4 1. 3 0. 07 727130 040118/2300 5 0. 024 -6. 8 20. 0 0. 5 1. 7 0. 09 727130 040119/0000 6 0. 020 -6. 5 16. 8 0. 3 2. 1 0. 11 727130 040119/0100 7 0. 020 -6. 1 15. 7 0. 3 2. 4 0. 13 727130 040119/0200 8 0. 020 -5. 8 15. 4 0. 3 2. 7 0. 15 727130 040119/0300 9 0. 028 -5. 8 15. 1 0. 4 3. 1 0. 18 727130 040119/0400 10 0. 035 -5. 9 14. 8 0. 5 3. 6 0. 21 727130 040119/0500 11 0. 039 -5. 8 15. 0 0. 6 4. 2 0. 25 727130 040119/0600 12 0. 043 -5. 9 14. 8 0. 6 4. 8 0. 30 727130 040119/0700 13 0. 047 -5. 9 14. 7 0. 7 5. 5 0. 34 727130 040119/0800 14 0. 047 -6. 0 14. 9 0. 7 6. 2 0. 39 727130 040119/0900 15 0. 047 -6. 0 15. 2 0. 7 7. 0 0. 44 727130 040119/1000 16 0. 043 -6. 2 15. 2 0. 7 7. 6 0. 48 727130 040119/1100 17 0. 039 -6. 2 14. 3 0. 6 8. 2 0. 52 727130 040119/1200 18 0. 039 -6. 2 14. 0 0. 6 8. 7 0. 56 727130 040119/1300 19 0. 043 -6. 0 14. 4 0. 6 9. 3 0. 60 727130 040119/1400 20 0. 047 -5. 4 14. 9 0. 7 10. 1 0. 65 727130 040119/1500 21 0. 051 -4. 9 15. 0 0. 8 10. 8 0. 70 727130 040119/1600 22 0. 055 -4. 6 15. 2 0. 8 11. 7 0. 76 727130 040119/1700 23 0. 051 -4. 1 15. 8 0. 8 12. 5 0. 81 727130 040119/1800 24 0. 043 -3. 7 15. 7 0. 7 13. 1 0. 85 727130 040119/1900 25 0. 039 -3. 5 16. 1 0. 6 13. 8 0. 89 727130 040119/2000 26 0. 035 -3. 6 16. 1 0. 6 14. 3 0. 93 727130 040119/2100 27 0. 031 -4. 1 16. 6 0. 5 14. 9 0. 96 727130 040119/2200 28 0. 028 -4. 6 16. 0 0. 4 15. 3 0. 98 727130 040119/2300 29 0. 024 -4. 8 15. 4 0. 4 15. 7 1. 01 727130 040120/0000 30 0. 020 -5. 3 14. 9 0. 3 16. 0 1. 03
 2004 Jan 19 Date: Time Snow Equiv Ratio 01/18 18 Z –")
Verification (PQI) 2004 Jan 19 Date: Time Snow Equiv Ratio 01/18 18 Z – 24 Z 2. 3 0. 15 15. 3 01/19 00 Z - 12 Z 9. 8 0. 61 16. 1 01/19 12 Z – 18 Z 8. 6 0. 42 20. 5 01/19 18 Z – 24 Z 0. 8 0. 08 10. 0 Storm Total 21. 5 1. 26 17. 1

Eta Forecast 01/17 – 12 Z Location Snow Equiv Ratio Caribou 9. 7 0. 58 16. 7 Houlton 13. 8 0. 84 16. 4 Millinocket 12. 6 0. 82 15. 4 Bangor 8. 2 0. 67 12. 2 Eastport 9. 9 0. 83 12. 0

Summary • Initial results: A weighted average approach to snow-ratios works well. – Such an approach is computer calculation friendly. • Predicted ratios are very similar to those found using Dubè decision tree. – Decision trees are people friendly. • Applying snow-ratio diagnostic techniques improves forecast location of snowfall amounts as well as snowfall axes.

Future Work • Snow ratios up to 100: 1 have been observed – This is often the result of aggregates of spatially large dendrites. The aggregate being less dense than its constituent crystals. • Comprehensive snow study at WFO-CAR – Two sonic depth sensors – Measurements planned at 1, 3, and 6 hours. – ASOS LEDWI snowfall algorithm tests

References • Baumgardt, Dan, 1999: Wintertime. Cloud Microphysics Review. NWS Central Region, [Available online at http: //www. crh. noaa. gov/arx/micrope. html]. • Dube`, Ivan, 2003: From_mm_to_cm. COMET’s Northern Latitude Meteorology Webpage, http: //meted. ucar. edu/norlat/snowdensity/from_mm_to_cm. pdf]. • Roebber, P. J. , S. L. Bruening, D. M. Schultz, and J. V. Cortinas Jr. , 2002: Improving Snowfall Forecasting by Diagnosing Snow Density. Wea. Forecasting, 18, 264 -287. • Waldstreicher, J. S. , 2001: The Importance of Snow Microphysics for Large Snowfalls, Preprints, 3 rd Northeast Operational Workshop NOAA/NWS Albany, NY, [Available online at http: //www. erh. noaa. gov/er/hq/ssd/snowmicro/].

Thank You Question?
- Slides: 35