A Presentation by Abbey Lang Colby Lohrey History

A Presentation by Abbey Lang & Colby Lohrey

• History • Pollution Problems • Environmental Activist Groups
 – – Roads (Corner to Corner) (10)")
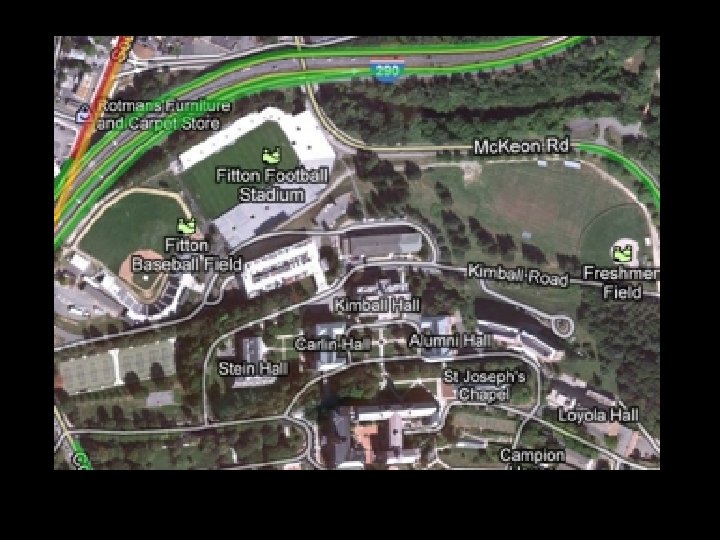
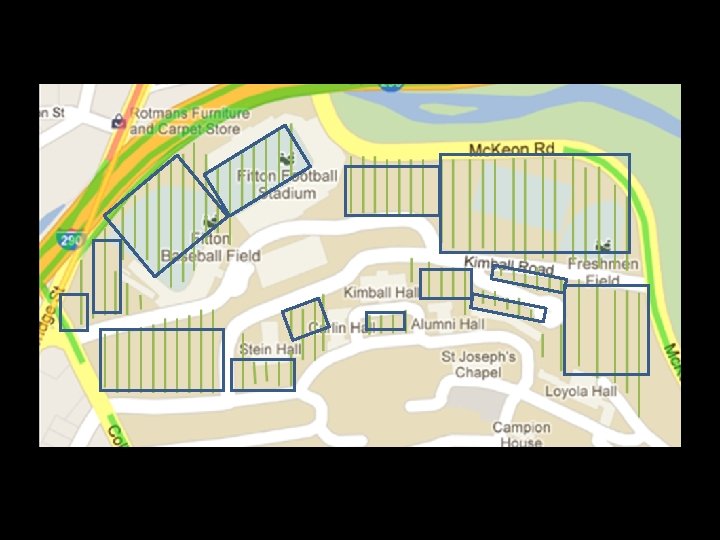
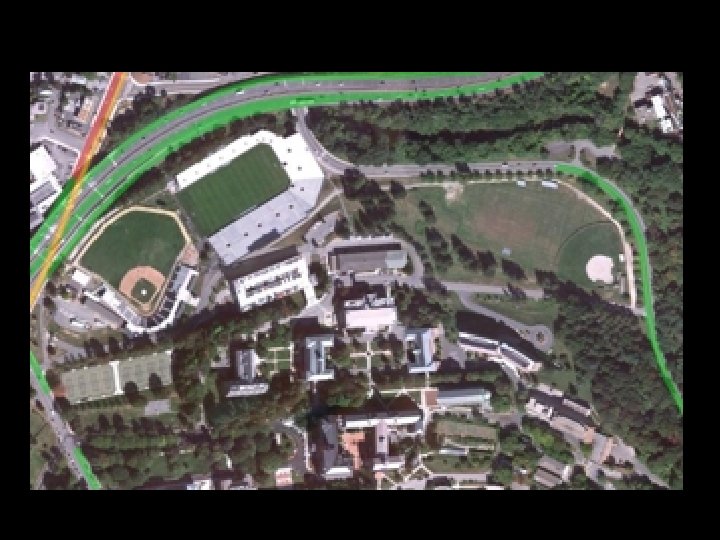
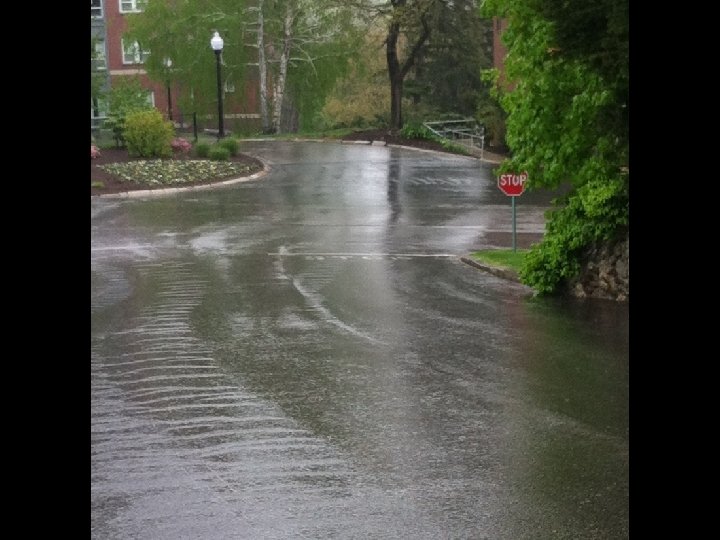
• LOWER AREA OF CAMPUS (IMPERVIOUS) – – Roads (Corner to Corner) (10) • Stein Gate to Loyola = 1832. 6 m^2 • Loyola to Gate (both levels) = 592. 9 m^2 Buildings (8) and 862. 4 m^2 • Alumni = 816 m^2 • Stein to Williams (Behind kimball) = • Williams = 1066 m^2 3858. 75 m^2 • Loyola = 2050 m^2 • Williams to Mckeon = 2401 m^2 • Williams road (with circle) = 844. 025 m^2 • Kimball = 1650 m^2 • Football field road to college 6118. 88 m^2 • Carlin = 1026 m^2 • College St to Stein Gate = 1577. 80 m^2 • Stein = 1520 m^2 • Alumni Side of Kimball Courtyard = • Parking Garage = 1520 m^2 244. 388 m^2 • Maintaince Buliding (behind Kimball) = • Carlin Side of Kimball Courtyard = 197. 225 1248 m^2 Sports Stadiums (4) • Kimball Side of Kimball Courtyard = 906. 5 • Football (not including grass field) = 7500 m^2 • Baseball stadium (not including field) = PERVIOUS AREAS Grass/Fields: 70420. 55 m^2 3300 m^2 Tree Count – 121 • Tennis Courts Total (8) = 169. 45 m^2 Shrubs: • Basketball Court = 390 m^2
 ground area lying under roofs of buildings (“building footprint”) 2)")
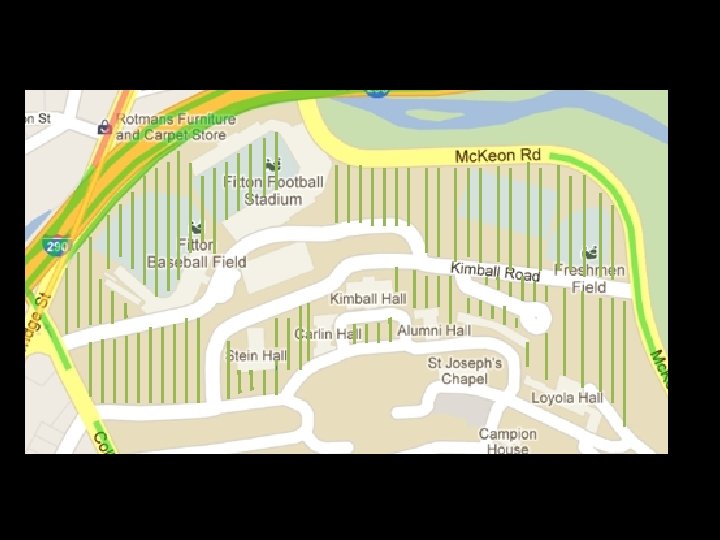
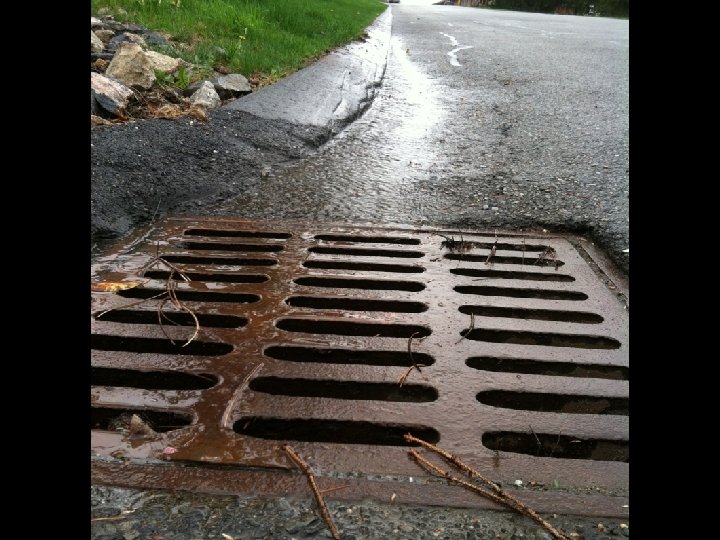
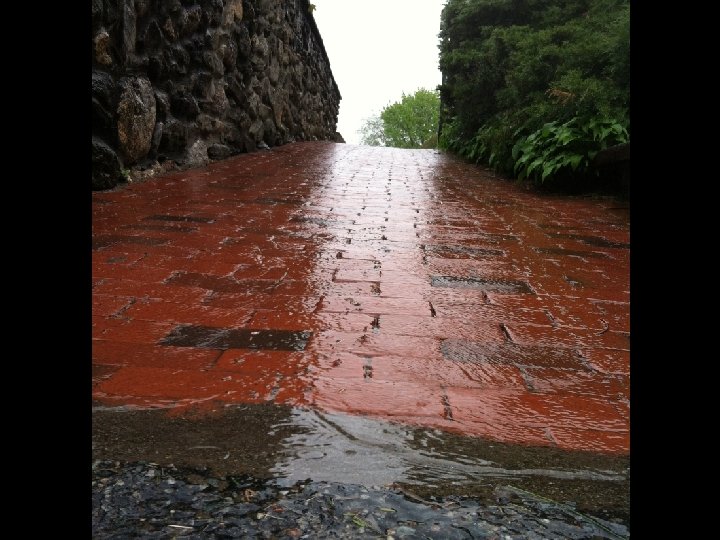
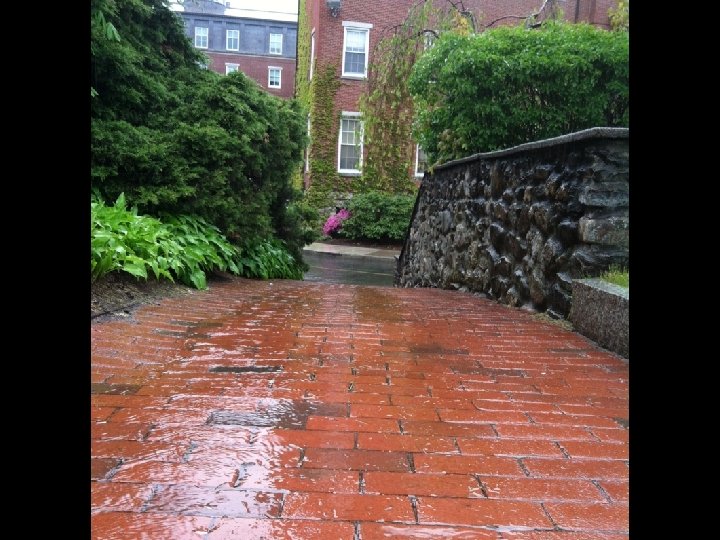
• Pervious 1) ground area lying under roofs of buildings (“building footprint”) 2) roadways 2) surface area of impervious (concrete, asphalt, closely packed brick) pedestrian pavement 3) surface area of vehicle pavement • Impervious 5) surface area of grass 6) surface area of shrubs 7) number of large trees

Runoff Index

RUN OFF INDEX MATHMATICS Buildings A 1 = 22, 255. 45 m^2 W 1 =. 30 Roadways A 2 = 19, 436. 468 m^2 W 2 =. 53 Pedestrian Walkways A 3 = 1, 813 m^2 W 3 =. 20 Grass A 4 = 70, 420. 55 m^2 W 4 =. 05 Shrubs A 5 = 548. 6542 W 5 =. 01 Gravel/Pervious Brick A 6= 0 m^2 W 6 =. 01 Tree Count T= 121 Trees W 7 = -. 10

W +W +W +W+W =1. 30 +. 53 +. 20 +. 05 +. 01 + -. 1 = 1 1 2 3 4 5 6 T RI = W A + W A + W T RI =. 3(22255. 45) +. 53(19436. 468) +. 2(1813) +. 05 (70420. 55) +. 01 (0) +. 01 (538. 6542) + 121 (-. 10) = 20854. 9 1 1 2 2 3 3 4 4 5 5 6 6 T

Hypothetical Situation Regions n = 100 RI 1, RI 2, …. RI 100 Which areas are most harmful or have most run off? BOX PLOT
- Slides: 17