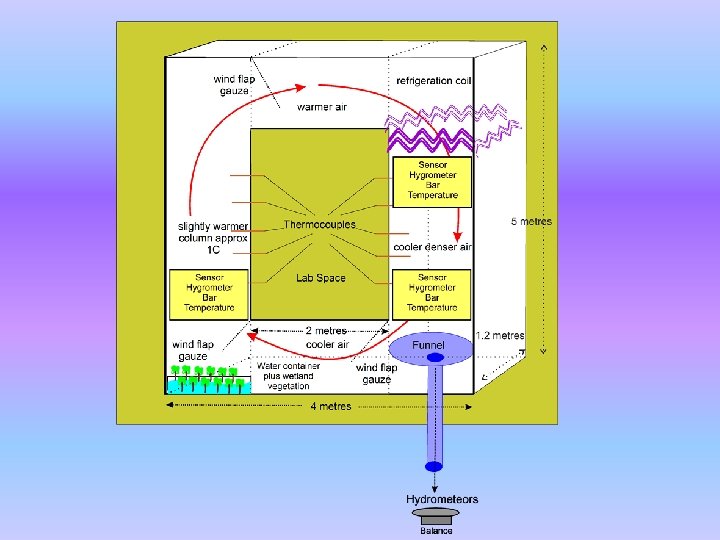
A Physical Experiment to show the Impact of


 del Páramo (Colombia, Ecuador & Venezuela)")


 (Sahara Desert, Algeria) 27°")


, October 2013 10. 06 9. 94")


. This image is copyright Dennis")


- Slides: 52
A Physical Experiment to show the Impact of Atmospheric Condensation of Water Vapour on Surface Air Movement. Peter Bunyard, FLS Instituto de Estudios y Servicios Ambientales, Universidad Sergio Arboleda, Bogotá, Colombia. & Good Energies Foundation European Geo. Sciences Union, Vienna, Tuesday 29 th April, 2014
Laguna de la Cocha en el Alto Putumayo The Lake is fed by the Amazonian Hydrological Cycle. In return it forms the Putumayo River which flows into the Amazon River in Brazil
Páramos: Water Soakers and River-makers Frailejónes (Espoletia) del Páramo (Colombia, Ecuador & Venezuela)
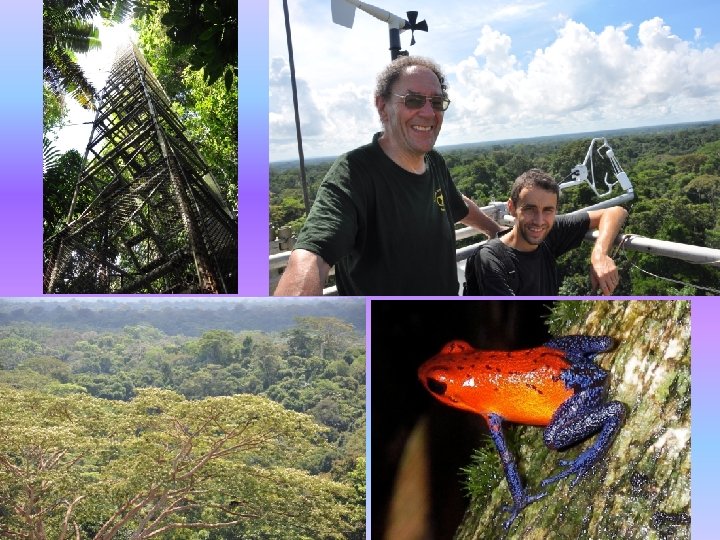
Piedmont, with the richest of rainforests, Putumayo, Nov 2005. Even though a scorching day over the Amazon plains below me, the trees are pumping water vapour into the atmosphere. The leaves, via the stomata, are emitting cloud condensation nuclei (CCNs), including isoprenes and Pseudonomas bacteria.
La selva recicla promedio 50% de la precipitación por la evapo-transpiración, así proveendo agua para los páramos y nevados y así formando los grandes ríos como el Caquetá, Putumayo, Orinoco y Magdalena en Colombia.
Teleconnections/atmospheric rivers Impact deforestation on local hydrology
Derived from Avissar & Werth
Soya, Pará, Amazonas, Brazil
Tailandia, Para, Brasil, Deforested for Cattle.
The Putumayo, Colombia, during the drought of 2005.
Bolivia September 2007 Fires and deforestaction to make way for soya plantations: The smoke drifting towards Leticia/Tabatinga, Colombia/Brazil border.
August 2005, Tabatinga: The Amazon River between three countries, Brazil, Colombia y Perú, with levels way down from normal. The smoke from the deforestation for soya in Brazil and Bolivia has filled the air and caused flights to be cancelled between Leticia and the capital, Bogota.
Note: According to the WHRC, the above map is "a product of our ongoing drought monitoring effort from Oct. 2005, the worst month we have in our record going back to 1995. It shows moisture stored in the soil which is available for use by plants, what we call 'Plant-Available Water' or 'PAW', expressed as a percentage of the total water-holding capacity of the top 10 m of soil at any given point; %PAW is one of the strongest indicators we have of severity of drought and of forest susceptibility to fire. Source: Butler (2010).
Biotic pump theory realised and developed by Victor Gorshkov and Anastassia Makarieva from the Institute of Nuclear Physics, St Petersburg, Russia, (2006 to the present). According to theory, the condensation of water vapour in the lower atmosphere, at cloud level, results in an abrupt reduction in local pressure such as to draw surface air vertically upwards. A flow of surface air in the horizontal plane is therefore drawn in to replace that vertical movement of air. The rate of condensation at cloud formation level is contingent on the quantity of water vapour emitted from the surface in processes of evapotranspiration. The biotic pump theory maintains that the rainforest, with its high leaf area index and substantial roots provides the fuel in terms of water vapour for maintaining a high rate of condensation. Condensation, fuelled by a high rate of evapotranspiration, rather than temperature, is held to be the primary source of vertical convection.
Biotic Pump Theory Humid tropical rainforests have exceptionally high leaf area indices, which permit high evapotranspiration. The upward flow of wáter vapour, acting as ‘fuel’ for cloud condensation acts to draw in humid air from the ocean, namely the Trade Winds. Without the biotic pump and the resulting suction, the winds will not penetrate across a continent, such as South America. Monoculture plantations, with poorer access to groundwater and reduced rates of evapotranspiration will not compensate for a composite rainforest with its complex interacting ecosystems.
Biotic pump in action Deforestation impact over the biotic pump. Makarieva & Gorshkov (Makarieva A. M. , 2007) use a length of 600 km over which distance a molecule of water will evaporate and fall-out through precipitation.
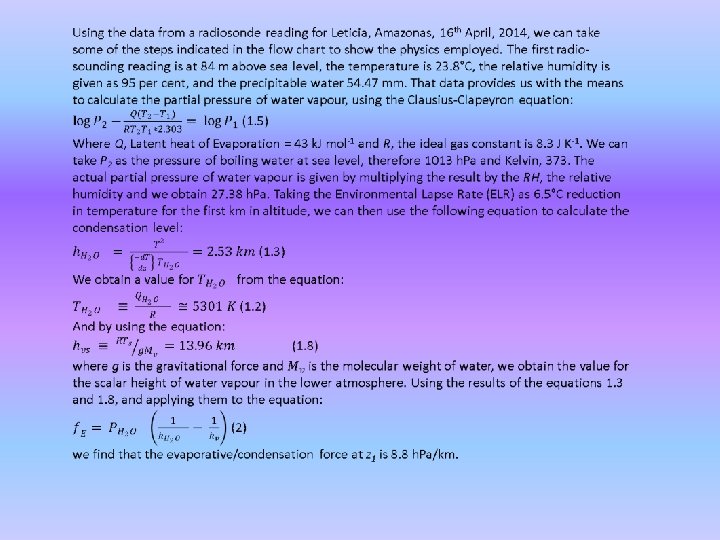
The Biotic Pump theory Flow chart derived from physical principles
Radiosoundings locations for Africa and South America. Data courtesy of University of Wyoming
Radiosounding Locations COORDINATES SITE PLACE LATITUDE LONGITUDE In Salah (60630) (Sahara Desert, Algeria) 27° 12'N 002° 28'E Guimar, Spain (60018) (Tenerife, Canary Islands 28° 18' 0" N 16° 25' 0" W Fernando de Noronha Airport: (SBFN) Western Atlantic, Brazil 3° 51' 16" S 32° 25' 23" W Belem, (SBBE) Brazil 1° 27' 0" S 48° 29' 0" W Manaus (SBMN) Brazil 3° 6' 47" S 60° 1' 31" W Porto Velho (SBPV) Brazi 8° 46' 0" S 63° 54' 0" W Leticia (SKLT) Colombia 4° 12' 55" S 69° 56' 26" W Bogota (BOG) Colombia 04° 38' N 74º 05' W Tres Esquinas (TQ) Caqueta, Colombia 1° 50' 51 N 74° 47' 43 W St Helena (61901) St Helena 15° 56" S 5° 44" W Boa Vista (SBBV) Roraima, Brazil 2° 49' 0" N 60° 40' 0" W Morona (MOR) Ecuador 3° 73' 0" S 73° 25' 0" W Tindouf (DAOF) Algeria 27° 40'N 8° 8'W
Radiosoundings July 2012 Boa Vista Manaus Fernando de Noronha Belem Porto Velho Tres Esquinas St Helena Compare surface humidity Guimar DAOF Bogota Compare f. E In Salah 0, 00 5, 00 10, 00 15, 00 20, 00 25, 00 Note. The evaporative/condensation force f. E (h. Pa/km) and the surface humidity are calculated using the equations as described in the flowchart. In effect, surface humidity (grams of water vapour per cubic metre of air follows a parallel trajectory as does f E (Makarieva & Gorshkov, 2007). Source: Author.
Comparative f. E and surface humidity January 2012 Leticia Porto Velho Manaus Fernando de Noronha Boa Vista Surface humidity Tres Esquinas f. E St Helena Guimar Bogota In Salah DAOF 0, 00 5, 00 10, 00 15, 00 20, 00 25, 00
Partial Pressure Force 13, 00 Leticia 25 th April 2014 12, 00 11, 00 partial pressure h. Pa per Km 10, 00 M&G net upward force ELR 6. 5 9, 00 8, 00 Upwards force 7, 00 6, 00 5, 00 4, 00 3, 00 2, 00 1, 00 0 2000 4000 6000 Altitude metres 8000 10000
Tres Esquinas in the Caquetá…. Heavily deforested, 0. 5° North of the Equator
Water vapour density at surface 25, 00 Feb 2010 Mar 2010 April 2010 Jan 2011 Feb 2011 Mar 2011 April 20, 00 15, 00 10, 00 5, 00 T Le E ti M cia an au s TE le ti M cia an au s T Le E ti M cia an au s 0, 00 TE Leticia Manaus TE leticia Manaus TE Leticia Manaus
22, 00 2011 -12 surface humidity 17, 00 Leticia 2011 surface humidity g/cu m/day Tres Esquinas surface humidity g/cu. m/day Manaus surface humidity g/cu. m/day monthly average 1. 1. 20 11 2. 1. 20 11 3. 1. 20 11 4. 1. 20 11 5. 1. 20 11 6. 1. 20 11 7. 1. 20 11 8. 1. 20 11 9. 1. 20 10 11. 1. 2 0 11 11. 1. 2 0 12 11. 1. 2 01 1 1. 1. 20 12 2. 1. 20 12 3. 1. 20 12 4. 1. 20 12 5. 1. 20 12 6. 1. 20 12 7. 1. 20 12 8. 1. 20 12 9. 1. 20 10 12. 1. 2 0 11 12. 1. 2 0 12 12. 1. 2 01 2 12, 00 25, 00 Surface Humidity during El Niño 2010 20, 00 15, 00 Leticia monthly surface humidity gm/ cu m / day 10, 00 Manaus monthly surface humidity g / cu m Sheet 1!$Q$88 /day 5, 00 Tres Esquinas monthly surface humidity g / cu m / day 0, 00 фев-10 мар-10 апр-10
Variance in surface humidity g/cu m 2011 -2012 20, 00 Variance Tres Esquinas, surface humidity 18, 00 16, 00 Variance Leticia surface humidity 14, 00 12, 00 Variance Manaus surface humidity 10, 00 8, 00 6, 00 4, 00 2, 00 0, 00 11. 18. 2010 2. 26. 2011 6. 6. 2011 9. 14. 2011 12. 23. 2011 4. 1. 2012 7. 10. 2012 10. 18. 2012 1. 26. 2013
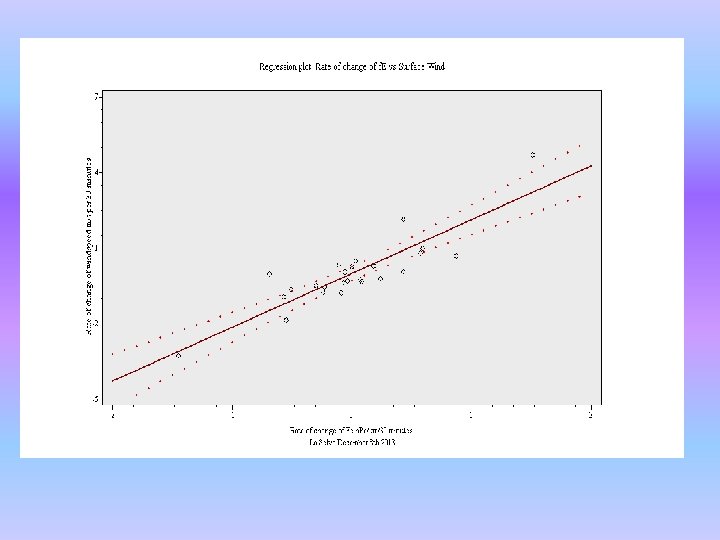
Meteorological data taken from OTS sites in Costa Rica, namely La Selva and Palo Verde indicate a high correlation between surface humidity and hence f. E, the evaporative force and surface wind.
La Selva 15 th May 2013 80 4 Partial Pressure Force 60 3 Windspeed Force 40 2 20 1 0 0 4 8 12 16 20 -40 -60 24 0 -1 h. Pa -2 Viento -80 -3 01 June 2013 80 1 60 Partial Pressure Force 40 Windspeed Force 0, 5 20 0 -20 -40 0 0 4 8 12 16 20 24 -0, 5 -60 -80 -1 -100 -120 -1, 5
La Selva 16 th May 2013 200 Partial Pressure Force 150 Windspeed Force 1, 5 1 100 0, 5 50 -6 0 -1 -50 0 4 9 14 19 24 -0, 5 -100 -150 -200 -1 -1, 5
La Selva 04 May 2014 Comparative slope change of f. E and surface wind slope change of wind 1 1, 5 Windspeed slope change + 30 min 1 0, 5 f. E slope of change h. Pa/km 0 0 2 4 6 8 10 12 14 16 18 20 22 24 0 -0, 5 -1 -1, 5 -1 Hour -1, 5
La Selva 4 th December 2013 Comparative slope change of f. E and surface wind 1 2 1, 5 slope change of wind Windspeed slope change + 30 min 0, 5 1 0, 5 f. E slope of change h. Pa/km 0 0 2 4 6 0 8 10 12 14 16 18 20 22 -0, 5 24 -0, 5 -1 -1, 5 -1 -2 -2, 5 -1, 5 -3 Hour La Selva 8 th December 2013 100 4 Partial Pressure Force 80 Windspeed Force 3 60 2 40 1 20 -6 0 -1 -20 4 9 14 19 24 0 -1 -40 -60 -80 -2 -3
La Selva 03 April, 2014 Comparative slope change of f. E and surface wind slope change of wind 1 1, 5 Windspeed slope change + 30 min 1 0, 5 f. E slope of change h. Pa/km 0 0 2 4 6 8 10 12 14 16 18 20 22 24 0 -0, 5 -1 -1 -1, 5 Hour La Selva 05 May 2014 Comparative slope change of f. E and surface wind slope change of wind 1, 5 Windspeed slope change + 30 min 1 0, 5 f. E slope of change h. Pa/km 0 0 0 2 4 6 8 10 12 -0, 5 16 18 20 22 24 -0, 5 -1 -1, 5 14 -1 Hour -1, 5
Date Evaporative/condensation force Windspeed m/s Temperature (h. Pa/km), October 2013 10. 06 9. 94 9. 55 November 2013 10. 47 9. 87 9. 9 December 2013 10. 42 10. 68 9. 74 January 2014 10. 35 10. 52 9. 58 February 2014 10. 29 9. 68 March 2014 10. 29 9. 84 April 2014 10. 39 10. 35 9. 71
La Selva March 2012 Correlations f. E & Wind 40 f. E & Temp 35 f. E & Temp inverse f. E & Barometric Pressure 30 f. E & VPD 25 f. E & VPD inverse 20 Temp & Wind f. E & Wind 15 f. E & Temp 10 f. E & temp inverse Temp & wind f. E & VPD inverse f. E & VPD f. E & Barometric Pressure f. E & temp inverse f. E & Temp f. E & Wind Temp & Wind f. E & VPD inverse f. E & VPD f. E & Barometric Pressure f. E & VPD f. E & Temp inverse 0 f. E & Temp f. E & Barometric Pressure f. E & Wind 5 Temp & wind High correlations on the left, weaker correlations on the right
La Selva 1012 Average La Selva data March to May 2012 1010 La Selva averaged Bar, May to June 2012 1008 Simulated Bar with p 1, p 2 1006 Simulated Bar for May June 2012 1004 Simulated Bar with p 4, p 5 1002 1000 0 4 8 12 16 20 24
Cosine component, La Selva 1011 1009 1007 1005 Cosine component 1003 Averaged RH, March to May 2012 1001 999 0 2 4 6 8 10 12 14 16 18 20 22 24
September 1961 -1970 1013, 2 1013, 1 1013 Jokioinen: 1012, 9 Latitude: 60° 48' 50. 44" Longitude: 23° 29' 51. 40" 1012, 8 1012, 7 1012, 6 1012, 5 September 1961 -1970 1012, 4 0 5 10 15 20 Cosine component of Bar Wave 1, 5 1 Cosine component of Bar Wave 0, 5 0 -6 -0, 5 4 14 24 -1 -1, 5 Note: Atmospheric water path as determined over 24 hours in the Pacific reveals similarities with the cosine component derived from the barometric wave for La Selva, implying that the diurnal wave is strongly influenced by hydrology. Source: Wood, Bretherton, & Hartmann, 2002.
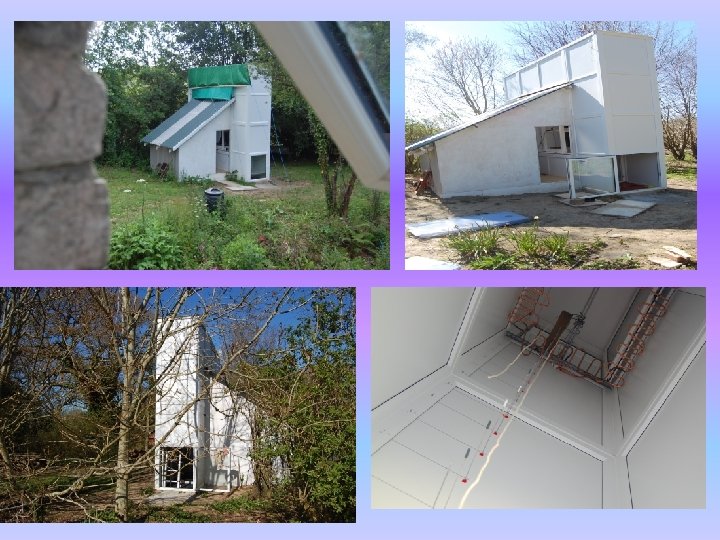
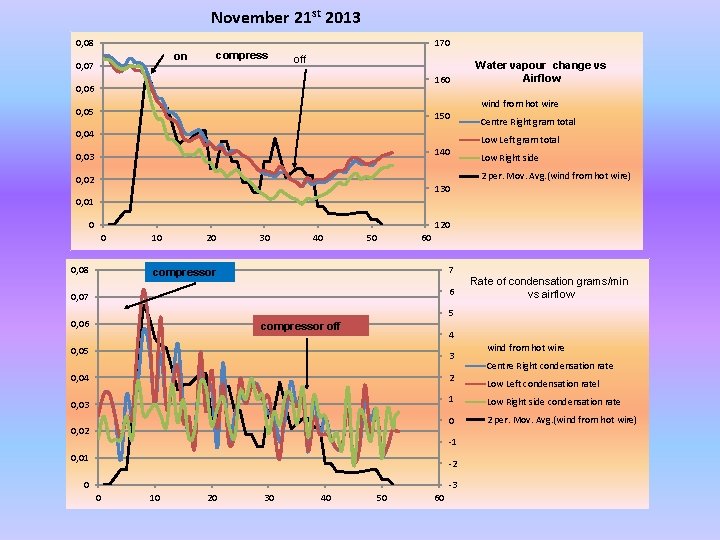
The video shows significant air movement some 30 seconds after the compressor is switched on and the rate of condensation rises to a peak.
1, 278 0, 1 hotwire m/s 0, 09 air density g/cu m centre right air density g/cu m low left 1, 276 1, 274 0, 08 0, 07 1, 272 0, 06 1, 27 0, 05 0, 04 1, 268 0, 03 1, 266 0, 02 1, 264 0, 01 1, 262 0 1000 2000 3000 4000 0 6000 5000 Experiment November 30 th 2013 airflow from hot wire compared with theoretical airflow velocity from physics 0, 15 hot wire airflow compress 10 per. Mov. Avg. (velocity from physics) 0, 1 airflow m/s 0, 05 0 500 1000 1500 2000 2500 3000 3500 4000 4500 0 5000 -0, 05 Time in seconds -0, 1
Windsonic airflow m/s April 18, 2014 350 Airflow directionality 0, 225 300 0, 175 Airflow m/s 250 0, 125 200 0, 075 150 0, 025 100 -0, 025 0 500 1000 1500 -0, 075 2000 2500 3500 4000 450050 0 time seconds April 18, 2014 Windsonic airflow m/s Low right calculated airflow 5 per. Mov. Avg. (Low right calculated airflow) 0, 25 0, 2 0, 15 Airflow m/s 3000 0, 65 0, 45 0, 25 0, 1 0, 05 -0, 15 0 -0, 05 -0, 1 0 500 1000 1500 2000 2500 time seconds 3000 3500 4000 -0, 35 4500 -0, 55 -0, 75
Windsonic airflow m/s April 18, 2014 left col rate of condensation g/5 s 0, 195 Right Col condensation rate 3 per. Mov. Avg. (Windsonic airflow m/s) 3 per. Mov. Avg. (left col rate of condensation g/5 s) 3 per. Mov. Avg. (Right Col condensation rate) 0, 145 Airflow m/s 1, 00 0, 095 0, 50 0, 00 -0, 50 0, 045 -1, 00 -0, 005 0 500 1000 1500 -0, 055 2000 2500 3000 3500 4000 -2, 00 time seconds Air density lower left Air density kg/cubic metre Air density lower right 1, 222 Condenser Temperature 1, 22 1, 218 Air density 1, 216 1, 214 1, 212 1, 21 1, 208 1, 206 0 500 1000 1500 2000 2500 Time seconds 4500 -1, 50 3000 3500 4000 20 18 16 14 12 10 8 6 4 2 0 4500
April 23, 2014 Windsonic airflow m/s 0, 25 0, 2 16 15, 5 5 per. Mov. Avg. (Low right water vapoour partial pressure h. Pa) 0, 15 Airflow m/s 16, 5 Low right water vapoour partial pressure h. Pa 0, 1 15 14, 5 14 0, 05 13, 5 0 -0, 05 0 200 400 600 800 1000 1200 1400 1600 1800 2000 2200 2400 2600 2800 3000 3200 3400 3600 3800 4000 420013 12, 5 -0, 1 12 time seconds Windsonic airflow m/s April 23, 2014 left col rate of condensation g/5 s 0, 2 Right Col condensation rate 3 per. Mov. Avg. (Windsonic airflow m/s) 0, 15 Airflow m/s 0, 50 3 per. Mov. Avg. (left col rate of condensation g/5 s) 0, 1 3 per. Mov. Avg. (Right Col condensation rate) 0, 05 0, 00 -0, 50 0 0 200 400 600 800 1000 1200 1400 1600 1800 2000 2200 -0, 05 -0, 1 1, 00 2400 2600 2800 3000 3200 3400 3600 3800 4000 -1, 00 4200 -1, 50 time seconds -2, 00
Pea Leaf Stoma, Vicea sp. (SEM x 3, 520). This image is copyright Dennis Kunkel at www. Dennis. Kunkel. com, used with permission.
Conclusions: 1. Empirical data points to the validity of the biotic pump theory, including data presented by Gorshkov and Makarieva showing that rainfall dies away exponentially with distance from the coast when river basins are without forest and the contrary state of affairs when a basin is well-forested from the coast to several thousand kilometres inland. 2. Surface humidity is dependent on adequate forest and it would seem that without deep-rooting trees and a closed-canopy, vegetation cannot maintain a fundamental regulation of surface humidity, whereas the rainforest can. The biotic pump depends therefore on rainforest. 3. Data from Costa Rica shows correlations between surface humidity and prevailing windspeed. 4. The physical experiment provides observational evidence that the windspeed at the surface is contingent on a sufficiently high rate of condensation.
Thanks Illustration By Hannah Parathian