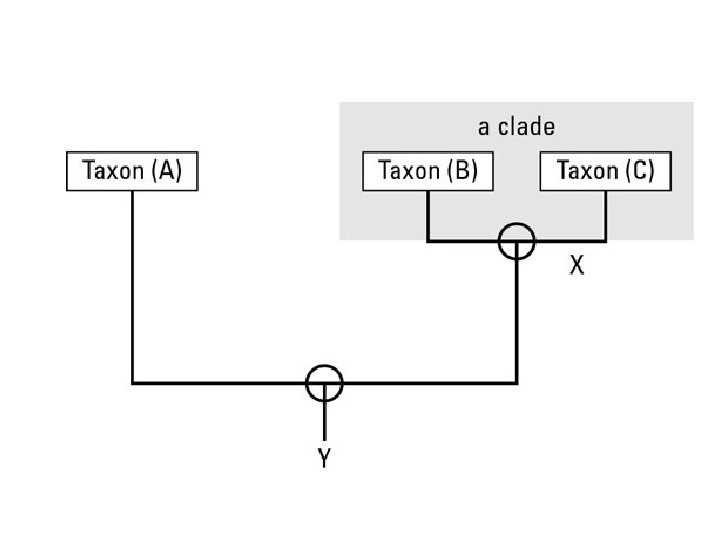
A phylogenetic tree represent hypothesis about evolutionary relationships

A phylogenetic tree represent hypothesis about evolutionary relationships Each dichotomous branch point represents the divergence of two species from a common ancestor

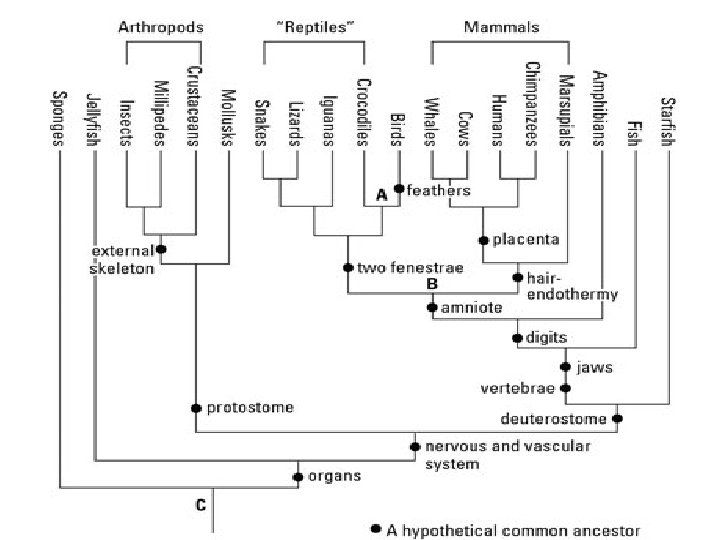
A cladogram is a phylogenetic tree that shows the pattern of homologous shared characteristics. (Ex 25. 4) - To determine the branching sequence of a group of related species, the group is compared to an outgroup, a species or group of species that is closely related to the group being studied. - Any homologies that are common to both the outgroup and the ingroup, the taxa to be grouped, are shared primitive characters that were present in an ancestor common to both groups.
 and \"1\" for derived (different from outgroup).")
Characters "0" for ancestral (same as outgroup) and "1" for derived (different from outgroup). Taxa 1 2 3 4 Outgrp O 0 0 A B C D 1 0 1 1 1 0 0 0 1 1 1 0

O A B C D According to this cladogram, C and D are most closely related because they…. .

A: Have the most shared derived characters in common

Below are some characteristics found among four groups of plants: Inversion in chloroplast DNA A + + + B + + + - C + + - - D + + - - Vascular system Seeds Movement to Land Presence of Chlorophyl l Flowers
 and \"1\"")
Give all characters a state of "0" for ancestral (same as outgroup) and "1" for derived (different from outgroup). Character 1. 2. 3. 4. 5. A B C D

Character 1. Eyes present 2. Spines present 3. Eyes on stalks 4. "Feet" present 5. Antennae present A 0 0 0 B 0 1 1 0 0 C 0 0 1 1 0 D 0 0 1 1 1
 and \"1\"")
Give all characters a state of "0" for ancestral (same as outgroup) and "1" for derived (different from outgroup). Character 1. Large jaws present 2. Small antennae present 3. Spots present 4. Stripes present A B C D

Character 1. Large jaws present 2. Small antennae present 3. Spots present 4. Stripes present A B C D
 Species")
Percentage Similarity Between the GAPDH (Gene and Protein in Humans and Other Species) Species Gene % Similarity Chimpanzee Dog Fruit Fly Roundworm 99. 6% 91. 3% 72. 4% 68. 2% Protein Percentage Simliarity 100% 95. 2% 76. 7% 74. 3%

Species Percentage Similarity in Nucleotide Sequence Chimpanzee Baboon Rabbit Rhesus Monkey Orangutan 99. 7 97. 2 93. 7 96. 9 98. 6

# nucleotide difference between species Species 1 1 2 3 4 5 2 3 - 3 19 19 - 4 18 18 1 - 5 27 26 27 27 -
- Slides: 15