A Normalized Poisson Model for Recognition Memory Chad


 “New” “Old” New Items Lures Memory Strength")
 1+2+3 1+2 1 : Strong Memory")


 •")


")

")


 Mixing: k Criteria: n* Oscillation: o")
")


,")

")


 > Var(E 1) Averaging: Var(E 2)")


- Slides: 50
A Normalized Poisson Model for Recognition Memory Chad Dubé
Recognition Memory • Study: car, dog, apple, table • Test: car, ball, apple, office • Old/New decision “Old” “New” Old Hit Rate Miss Rate New False Alarm Rate Correct Rejections
Signal Detection Theory (Green & Swets, 1966) “New” “Old” New Items Lures Memory Strength Old Items Targets
Ratings-Based Receiver Operating Characteristics (ROCs) 1+2+3 1+2 1 : Strong Memory
SDT and ROCs 1+2+3 1+2 1, Strong Memory 6 5 4 3 2 1
SDT and ROCs 6 5 1, Strong Memory 4 3 2 1
SDT and ROCs 1+2 1, Strong Memory 6 5 4 3 2 1
Some Strengths of SDT • A priori prediction for shape of ROCs • 2 AFC Theorem (Green & Swets, 1966) • Easy to implement • Minimal processing assumptions
Some Weaknesses • Biologically implausible • Requires edge corrections • Limited range of predictions
What should a detection model incorporate? • Output of contextual retrieval (Bower, 1972) • Criterion and/or distribution shifting (Treisman & Williams, 1984) • Principled explanation for nonunit z. ROC slopes (Wixted, 2007) • A more plausible x-axis • Psychophysical regularities
What should a detection model incorporate? • Fechner-Weber Saturation • What does the brain do?
How Do Neurons Code Stimulus Magnitude?
How Do Neurons Code Stimulus Magnitude? • Spike rates increase with stimulus magnitude (Granit, 1955; Kandel et al. , 2000) • Spike rate approx. Poisson distributed (Ma, 2010; Gabbiani & Cox, 2010) • Mean (which is ≈ Var) spike rate shows nonlinear saturation!
How Do Neurons Code Stimulus Magnitude? Cf. Carandini and Heeger (2012)
Divisive Normalization https: //www. youtube. com/watch? v=_N 23 j. FSrouo&app=desktop
Divisive Normalization Canonical? (Spikes/s)
Divisive Normalization
Divisive Normalization
Normalized Poisson Model (NPM) Mixing: k Criteria: n* Oscillation: o
Normalized Poisson Model (NPM)
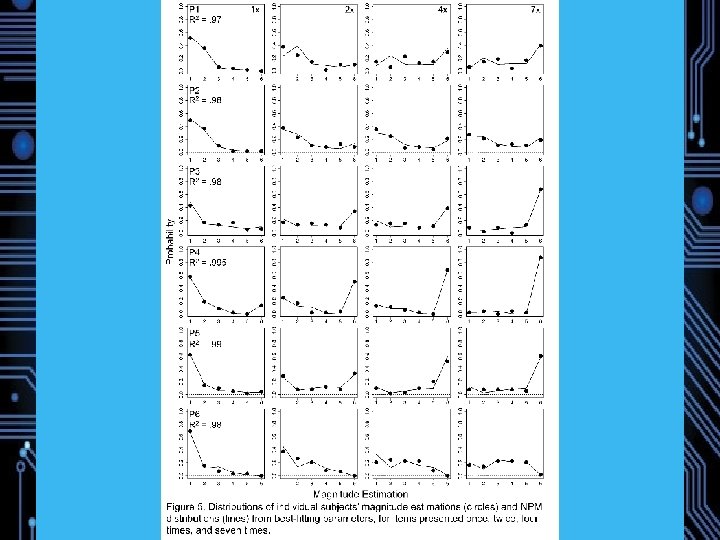
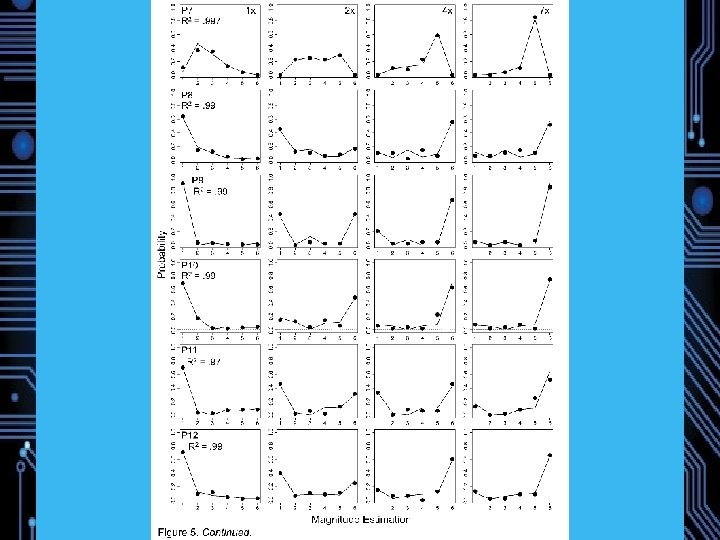
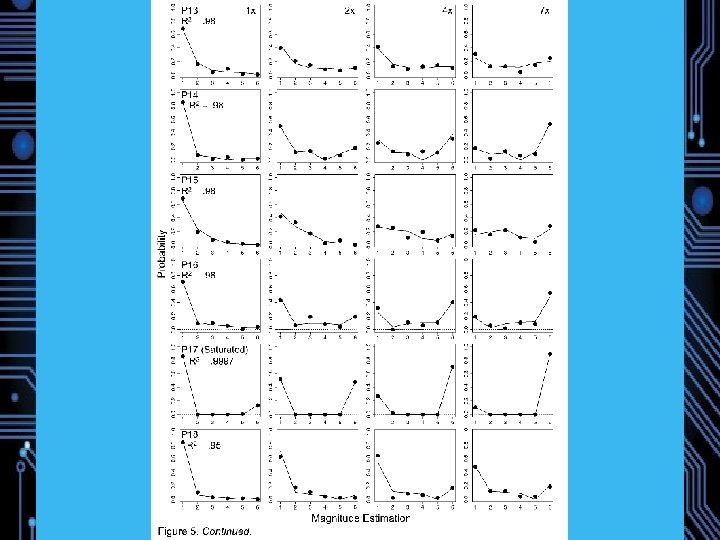
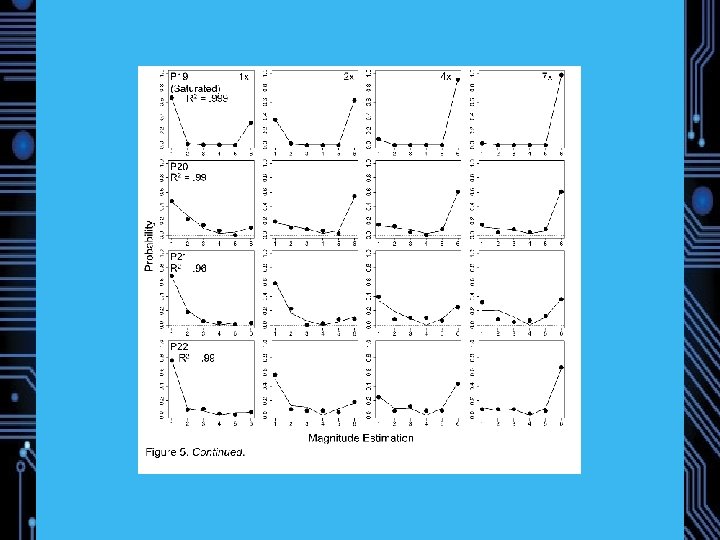
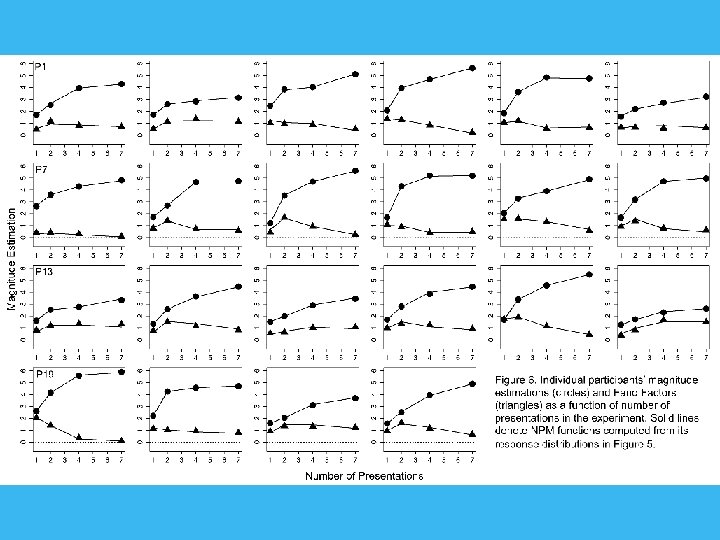
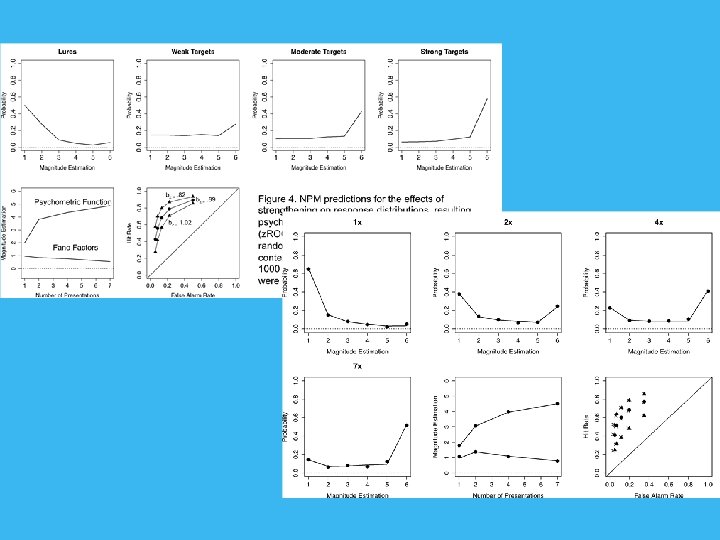
NPM Simulated Data
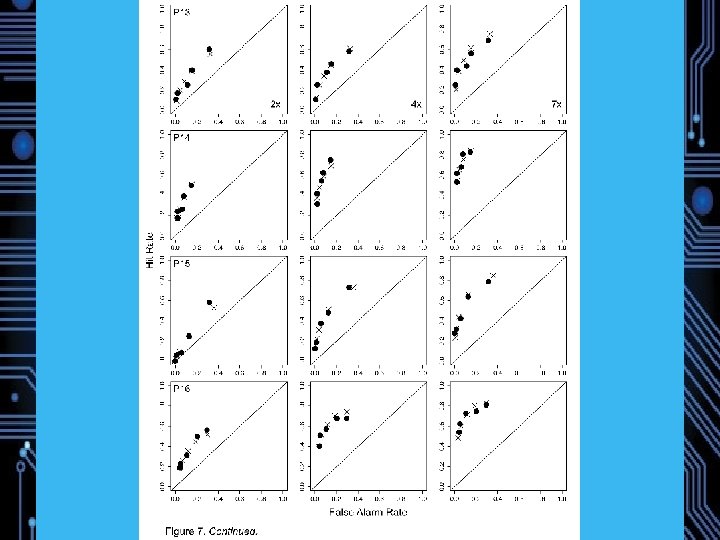
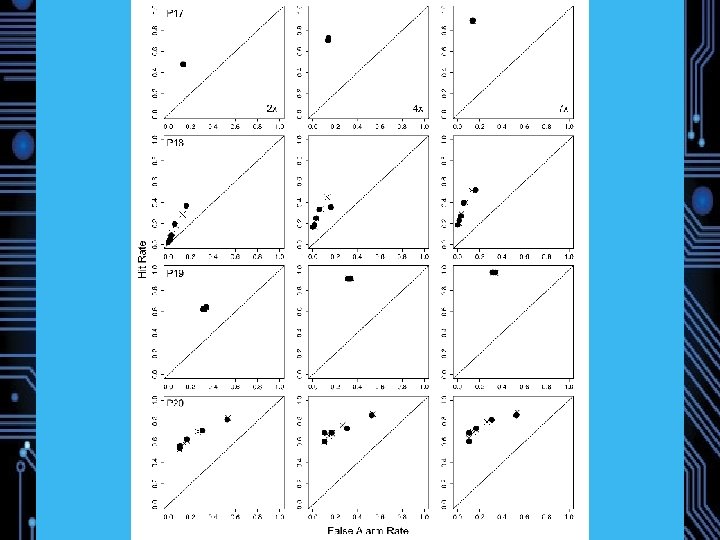
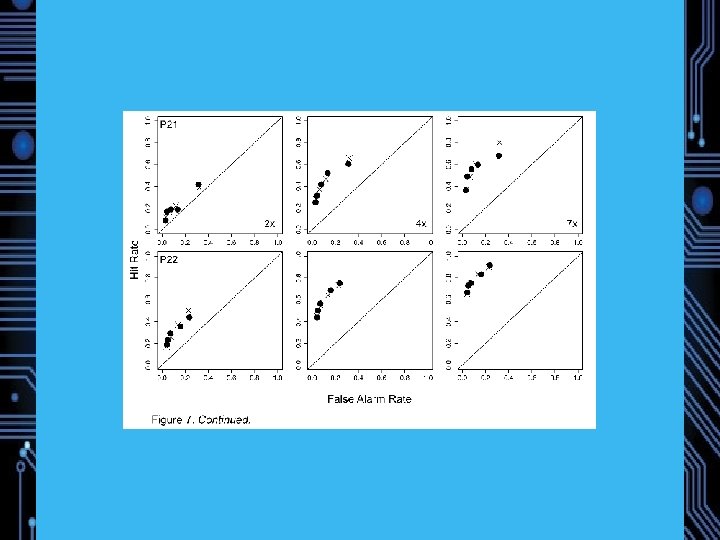
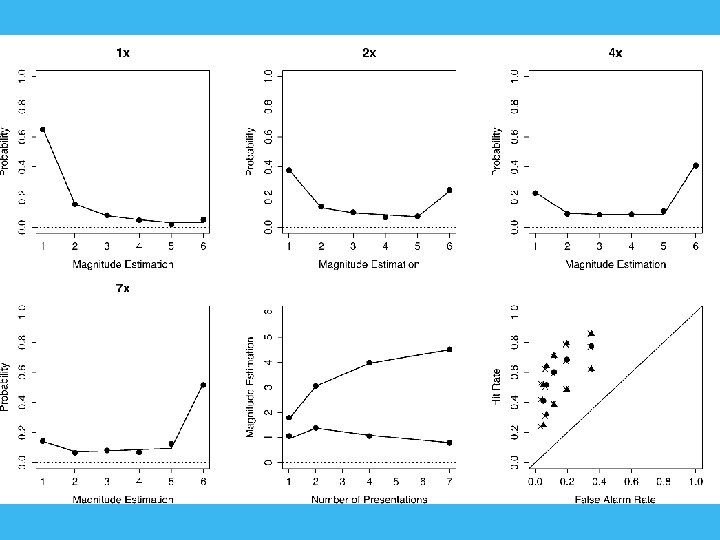
Experiment 1: Magnitude Estimation of Memory Strength 22 Participants Study: 72 words, 24 1 x, 24 3 x, 24 6 x (240 trials total) Test: 72 Targets, 72 Lures DV: Direct Strength Rating from 1 (no memory) to 6 (strong memory) Predictions: Weber-Fechner saturation, Fano Factors near 1 Model comparison
Model Recovery Simulations 100 simulated datasets from each model, random parameters, . 05 noise “A model with more parameters will always provide a better fit, all other things being equal (Linhart & Zucchini, 1986), ” Myung and Pitt (2002).
Counfound? Implicitly doing JOFs? z. ROC slope from JOFs reliably > 1 (Hintzman, 2004), but confidence rating slopes typically < 1 (Ratcliff, Mc. Koon, & Tindall, 1994) Data: Slope =. 78
Divisive Normalization
Divisive Normalization Zoccolan, Cox, and Di. Carlo (2005; JON)
Summary Statistical Representation Like normalization? Demonstrated for visual perception and memory tasks involving: Spatial arrays Sequentially-presented stimuli Motion, multiple-object tracking, change detection, RSVP, Sternberg scanning, etc. Both vision and audition Low decay rate Adaptive Obligatory
Summary Statistical Representation
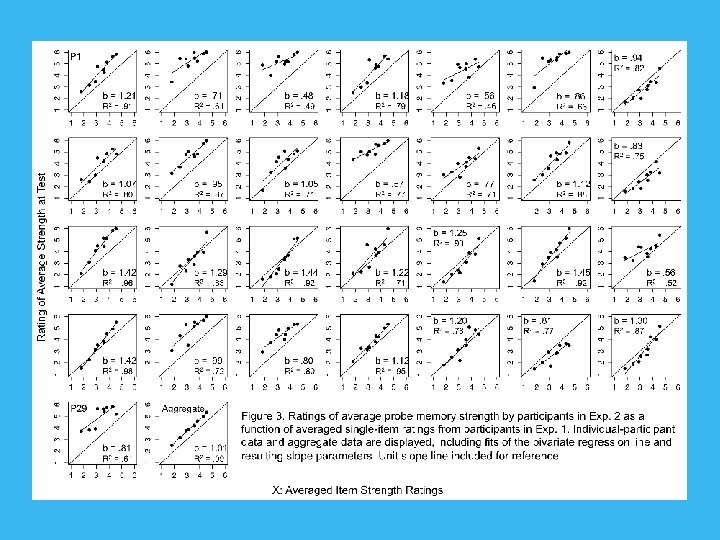
Experiment 2: Summary Statistical Representation of Memory Strength 29 Participants Study: 72 words, 24 1 x, 24 3 x, 24 6 x (240 trials total) Test: 72 Targets, 72 Lures Presented in pairs, with all combinations of repetitions DV: Direct Strength Rating of Average Strength from 1 (no memory) to 6 (strong memory) Predictions: DV =. 5*(Summed Rating) + bias
Averaged Item Strength Rating of Average Strength at Test
Counfounds? Summed the item strengths? Summation: Var(E 2) > Var(E 1) Averaging: Var(E 2) ≈ Var(E 1)/2 Data: Var(E 2)/Var(E 1) =. 83 Subsampled one item? Subsampling: SD increase with difference in number of repetitions within pairs Data: [1, 1]: 1. 62 [1, 3]: 1. 76 [1, 4]: 1. 68 [1, 7]: 1. 67
Summary NPM is an advance over SDT: Principled, a priori account of Fano Factors, Weber -Fechner saturation, ROC asymmetry, and mirror effects. Greater plausibility No edge corrections! Summary statistical representation extends to long-term memory strength Results suggest neurons that support recognition memory share the properties of visual cortical cells
Acknowledgments
Thanks!