A New Nonvolatile Residue Monitor for the Semiconductor


")


 Parameters monitored were")

- Slides: 20
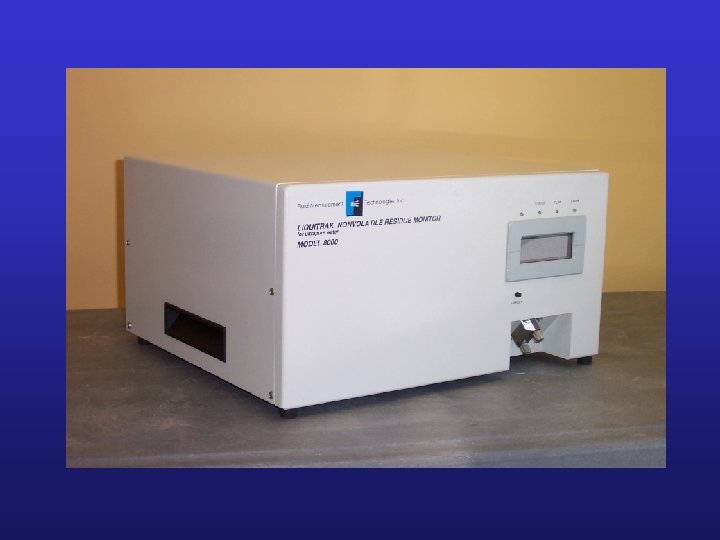
A New Nonvolatile Residue Monitor for the Semiconductor Industry By David Blackford Ph. D. Fluid Measurement Technologies
Questions about Nonvolatile Residue • What exactly is nonvolatile residue? • Why do I need to measure it? • What good is it if you can’t tell me what the residue consists of? • And so far I have managed perfectly well without measuring NVR, so why should I start now?
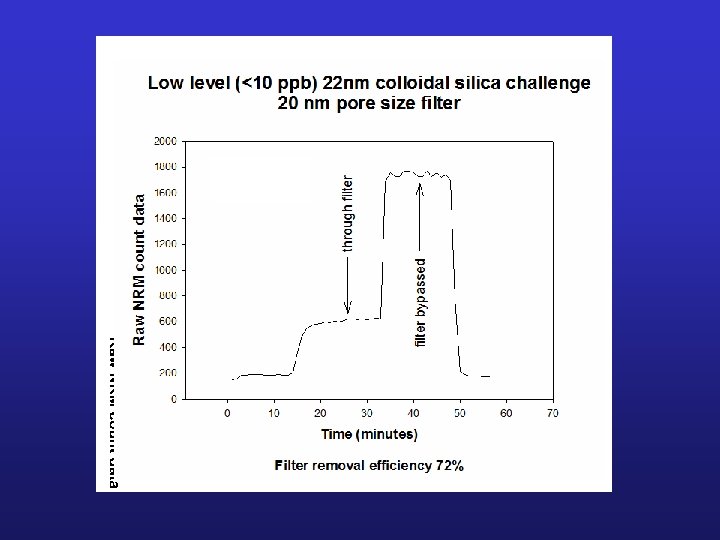
What exactly is nonvolatile residue? Nonvolatile residue is dissolved inorganic material. • Primarily silica, both dissolved and colloidal. • Also ions and trace metals. Nonvolatile residue is not. • Particles.
Why do I need to measure NVR? Nonvolatile Residue is increasingly being used as a measure of overall water quality. It is frequently the first on-line measurement to indicate a problem in a UPW system. Nonvolatile residue can now be monitored at ppt levels in almost real-time.
What good is NVR if you can’t tell me what the residue consists of? On-line TOC monitors and particle counters cannot identify the specific TOC compound or particle composition. BUT, speed is everything. The true value of on-line monitors comes from a fast indication of a problem. Then, you can collect and analyze a sample to identify the source of the contamination.
And so far I have managed perfectly well without measuring NVR, so why should I start now? As semiconductor line-widths become smaller, semiconductor manufacturing becomes more susceptible to contamination. As the ITRS Roadmap committee looks to the future, it is working to find parameters to measure at the required detection limits. So the day is coming when maybe you should consider monitoring NVR.
How the NRM was “born” • 20 years ago, Bob Mac. Intosh asked me if there was a way to get some response to the presence of colloidal silica in UPW. • In 1992 the original NRM was introduced. • The basic concept was not new. In 1964 two Australian professors had proposed using a nebulizer, a drying column and a particle counter to measure nonvolatile residue in solvents.
The original NVR nephelometer system (Salkowski and Werle, 1964)
Schematic for the new Nonvolatile Residue Monitor
The NRM technique
“Drip-counter” for measuring very low flow rates
Improvements over the original NRM • • Expanded measurement range, 1 ppt to 60 ppb. No more n-butyl alcohol. 10 x faster response time. 1/3 rd the weight and 2/3 rd the volume. Innovative water inlet flow monitor. Able to measure water up to 80 degrees centigrade. Universal power supply. Pressure actuated water regulator (no more water leaks).
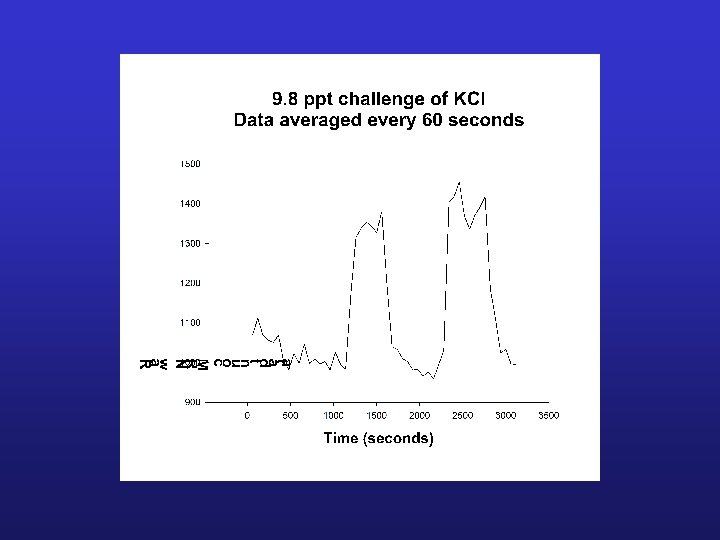
KCl challenges
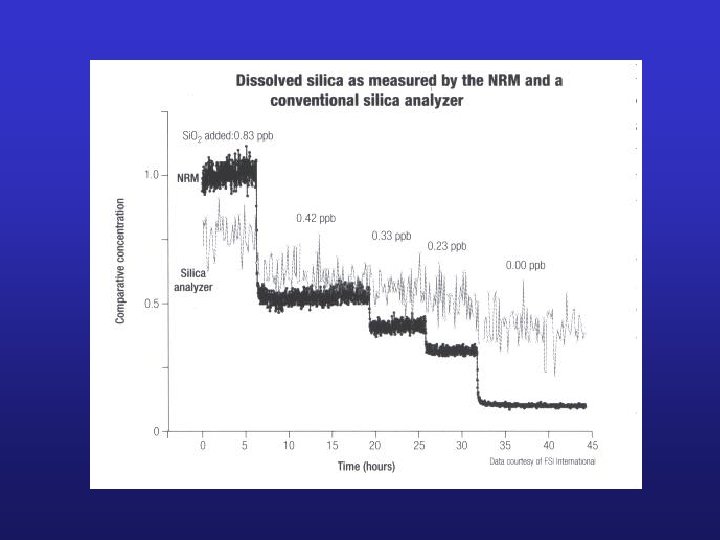
400 4 300 3 200 2 NVR 100 1 Si. O 2 0 0 4 pm 5 pm 6 pm 7 pm 8 pm 9 pm 10 pm 11 pm 12 pm 1 am 2 am 3 am 4 am 5 am 6 am Time Dissolved Silica (ppb) Nonvolatile Residue (ppt) US Semiconductor Facility Simultaneous data collected for the NRM and a Hach Silica Monitor
2007 ITRS “Round Robin” Data collected at Point of Entry (POE) Parameters monitored were particles by SEM, TOC An/Cat and TM, DO and DN and NVR. Average NVR data for UPW collected over 3 days Site A 245 ppt Site B 243 ppt Site C Site D 199 ppt 156 ppt Site E 102 ppt Site F 96 ppt
Conclusions The new Nonvolatile Residue Monitor offers improved contamination measurement of UPW: • Expanded measurement range. • Smaller, lighter, faster. • Knocking at the door of ppq.