A New Global Cryosphere Map Goal Update the

A New Global Cryosphere Map Goal: Update the classic cryosphere map below with new data, more data, and interactive capabilities.
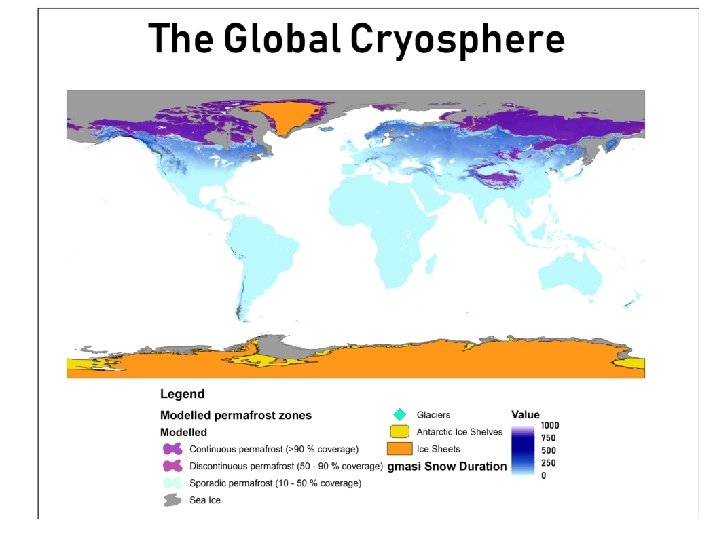


Data Sources Cryosphere Component Snow Sea Ice Variable Snow cover duration Ice edge/extent Data Source - POC Peter Romanov, CREST/CUNY National Ice Center Data Source - URL Data Source Publication ftp: //ftp. star. nesdis. noaa. gov/pub/smcd/ emb/snow/gmasi_reprocessing/snowdur ation/ https: //www. natice. noaa. gov/products/d aily_products. html Data Type Raster Shapefile Spatial Coverage Temporal Coverage Mean of 1988 -2017 Arctic and Antarctic Max extent - Arctic: 1 Mar 2012, Antarctic: 15 Sep 2014 Min extent - Arctic: 15 Sep 2012, Antarctic: 15 Feb 2018 These are specific days, not averages Will add this in the future Permafrost and Seasonally Frozen Ground Permafrost Zonation (PERZONES) is provided as ESRI shapefile. Permafrost zonation is the permafrost probability fraction reclassified to standard permafrost zonation of continuous, discontinuous and sporadic permafrost. The zone borders were simplified and smoothed. Annett Bartsch, ZAMG https: //doi. pangaea. de/10. 1594/PANGAE A. 888600? format=html#download (http: //store. pangaea. de/Publications/O bu. Jetal_2018/Ui. O_PEX_PERZONES_3. 0_201 71130. zip) Obu et al. , 2018 Shapefile Global 2000 -2016 Permafrost and Seasonally Frozen Ground Freeze/thaw, where ground has been frozen at least once during the time period Annett Bartsch, ZAMG and NSIDC https: //nsidc. org/data/nsidc 0477/versions/3 Shapefile Global 2000 -2016 Glaciers and Ice Caps Extent Frank Paul, UZH http: //www. glims. org/maps/glims Shapefile Alpine areas National Snow and Ice Data Center https: //www. naturalearthdata. com/dow nloads/110 m-physical-vectors/110 mglaciated-areas/ Ice Shelves Downloaded four different snow coverage years (1995, 2010, 2013, 2017), and could get none to open in Arc. Map; Must look for data elsewhere Global, ice-free land Lake and River Ice Sheets Comments Extent National Snow and Ice Data Center https: //www. naturalearthdata. com/dow nloads/50 m-physical-vectors/50 mantarctic-ice-shelves/ Shapefile Arctic and Antarctic Batzli Comments Cryosphere Component Downloaded the multi year mean data, imported into Arc. Map with Float-to-Raster after building a. hdr file based on readme file. Put "0" into No_Data value. but that made a 16 -bit image and lost the values so used QGIS to do the export and build a color table based on the. png file Snow Sea Ice Variable Data Source - POC Data Source - URL Publication Peter Romanov, CREST/CUNY Ice edge/extent https: //www. natic e. noaa. gov/produc ts/daily_products. National Ice Center html Shapefile Comments Global, ice-free land Mean of 19882018 Downloaded the multi year mean data, imported into Arc. Map with Float-to-Raster after building a. hdr file based on readme file. Put Downloaded four "0" into No_Data different snow value. but that coverage years made a 16 -bit (1995, 2010, 2013, image and lost the 2017), and could values so used get none to open QGIS to do the in Arc. Map; Must export and build a look for data color table based elsewhere on the. png file Arctic and Antarctic Max extent - Arctic: 1 Mar 2012, Antarctic: 15 Sep 2014 Min extent - Arctic: 15 Sep 2012, Antarctic: 15 Feb These are specific 2019 days, not averages Will add this in the future Permafrost and Seasonally Frozen Ground Some Southern Hemisphere areas are missing (may be included in 2019) Permafrost and Seasonally Frozen Ground Freeze/thaw, where ground has been frozen at least once during the time period Projected in Arc. Map as separate shape files per region Glaciers and Ice Caps Extent Frank Paul, UZH Antartic Raster Temporal Coverage Spatial Coverage Lake and River Ice Permafrost Zonation (PERZONES) is provided as ESRI shapefile. Permafrost zonation is the permafrost probability fraction reclassified to standard permafrost zonation of continuous, discontinuous and sporadic permafrost. The zone borders were simplified and Annett Bartsch, smoothed. ZAMG ~2017 -18 ftp: //ftp. star. nesdi s. noaa. gov/pub/sm cd/emb/snow/gma si_reprocessing/sn owduration/ Snow cover duration Data Type Ice Sheets Ice Shelves https: //doi. pangae a. de/10. 1594/PAN GAEA. 888600? for mat=html#downlo ad (http: //store. panga ea. de/Publications /Obu. Jetal_2018/Ui. O_PE X_PERZONES_3. 0_ 20171130. zip) Obu et al. , 2019 Shapefile Global 2000 -2016 https: //nsidc. org/d Annett Bartsch, ata/nsidc. ZAMG and NSIDC 0477/versions/4 Shapefile Global 2000 -2016 http: //www. glims. org/maps/glims Shapefile Alpine areas Extent https: //www. natur alearthdata. com/d ownloads/110 mphysical. National Snow and vectors/110 m. Ice Data Center glaciated-areas/ Shapefile Arctic and Antarctic Extent https: //www. natur alearthdata. com/d ownloads/50 mphysicalvectors/50 m. National Snow and antarctic-ice. Ice Data Center shelves/ Shapefile Antartic Some Southern Hemisphere areas are missing (may be included in 2019) Projected in Arc. Map as separate shape files per region ~2017 -19 References: Obu, Jaroslav; Westermann, Sebastian; Kääb, Andreas; Bartsch, Annett (2018): Ground Temperature Map, 2000 -2016, Northern Hemisphere Permafrost. Alfred Wegener Institute, Helmholtz Center for Polar and Marine Research, Bremerhaven, PANGAEA, https: //doi. org/10. 1594/PANGAEA. 888600. Batzli Comments

The Cryosphere in Real. Earth Interactive: Rotate, zoom, pan, probe values, layer different cryosphere components and other data

The Cryosphere in Real. Earth https: //re. ssec. wisc. edu/s/f. Yf. ZL
- Slides: 7