A new approach to measuring the provision of
- Slides: 12
A new approach to measuring the provision of Adult Social Care Measurement of non-market output in education and health. October 2006 UK Centre for the Measurement of Government Activity Jim Ebdon
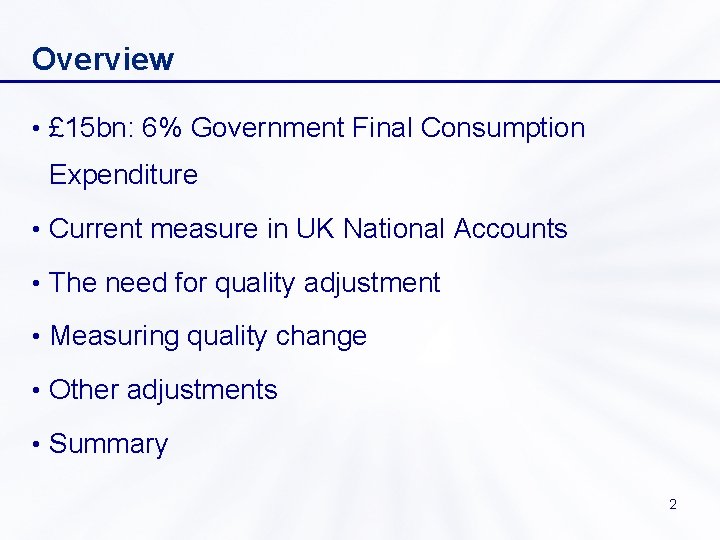
Overview • £ 15 bn: 6% Government Final Consumption Expenditure • Current measure in UK National Accounts • The need for quality adjustment • Measuring quality change • Other adjustments • Summary 2
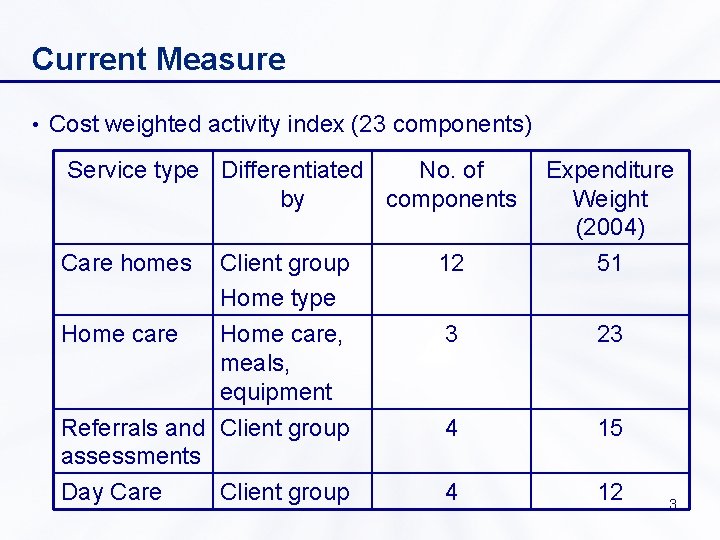
Current Measure • Cost weighted activity index (23 components) Service type Differentiated No. of by components Client group Home type Home care, meals, equipment 12 Expenditure Weight (2004) 51 3 23 Referrals and Client group assessments 4 15 Day Care 4 12 Care homes Home care Client group 3
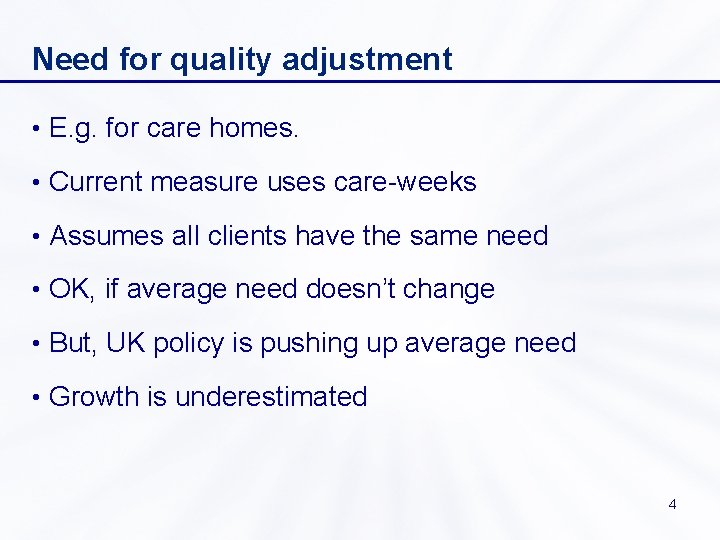
Need for quality adjustment • E. g. for care homes. • Current measure uses care-weeks • Assumes all clients have the same need • OK, if average need doesn’t change • But, UK policy is pushing up average need • Growth is underestimated 4
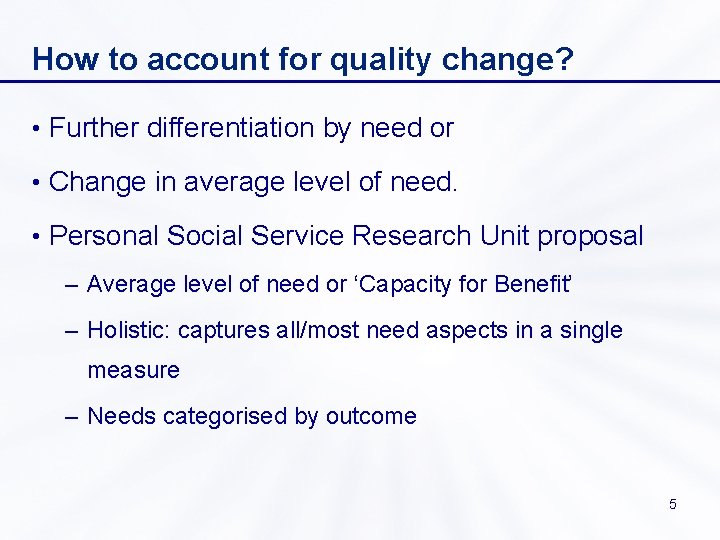
How to account for quality change? • Further differentiation by need or • Change in average level of need. • Personal Social Service Research Unit proposal – Average level of need or ‘Capacity for Benefit’ – Holistic: captures all/most need aspects in a single measure – Needs categorised by outcome 5
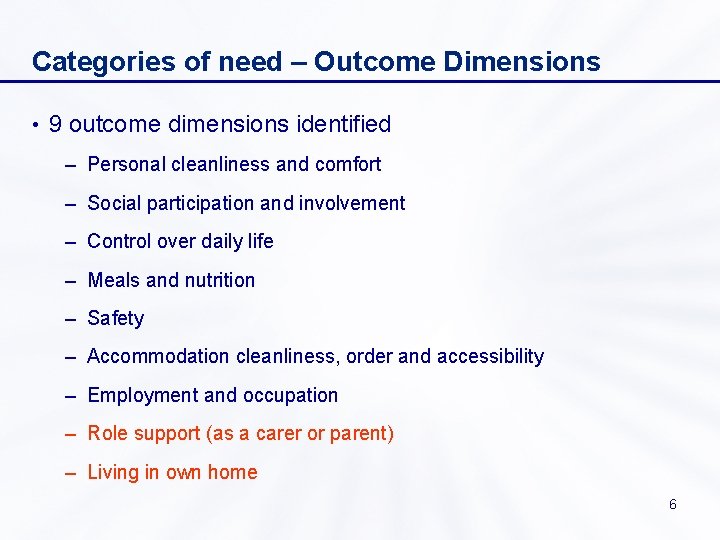
Categories of need – Outcome Dimensions • 9 outcome dimensions identified – Personal cleanliness and comfort – Social participation and involvement – Control over daily life – Meals and nutrition – Safety – Accommodation cleanliness, order and accessibility – Employment and occupation – Role support (as a carer or parent) – Living in own home 6
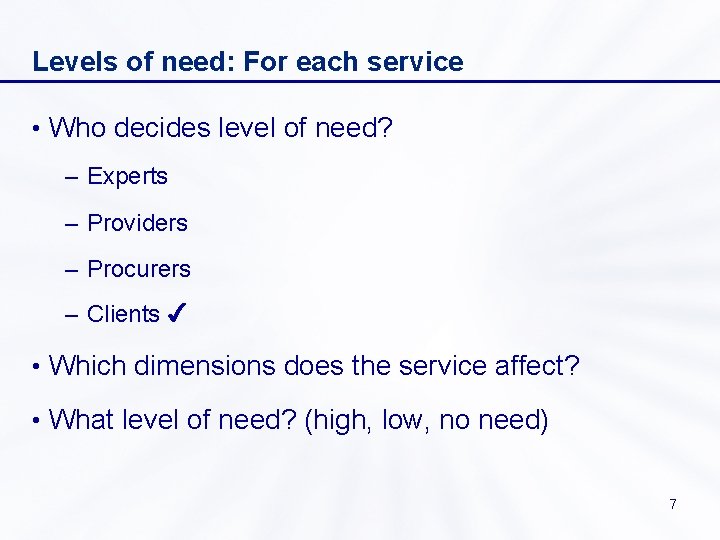
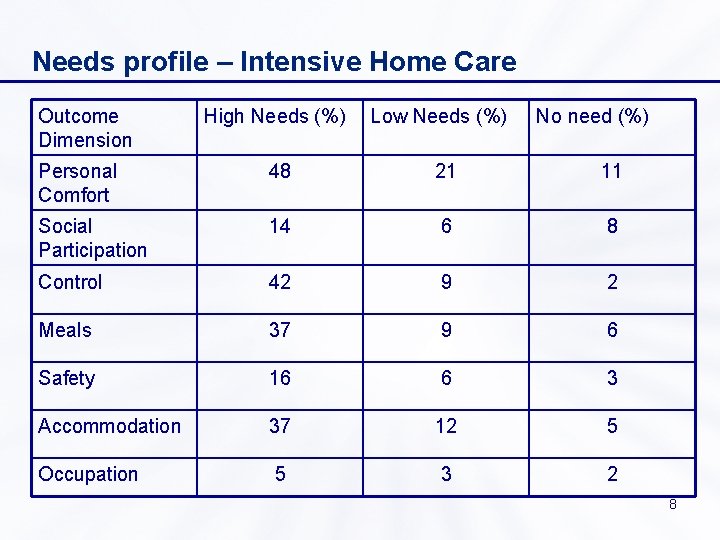
Levels of need: For each service • Who decides level of need? – Experts – Providers – Procurers – Clients • Which dimensions does the service affect? • What level of need? (high, low, no need) 7
Needs profile – Intensive Home Care Outcome Dimension High Needs (%) Low Needs (%) No need (%) Personal Comfort 48 21 11 Social Participation 14 6 8 Control 42 9 2 Meals 37 9 6 Safety 16 6 3 Accommodation 37 12 5 Occupation 5 3 2 8
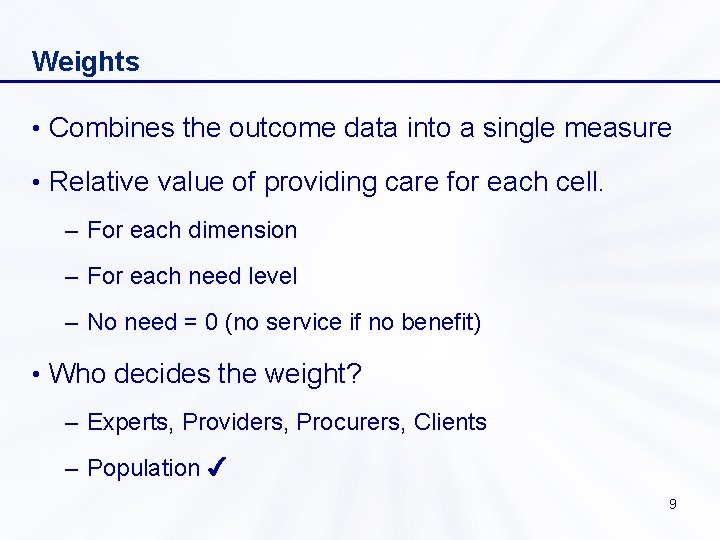
Weights • Combines the outcome data into a single measure • Relative value of providing care for each cell. – For each dimension – For each need level – No need = 0 (no service if no benefit) • Who decides the weight? – Experts, Providers, Procurers, Clients – Population 9
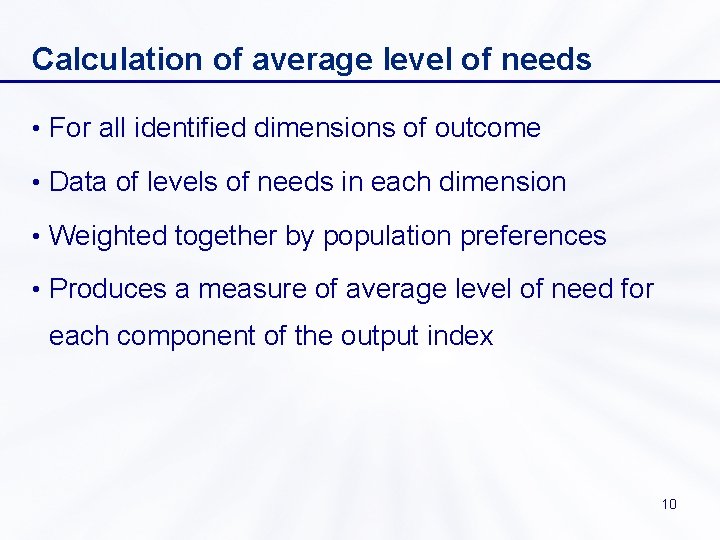
Calculation of average level of needs • For all identified dimensions of outcome • Data of levels of needs in each dimension • Weighted together by population preferences • Produces a measure of average level of need for each component of the output index 10
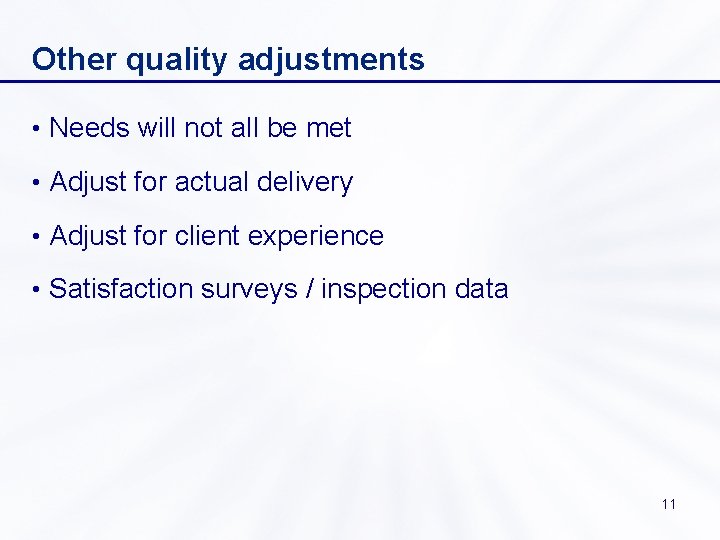
Other quality adjustments • Needs will not all be met • Adjust for actual delivery • Adjust for client experience • Satisfaction surveys / inspection data 11
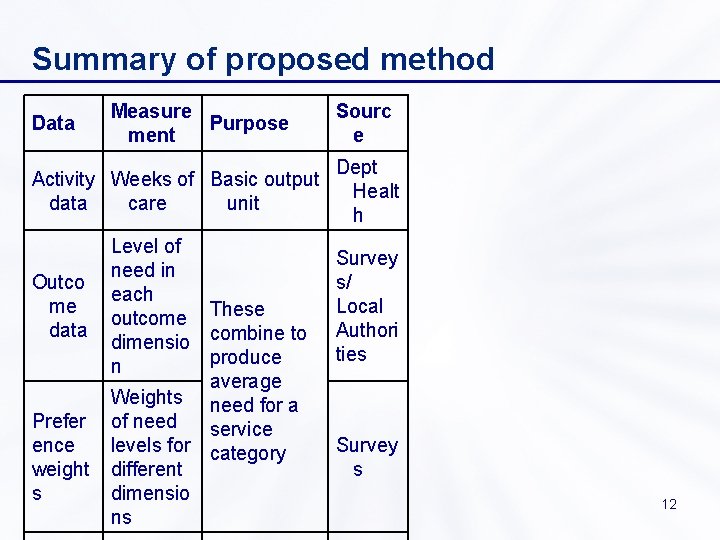
Summary of proposed method Data Measure Purpose ment Activity Weeks of Basic output data care unit Outco me data Prefer ence weight s Level of need in each outcome These dimensio combine to produce n average Weights need for a of need service levels for category different dimensio ns Sourc e Dept Healt h Survey s/ Local Authori ties Survey s 12