A Network Approach to Measuring Stability in Predictive

A Network Approach to Measuring Stability in Predictive Learning Contributors: many (wait for the last slide) Presenters: Talia Waltzer & Heidi Kloos University of Cincinnati

Predictive Learning • Which one sinks faster?

Feedback: and the winner was…

Method: procedure Pre-test Feedback 1 2 45 trials Predict + Feedback 3 Feedback 4 Post-test 1 Post-test 2 45 trials Predict + Feedback Predict

Method: procedure Pre-test Feedback 1 2 45 trials Predict + Feedback 3 Feedback 4 Post-test 1 Post-test 2 45 trials Predict + Feedback Predict L/R

Materials • 5 types of pairs Small wins Big/heavy wins = winner Heavy wins Small/heavy wins Small/light wins

Materials • 5 types of pairs Small wins Big/heavy wins = winner Heavy wins Small/heavy wins Small/light wins Two conditions: Even vs. uneven distribution of trials

Children’s Accuracy

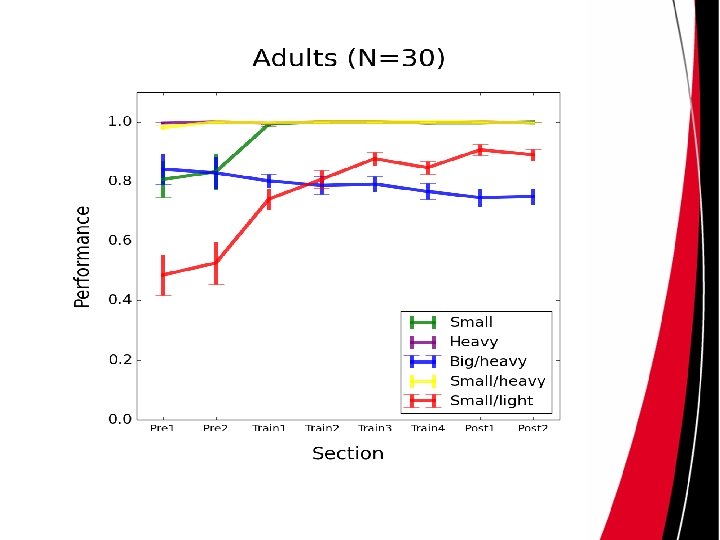
Method: Adults Pre-test Feedback 1 2 45 trials Predict + Feedback 3 Feedback 4 Post-test 1 Post-test 2 45 trials Predict + Feedback Predict Explanation L/R Why?

Method: Adults Pre-test Feedback 1 2 45 trials Predict Explanation 45 trials Predict + Feedback 3 Feedback 4 Post-test 1 Post-test 2 45 trials Predict + Feedback Predict …. Explanation 8 …. L/R Why?

Performance grouped by verbal responses

Summary of Results • Evidence of Learning • Emergence of something: Beliefs – no top-down control • Individual trial events Overarching pattern Open Question: Under which circumstances does this happen?

Some Answers One needs: • Massive interaction potential between units • Advantage for cooperation among units • Opportunity for persistence Questions: – What are the interacting units? – Relation between cooperation and competition? – Relation between persistence and flexibility?

Flow-Network Approach • Networks have properties of emergence • Networks persist over time • Order can be described without knowledge about components (1) Potential for interactions, (2) advantage for cooperation, (3) enough food to persist

Applied to Predictive Learning Performance 2 Task Performance 1 Performance 3 Performance 4 Which one sinks fastest? Variations in mass, volume, etc.
 • Average Mutual Information (AMI)")
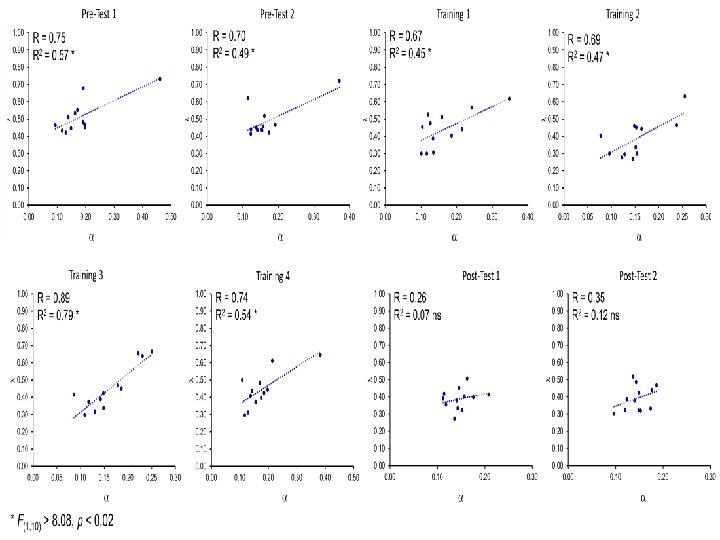
Measuring Stability • Statistical Uncertainty of an Event (H) • Average Mutual Information (AMI) • Degree of Order (α = AMI/H)
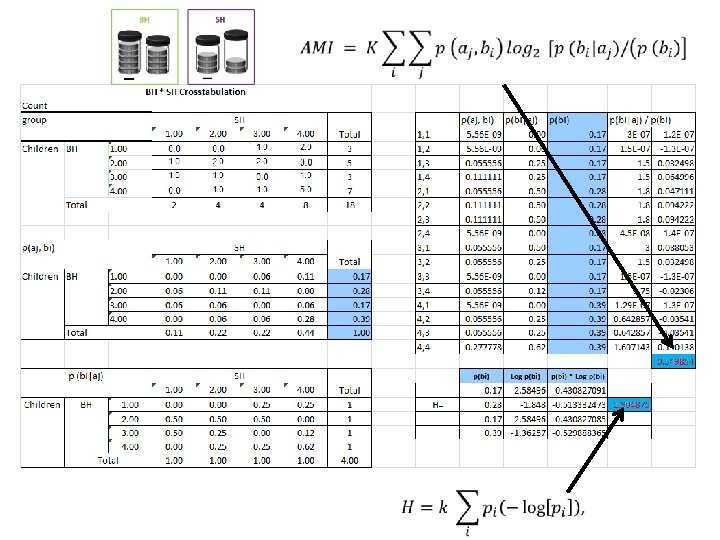
![Children [Post-Training] DWSS H = 1. 91 AMI = 0. 73 . 44 AMI](http://slidetodoc.com/presentation_image_h2/5cf4fcf0026105eaa85e1359a96b7d0f/image-19.jpg "Children [Post-Training] DWSS H = 1. 91 AMI = 0. 73 . 44 AMI")
Children [Post-Training] DWSS H = 1. 91 AMI = 0. 73 . 44 AMI = 0. 25 AM 82 AMI = 0. 48 AM I =0 . 78 = MI A SH H = 1. 83 Degree of Order: α = AMI/H BH H = 1. 90 I=. I=0 AM SWDS H = 1. 95 AMI = 0. 46 0. 5 5 SL H = 1. 95 AMI = 0. 33 Principle Component Analysis: % of variance explained by the first dimension: λ AMI = 0. 51
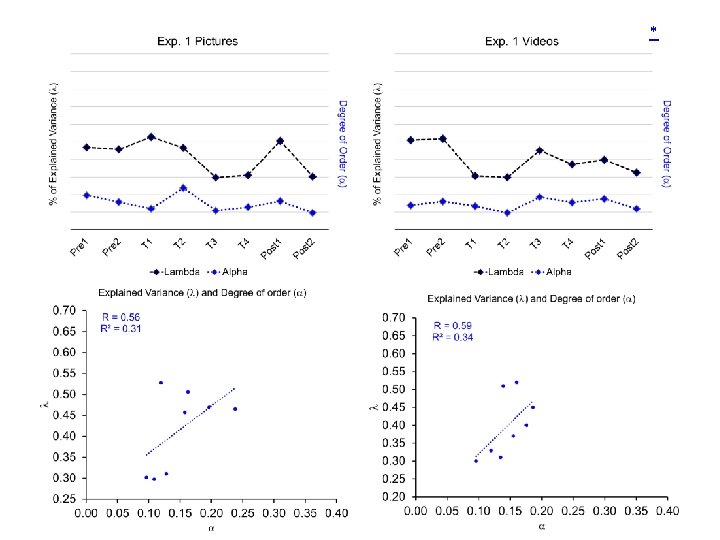

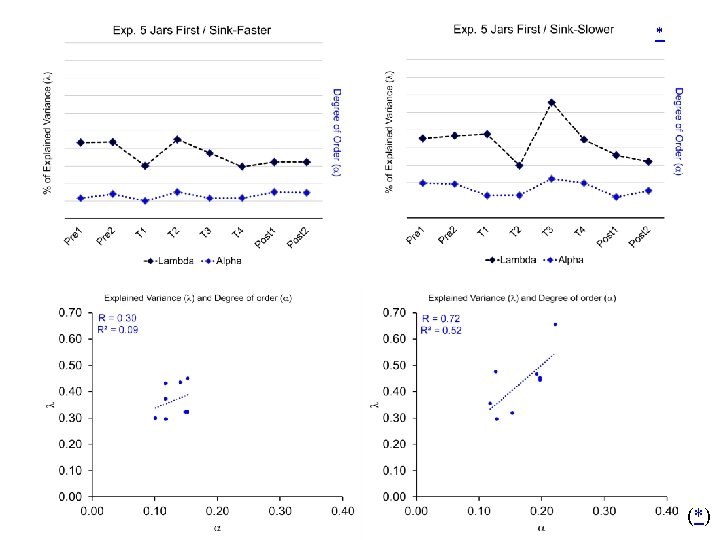
Even-distribution *

Uneven-distribution *

Children *

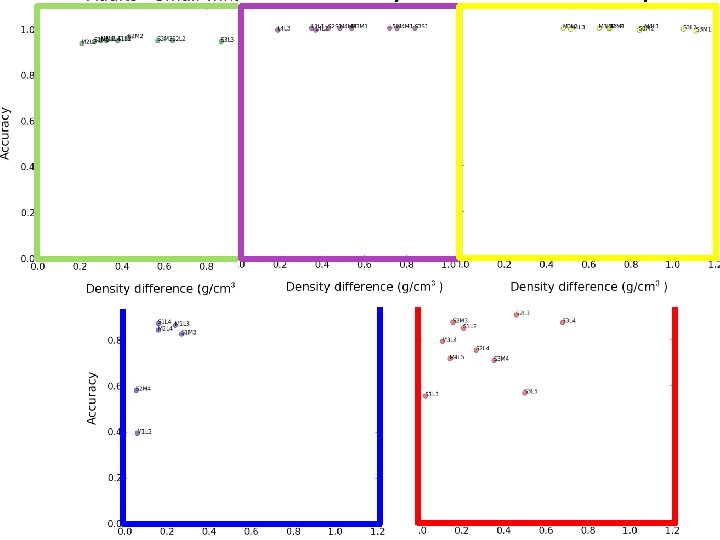
Groups vs. Individuals

Groups vs. Individuals The problem is:

Contributors Ramon Castillo, University of Talca Mike Richardson, Jay Holden, Tony Chemero, U. of Cincinnati Ashley Walton, Charles Coey, U. of Cincinnati

3 problem trials excluded
- Slides: 30