
A MODULE DecisionMaking Tools Power Point presentation to


- Slides: 34
A MODULE Decision-Making Tools Power. Point presentation to accompany Heizer and Render Operations Management, Eleventh Edition Principles of Operations Management, Ninth Edition Power. Point slides by Jeff Heyl © 2014 Pearson Education, Inc. © 2014 Pearson Education, MA - 1
Outline ► ► ► The Decision Process in Operations Fundamentals of Decision Making Decision Tables Types of Decision-Making Environments Decision Trees © 2014 Pearson Education, Inc. MA - 2
Learning Objectives When you complete this chapter you should be able to: 1. Create a simple decision tree 2. Build a decision table 3. Explain when to use each of the three types of decision-making environments 4. Calculate an expected monetary value (EMV) © 2014 Pearson Education, Inc. MA - 3
Learning Objectives When you complete this chapter you should be able to: 5. Compute the expected value of perfect information (EVPI) 6. Evaluate the nodes in a decision tree 7. Create a decision tree with sequential decisions © 2014 Pearson Education, Inc. MA - 4
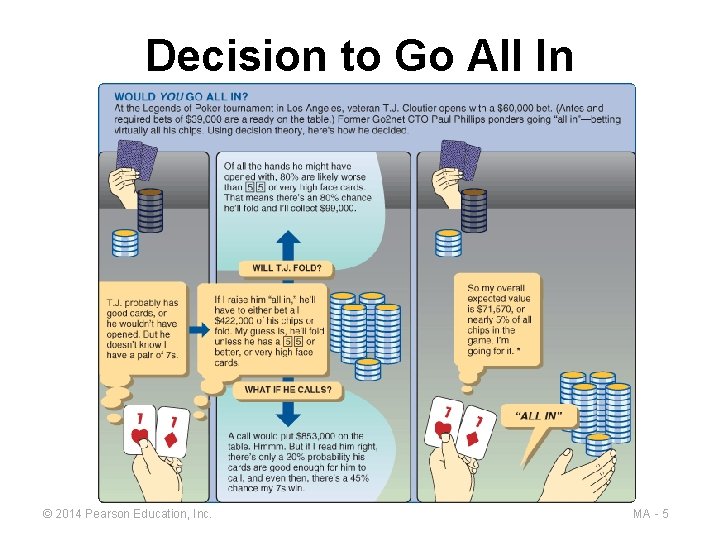
Decision to Go All In © 2014 Pearson Education, Inc. MA - 5
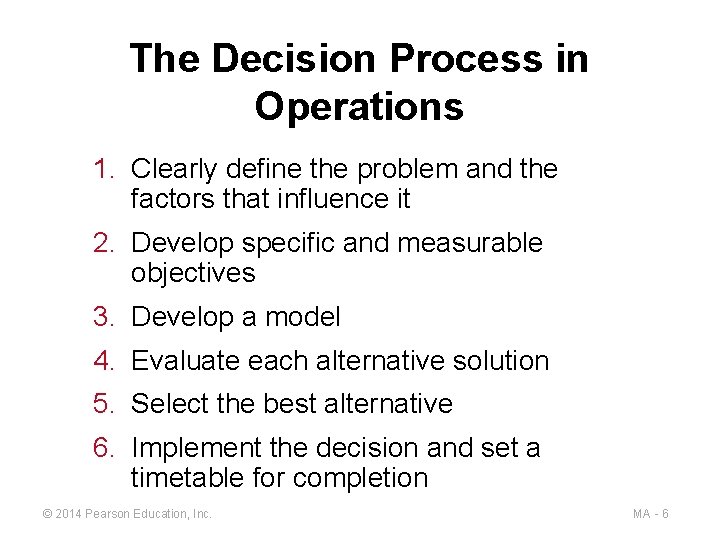
The Decision Process in Operations 1. Clearly define the problem and the factors that influence it 2. Develop specific and measurable objectives 3. Develop a model 4. Evaluate each alternative solution 5. Select the best alternative 6. Implement the decision and set a timetable for completion © 2014 Pearson Education, Inc. MA - 6
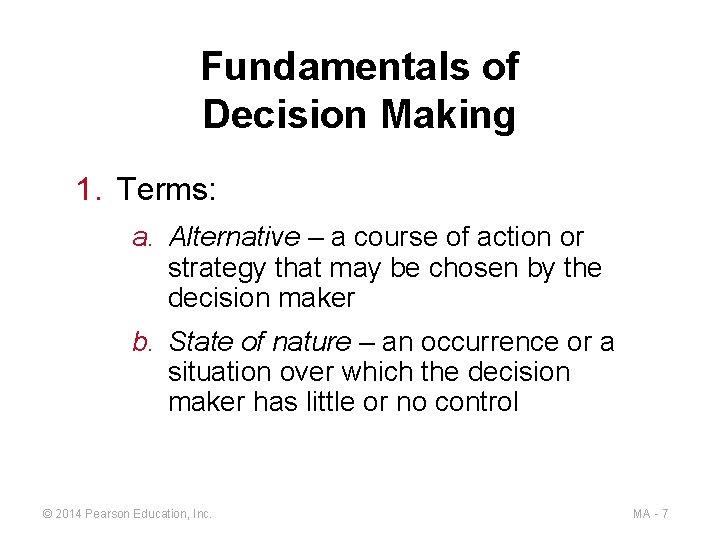
Fundamentals of Decision Making 1. Terms: a. Alternative – a course of action or strategy that may be chosen by the decision maker b. State of nature – an occurrence or a situation over which the decision maker has little or no control © 2014 Pearson Education, Inc. MA - 7
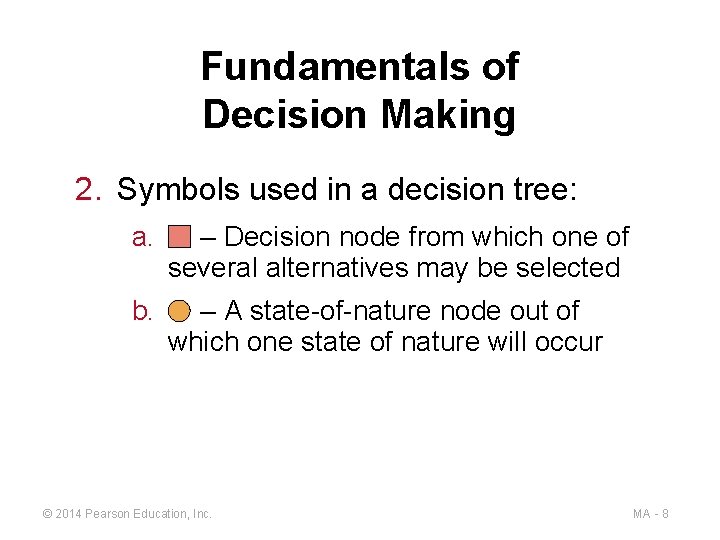
Fundamentals of Decision Making 2. Symbols used in a decision tree: a. – Decision node from which one of several alternatives may be selected b. – A state-of-nature node out of which one state of nature will occur © 2014 Pearson Education, Inc. MA - 8
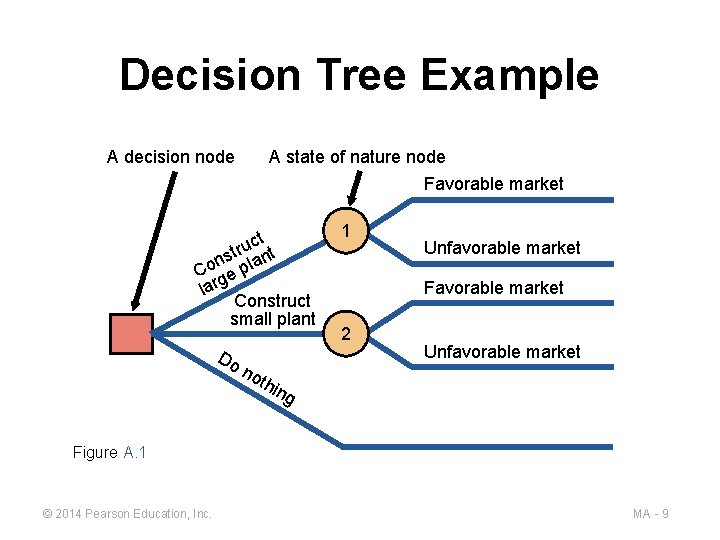
Decision Tree Example A decision node A state of nature node Favorable market uct t r t ns plan o C ge lar Construct small plant Do no 1 Unfavorable market Favorable market 2 Unfavorable market thi ng Figure A. 1 © 2014 Pearson Education, Inc. MA - 9
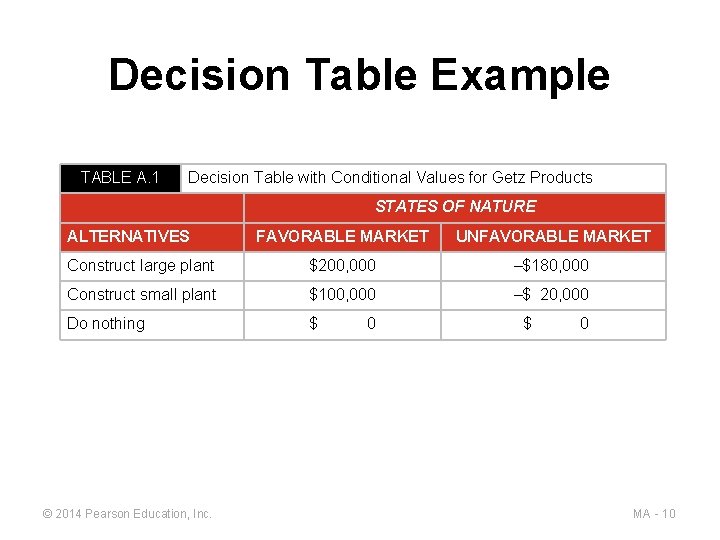
Decision Table Example TABLE A. 1 Decision Table with Conditional Values for Getz Products STATES OF NATURE ALTERNATIVES FAVORABLE MARKET UNFAVORABLE MARKET Construct large plant $200, 000 –$180, 000 Construct small plant $100, 000 –$ 20, 000 Do nothing $ © 2014 Pearson Education, Inc. 0 $ 0 MA - 10
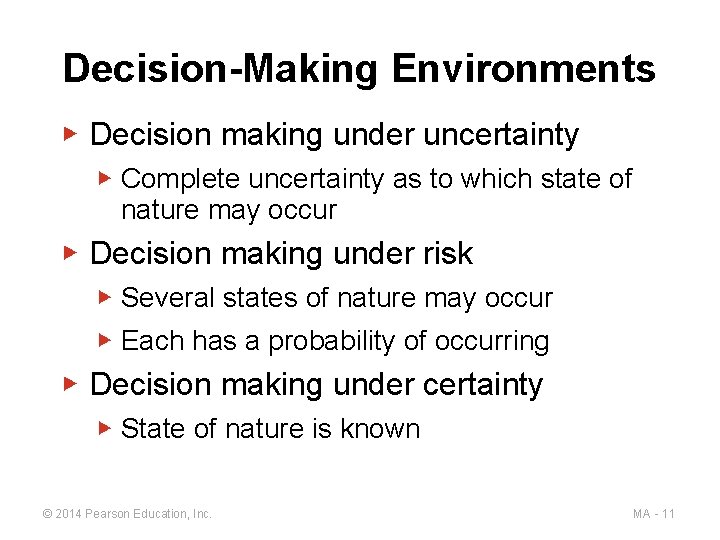
Decision-Making Environments ▶ Decision making under uncertainty ▶ Complete uncertainty as to which state of nature may occur ▶ Decision making under risk ▶ Several states of nature may occur ▶ Each has a probability of occurring ▶ Decision making under certainty ▶ State of nature is known © 2014 Pearson Education, Inc. MA - 11
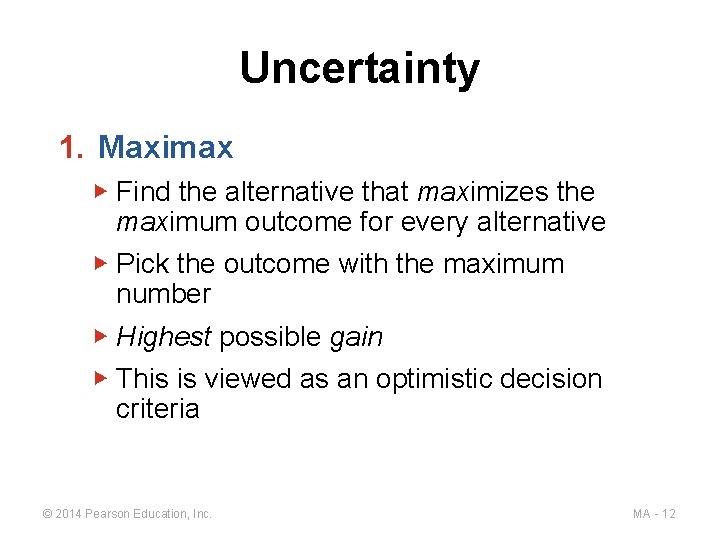
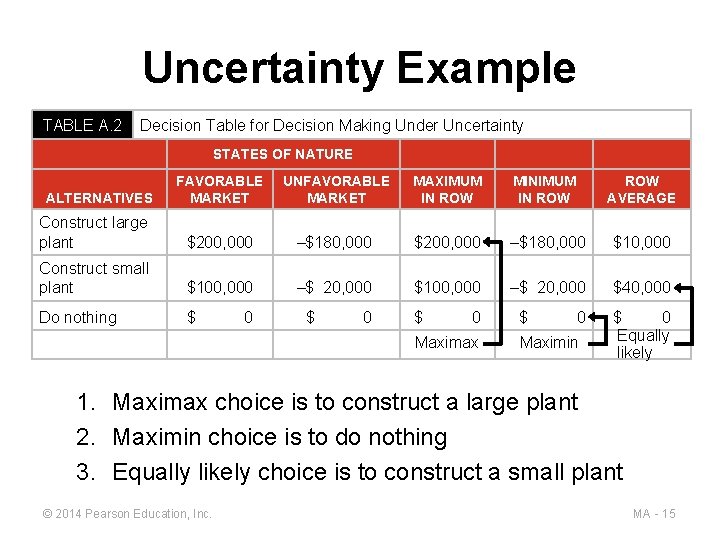
Uncertainty 1. Maximax ▶ Find the alternative that maximizes the maximum outcome for every alternative ▶ Pick the outcome with the maximum number ▶ Highest possible gain ▶ This is viewed as an optimistic decision criteria © 2014 Pearson Education, Inc. MA - 12
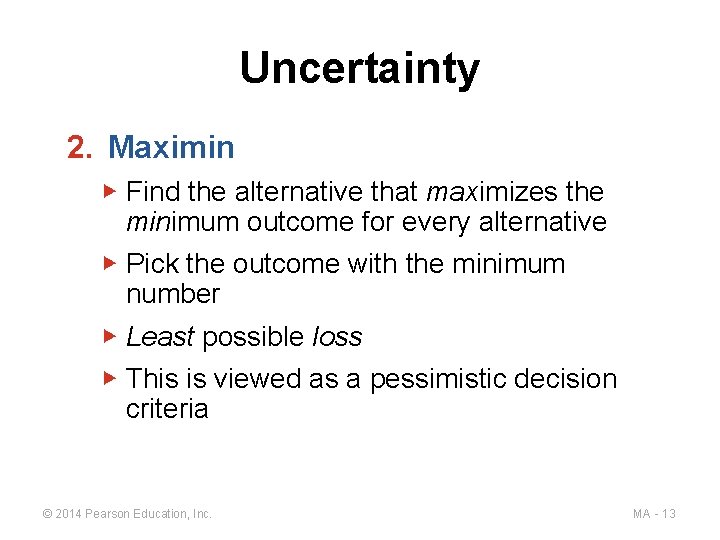
Uncertainty 2. Maximin ▶ Find the alternative that maximizes the minimum outcome for every alternative ▶ Pick the outcome with the minimum number ▶ Least possible loss ▶ This is viewed as a pessimistic decision criteria © 2014 Pearson Education, Inc. MA - 13
Uncertainty 3. Equally likely ▶ Find the alternative with the highest average outcome ▶ Pick the outcome with the maximum number ▶ Assumes each state of nature is equally likely to occur © 2014 Pearson Education, Inc. MA - 14
Uncertainty Example TABLE A. 2 Decision Table for Decision Making Under Uncertainty STATES OF NATURE FAVORABLE MARKET UNFAVORABLE MARKET MAXIMUM IN ROW MINIMUM IN ROW AVERAGE Construct large plant $200, 000 –$180, 000 $10, 000 Construct small plant $100, 000 –$ 20, 000 $40, 000 Do nothing $ ALTERNATIVES 0 $ 0 Maximax $ 0 Maximin $ 0 Equally likely 1. Maximax choice is to construct a large plant 2. Maximin choice is to do nothing 3. Equally likely choice is to construct a small plant © 2014 Pearson Education, Inc. MA - 15
Decision Making Under Risk ▶ Each possible state of nature has an assumed probability ▶ States of nature are mutually exclusive ▶ Probabilities must sum to 1 ▶ Determine the expected monetary value (EMV) for each alternative © 2014 Pearson Education, Inc. MA - 16
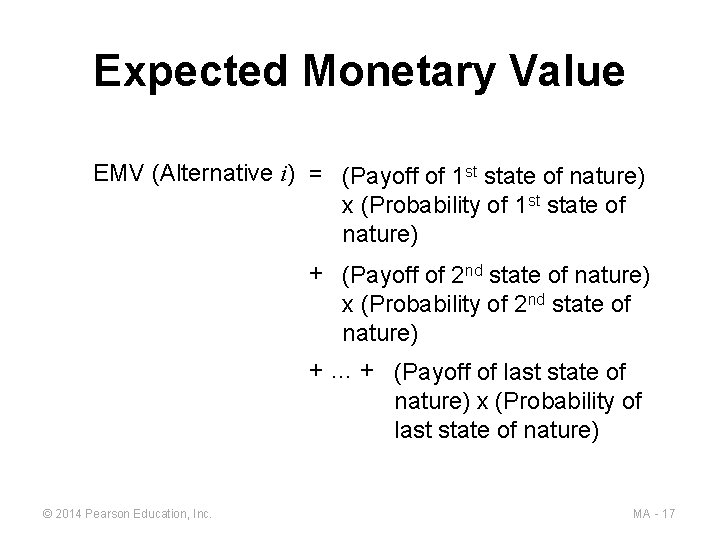
Expected Monetary Value EMV (Alternative i) = (Payoff of 1 st state of nature) x (Probability of 1 st state of nature) + (Payoff of 2 nd state of nature) x (Probability of 2 nd state of nature) + … + (Payoff of last state of nature) x (Probability of last state of nature) © 2014 Pearson Education, Inc. MA - 17
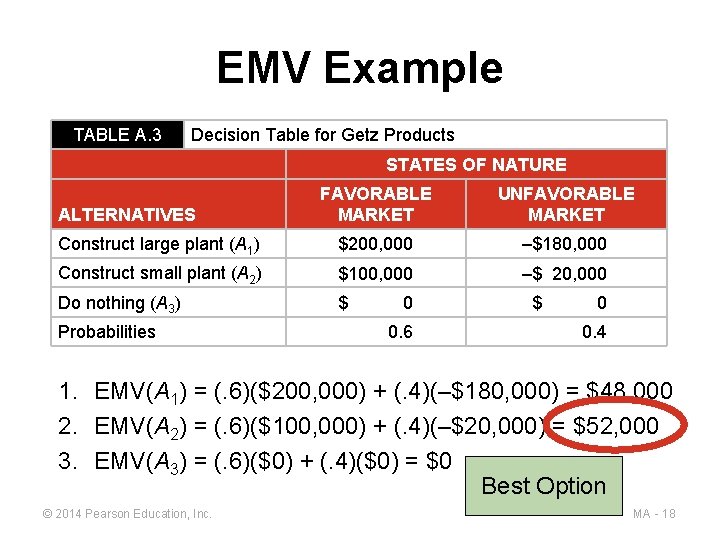
EMV Example TABLE A. 3 Decision Table for Getz Products STATES OF NATURE FAVORABLE MARKET UNFAVORABLE MARKET Construct large plant (A 1) $200, 000 –$180, 000 Construct small plant (A 2) $100, 000 –$ 20, 000 Do nothing (A 3) $ ALTERNATIVES Probabilities 0 0. 6 $ 0 0. 4 1. EMV(A 1) = (. 6)($200, 000) + (. 4)(–$180, 000) = $48, 000 2. EMV(A 2) = (. 6)($100, 000) + (. 4)(–$20, 000) = $52, 000 3. EMV(A 3) = (. 6)($0) + (. 4)($0) = $0 Best Option © 2014 Pearson Education, Inc. MA - 18
Decision Making Under Certainty ▶ Is the cost of perfect information worth it? ▶ Determine the expected value of perfect information (EVPI) © 2014 Pearson Education, Inc. MA - 19
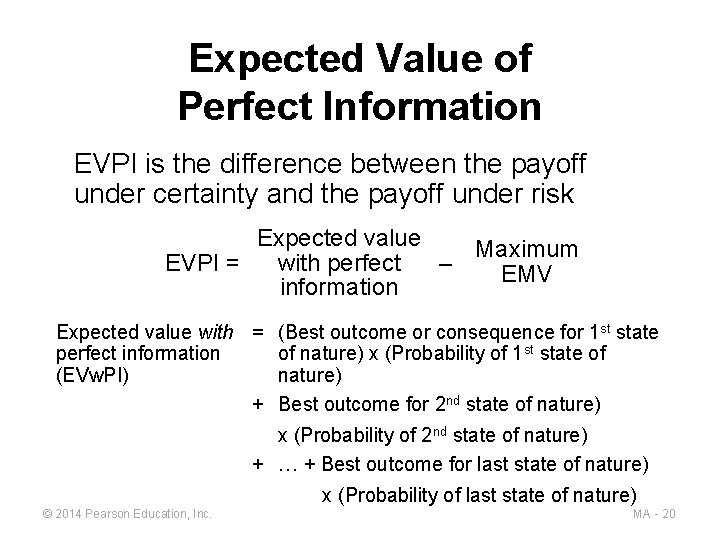
Expected Value of Perfect Information EVPI is the difference between the payoff under certainty and the payoff under risk Expected value Maximum with perfect EVPI = – EMV information Expected value with = (Best outcome or consequence for 1 st state perfect information of nature) x (Probability of 1 st state of (EVw. PI) nature) + Best outcome for 2 nd state of nature) x (Probability of 2 nd state of nature) + … + Best outcome for last state of nature) x (Probability of last state of nature) © 2014 Pearson Education, Inc. MA - 20
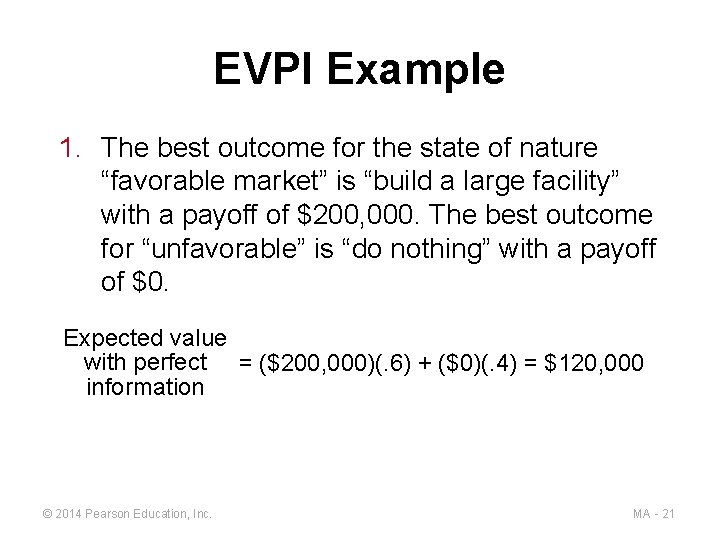
EVPI Example 1. The best outcome for the state of nature “favorable market” is “build a large facility” with a payoff of $200, 000. The best outcome for “unfavorable” is “do nothing” with a payoff of $0. Expected value with perfect = ($200, 000)(. 6) + ($0)(. 4) = $120, 000 information © 2014 Pearson Education, Inc. MA - 21
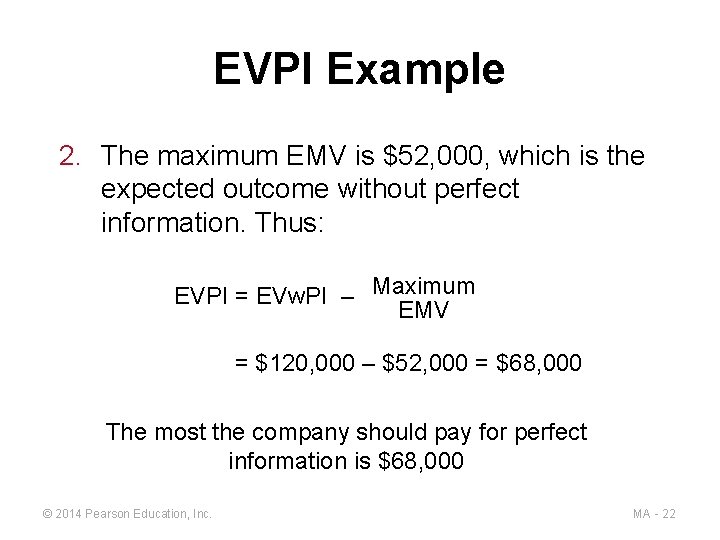
EVPI Example 2. The maximum EMV is $52, 000, which is the expected outcome without perfect information. Thus: EVPI = EVw. PI – Maximum EMV = $120, 000 – $52, 000 = $68, 000 The most the company should pay for perfect information is $68, 000 © 2014 Pearson Education, Inc. MA - 22
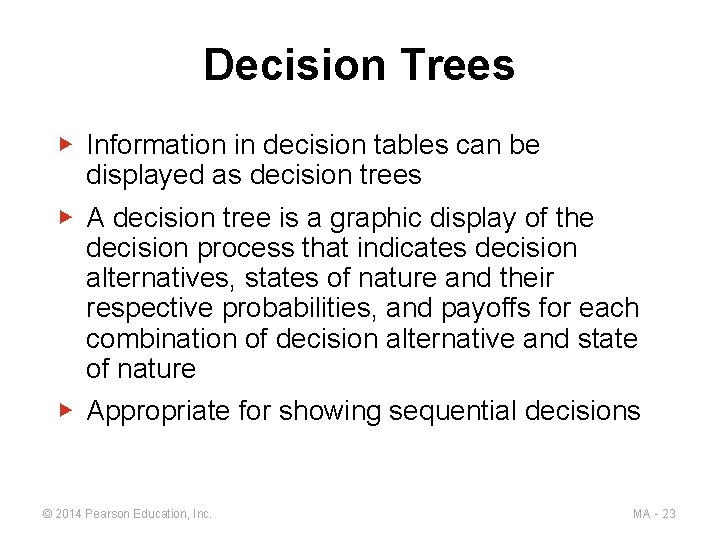
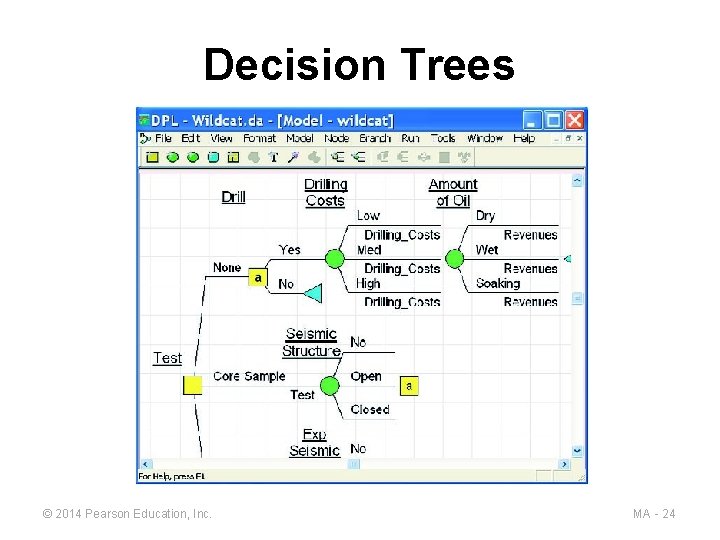
Decision Trees ▶ Information in decision tables can be displayed as decision trees ▶ A decision tree is a graphic display of the decision process that indicates decision alternatives, states of nature and their respective probabilities, and payoffs for each combination of decision alternative and state of nature ▶ Appropriate for showing sequential decisions © 2014 Pearson Education, Inc. MA - 23
Decision Trees © 2014 Pearson Education, Inc. MA - 24
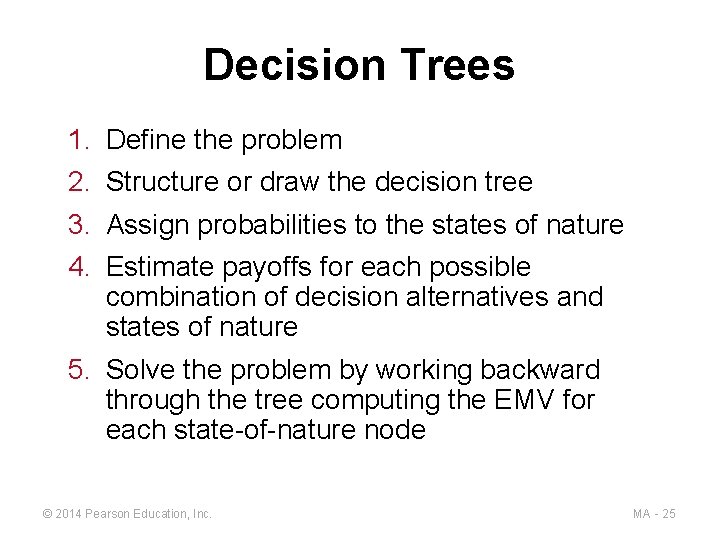
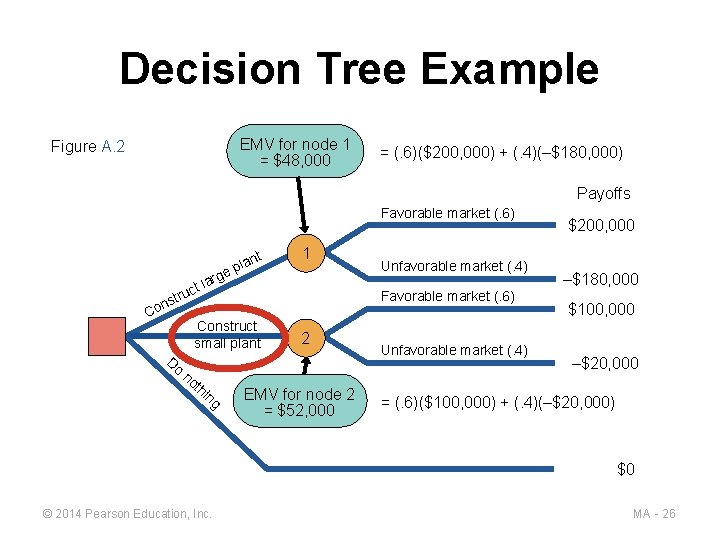
Decision Trees 1. 2. 3. 4. Define the problem Structure or draw the decision tree Assign probabilities to the states of nature Estimate payoffs for each possible combination of decision alternatives and states of nature 5. Solve the problem by working backward through the tree computing the EMV for each state-of-nature node © 2014 Pearson Education, Inc. MA - 25
Decision Tree Example EMV for node 1 = $48, 000 Figure A. 2 = (. 6)($200, 000) + (. 4)(–$180, 000) Payoffs Favorable market (. 6) s n Co ct tru ge lar Do nt pla th in g Unfavorable market (. 4) Favorable market (. 6) Construct small plant no 1 2 EMV for node 2 = $52, 000 Unfavorable market (. 4) $200, 000 –$180, 000 $100, 000 –$20, 000 = (. 6)($100, 000) + (. 4)(–$20, 000) $0 © 2014 Pearson Education, Inc. MA - 26
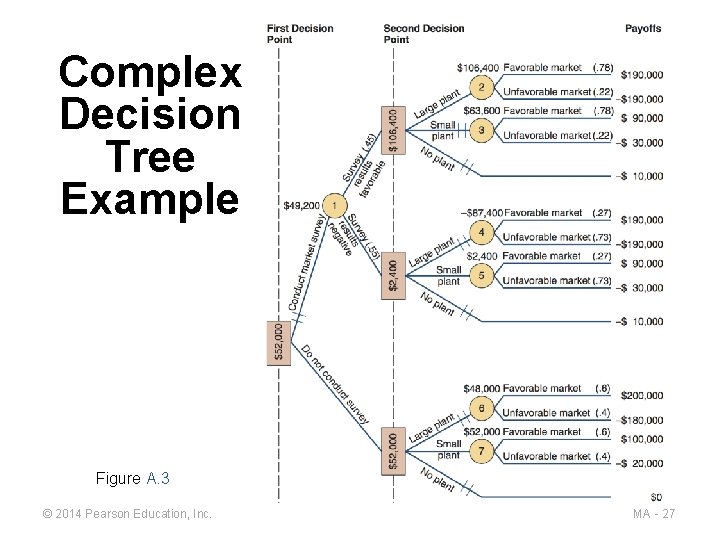
Complex Decision Tree Example Figure A. 3 © 2014 Pearson Education, Inc. MA - 27
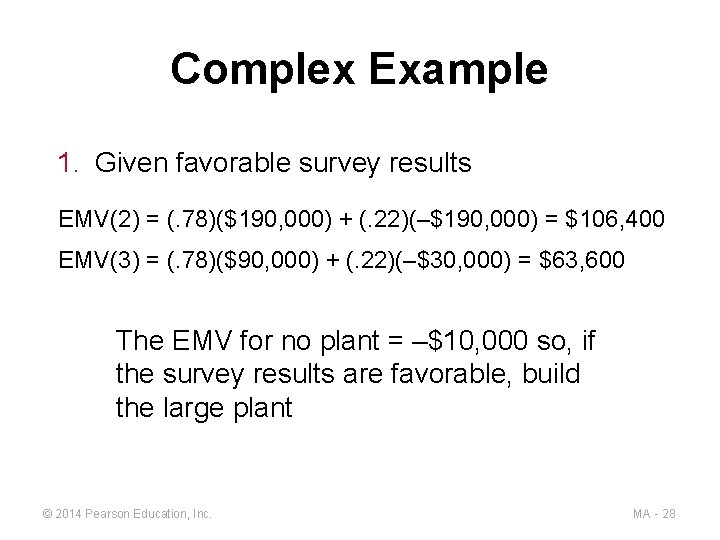
Complex Example 1. Given favorable survey results EMV(2) = (. 78)($190, 000) + (. 22)(–$190, 000) = $106, 400 EMV(3) = (. 78)($90, 000) + (. 22)(–$30, 000) = $63, 600 The EMV for no plant = –$10, 000 so, if the survey results are favorable, build the large plant © 2014 Pearson Education, Inc. MA - 28
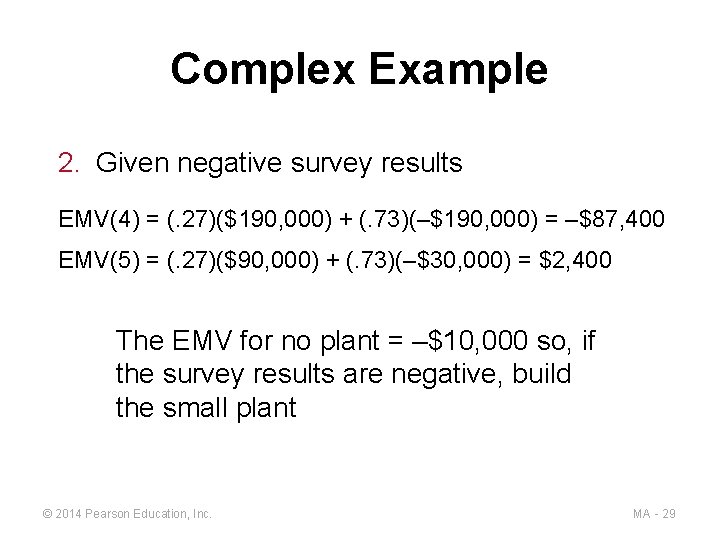
Complex Example 2. Given negative survey results EMV(4) = (. 27)($190, 000) + (. 73)(–$190, 000) = –$87, 400 EMV(5) = (. 27)($90, 000) + (. 73)(–$30, 000) = $2, 400 The EMV for no plant = –$10, 000 so, if the survey results are negative, build the small plant © 2014 Pearson Education, Inc. MA - 29
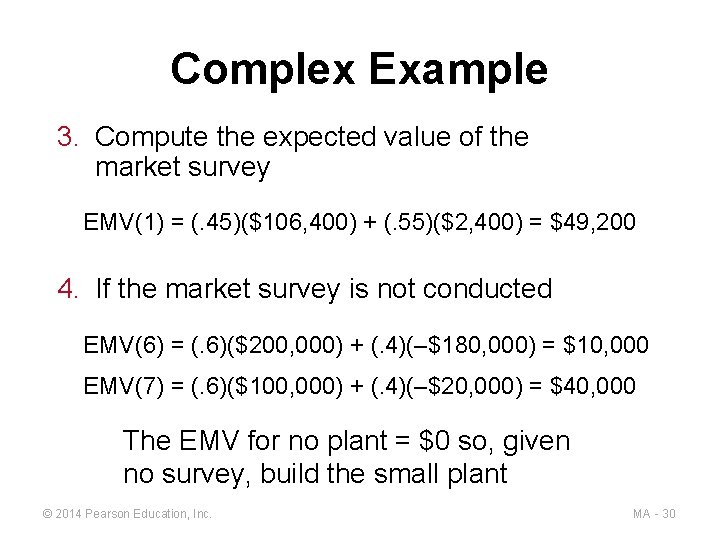
Complex Example 3. Compute the expected value of the market survey EMV(1) = (. 45)($106, 400) + (. 55)($2, 400) = $49, 200 4. If the market survey is not conducted EMV(6) = (. 6)($200, 000) + (. 4)(–$180, 000) = $10, 000 EMV(7) = (. 6)($100, 000) + (. 4)(–$20, 000) = $40, 000 The EMV for no plant = $0 so, given no survey, build the small plant © 2014 Pearson Education, Inc. MA - 30
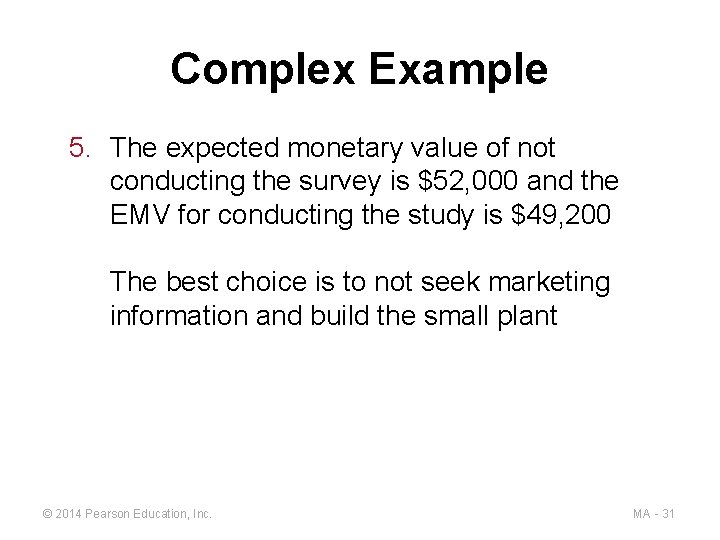
Complex Example 5. The expected monetary value of not conducting the survey is $52, 000 and the EMV for conducting the study is $49, 200 The best choice is to not seek marketing information and build the small plant © 2014 Pearson Education, Inc. MA - 31
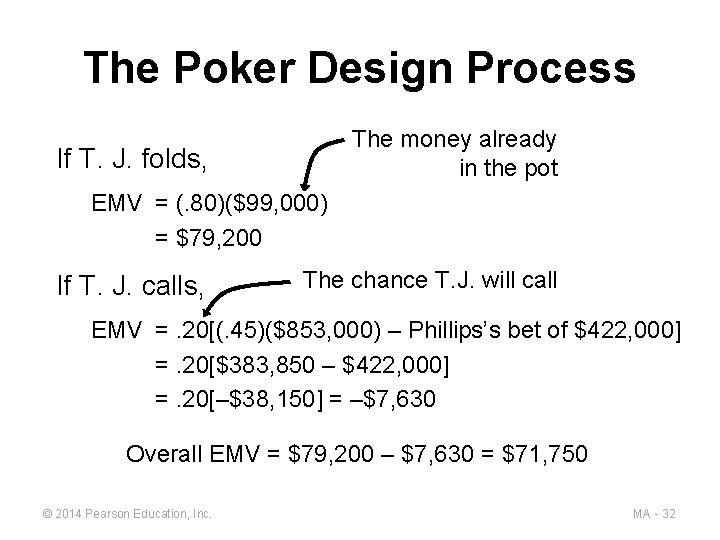
The Poker Design Process The money already in the pot If T. J. folds, EMV = (. 80)($99, 000) = $79, 200 If T. J. calls, The chance T. J. will call EMV =. 20[(. 45)($853, 000) – Phillips’s bet of $422, 000] =. 20[$383, 850 – $422, 000] =. 20[–$38, 150] = –$7, 630 Overall EMV = $79, 200 – $7, 630 = $71, 750 © 2014 Pearson Education, Inc. MA - 32
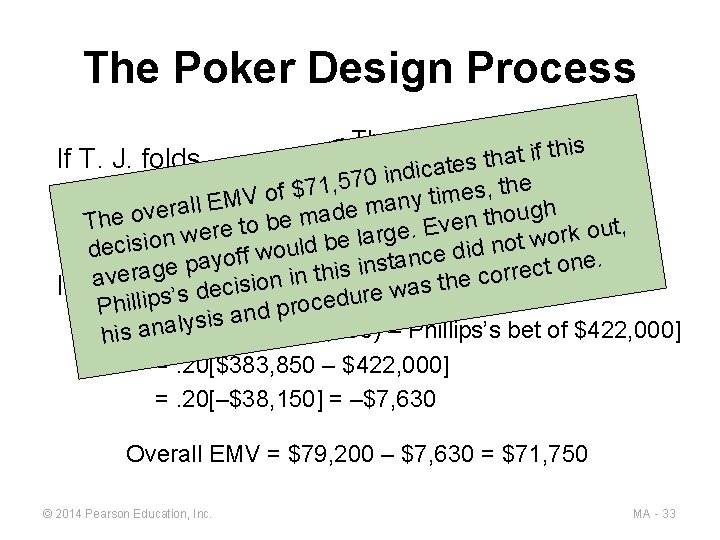
The Poker Design Process The money alreadythis if t a h t If T. J. folds, s atein the pot c i d n i 0 , 57 e 1 h t 7 , $ s f e o m y ti n EMVov=er(. 80)($99, 000) a ll EMV a m e d ugh a o h m t e n The b e to t, Ev u. e r o e e g k r r w a o = $79, 200 l n be ot w d n l u d i decisio o d w e f. nc yof e a t a n s p o n i t e c g s i e a th chance T. J. er orr call c in. The will e n h o i t s i s If T. av. J. calls, c wa de e s r ’ u s d p i l e l i c Ph pro d n a s i lys EMV – Phillips’s bet of $422, 000] his an=a. 20[(. 45)($853, 000) =. 20[$383, 850 – $422, 000] =. 20[–$38, 150] = –$7, 630 Overall EMV = $79, 200 – $7, 630 = $71, 750 © 2014 Pearson Education, Inc. MA - 33
All rights reserved. No part of this publication may be reproduced, stored in a retrieval system, or transmitted, in any form or by any means, electronic, mechanical, photocopying, recording, or otherwise, without the prior written permission of the publisher. Printed in the United States of America. © 2014 Pearson Education, Inc. MA - 34