A Modeling Study of Typhoon Nari 2001 at
 at Landfall. Part I: Topographic Effects Yang,")


 • Torrential rainfall over")
 Grid size (km) Area coverage (km*km) D 1 D")
 n Cumulus: Grell (1993) used on 54/18 km")


 Modeltime (h) Vmax(m/s) CTL CWB a. Track and Intensity")


 Before landfall c. Horizontal storm structure")
 After landfall c. Horizontal storm structure")

")
")
")
")
")
")
")
")


 CTL 3500 U(ms ) 2. 10 U/NH 0. 06 75%TER")
 100. 0")


 960 950 940 930 920 12 18 24 30")


- Slides: 39
A Modeling Study of Typhoon Nari (2001) at Landfall. Part I: Topographic Effects Yang, M. -J. , D. -L. Zhang, and H. -L. Huang , 2008: A modeling study of Typhoon Nari (2001) at landfall. Part I: The topographic effects. J. Atmos. Sci. , 65,
Introduction
• In this study, we wish to extend the previous studies by conducting a cloud-resolving simulation of Typhoon Nari(2001), but focus more on its landfalling characteristics. Introduction
• The capability of a TC model to reproduce the rainfall distribution and amount of a landfalling TC may depend on the model’s resolution of the storm circulations and terrain structures (Wu et al. 2002; Lin et al. 2002). • Wu et al. (2002) indicated that the model and the terrain resolutions played equal roles in producing heavy rainfall over Taiwan’s Central Mountain Range (CMR) for Typhoon Herb (1996). Introduction
Nari
• First appeared on 2001/09/06 • 9/7~9/13 Nari circle around • Landfall over Taiwan at 1300 UTC 16 September • Maximum wind speed is 55 m/s • 9/17~9/19 Nari moved across the CMR to western Tiawan with a slow speed of 3 -5 km/hr Nari
• Erratic movements • Very long duration (53 h) • Torrential rainfall over Taiwan Nari
Domain Duration Dimensions (x, y) Grid size (km) Area coverage (km*km) D 1 D 3 D 4 1200 UTC 9/15/2001 ~ 0000 UTC 9/19/2001 81*71 100*100 54 18 166*166 271*301 6 2 4320*3780 1780*1782 990*990 540*600 Levels Time step (s) D 2 32 sigma ( ) levels 90 Integration hours Model Setting 30 10 0 -84 3. 3
n Atmospheric Radiation Scheme: Dudhia (1989) n Cumulus: Grell (1993) used on 54/18 km n Microphysics: Reisner et al. (1998) n PBL: MRF Hong and Pan (1996) n IC/BC: ECMWF/TOGA 1. 125º lat/lon n The TC initialization procedure of Davis and Low-Nam (2001) Model Setting
a. Track and Intensity b. Accumulated rainfall c. Horizontal storm structure Model Verification
a. Track and Intensity
SLP(h. Pa) Modeltime (h) Vmax(m/s) CTL CWB a. Track and Intensity
09/16 – 09/18 b. Accumulated rainfall
under predict over predict b. Accumulated rainfall
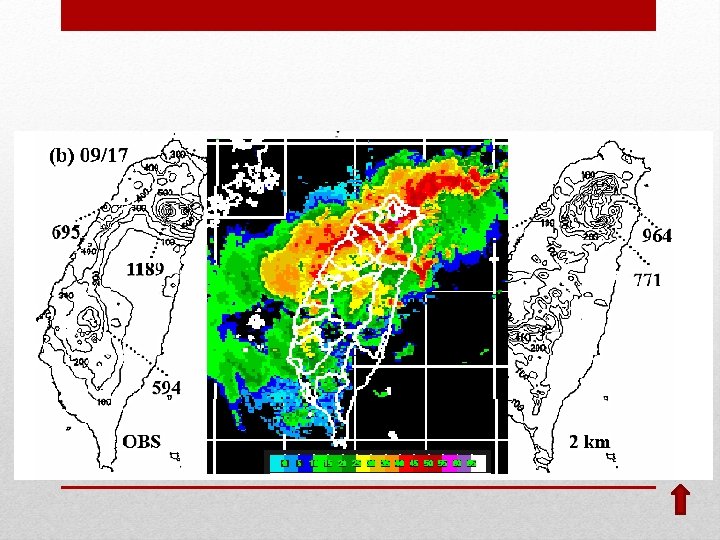
Vertical maximum radar reflectivity composite (CV) Before landfall c. Horizontal storm structure
Vertical maximum radar reflectivity composite (CV) After landfall c. Horizontal storm structure
Structural Changes
tangential wind (Contoured every 5 m/s)
radial wind (Contoured every 2 m/s)
Condensational heating rates (every 10 K/h)
Condensational heating rates (every 10 K/h)
Tangential wind (every 2. 5 m/s)
Tangential wind (every 2. 5 m/s)
radial wind (every 2. 5 m/s)
radial wind (every 2. 5 m/s)
a. Track and Intensity b. Accumulated rainfall Terrain Sensitivity Experiments
a. Track and Intensity
-1 Experiment H (m) CTL 3500 U(ms ) 2. 10 U/NH 0. 06 75%TER 2625 1. 76 0. 07 50%TER 1750 1. 74 0. 10 25%TER 875 0. 95 0. 11 H: the mountain height U: the deep layer across-CMR mean flow N: the Brunt-Väisälä frequency a. Track and Intensity
Variable CTL 75% TER 50% TER 25% TER Percentage wrt CTL (%) 100. 0 102. 9 88. 2 70. 0 b. 0% Ocean TER • First 24 h 51. 9 accumulation 52. 3 • From 6 -km Accumulated rainfall
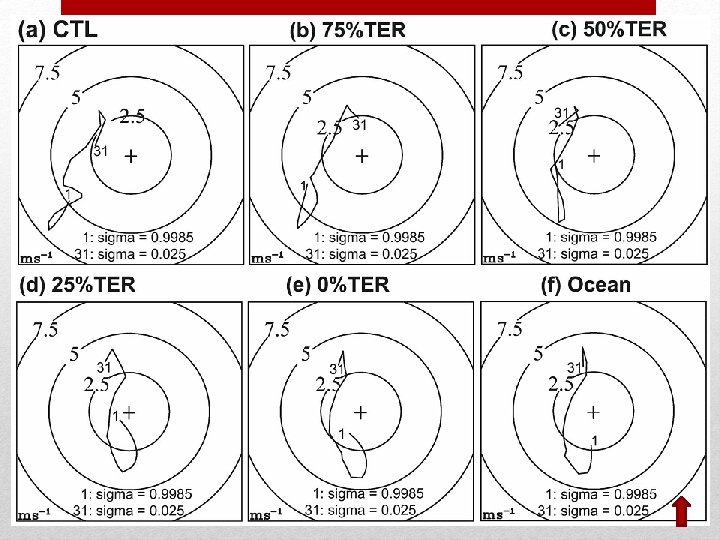
• RMW are upright with a larger eye size and the maximum latent heating is located at the mid to upper troposphere prior to landfall, but the eye shrinks after landfall • The impact of Taiwan’s terrain on Nari’s intensity is linear. In contrast, the terrain heights produce nonlinear tracks. • Large-scale sheared flows and enhanced by the local topography determine Nari’s torrential rainfall during first 24 h after landfall. (more topographically driven afterward) Conclusion
Thank you for your listening. The End
• A simple hurricane model • The Rankine vortex model is a simple two-equation parametric description of a swirling flow, characterized by a forced vortex in the central core and a free vortex with increasing distance from the center. The two parameters are the radius of maximum winds and the peak wind speed. The Rankine vortex is used as the basis for a number of simple descriptions of hurricane wind fields. Rankine vortex
980 970 SLP (h. Pa) 960 950 940 930 920 12 18 24 30 36 42 48 Modeltime (h) 氣象局警報單中心氣壓 Fanapi 模式中心氣壓_D 03 54 60
CTL 1200 UTC 16 Sep 50% TER 1800 UTC 16 Sep 0000 UTC 17 Sep
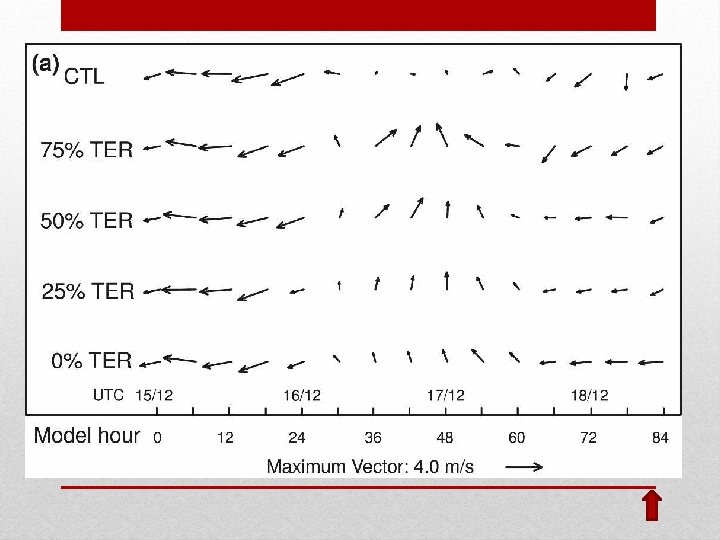
• Environmental flows at 1800 UTC 16 Sep, 2001
Radius No. of CTL points 75% TER 50% TER 25% TER 0% Ocean TER 100 km 877 100 97. 3 84. 2 64. 7 62. 2 61. 5 150 km 1961 100 94. 1 85. 1 68. 5 64. 9 64. 1 200 km 3503 100 95. 4 84. 0 71. 8 66. 3 68. 3