A map is Graphic representation drawn to scale


 - June 30, 2000 IKONOS 1 -meter (preattack) This one-meter")


 Each feature is part of a")


- Slides: 28
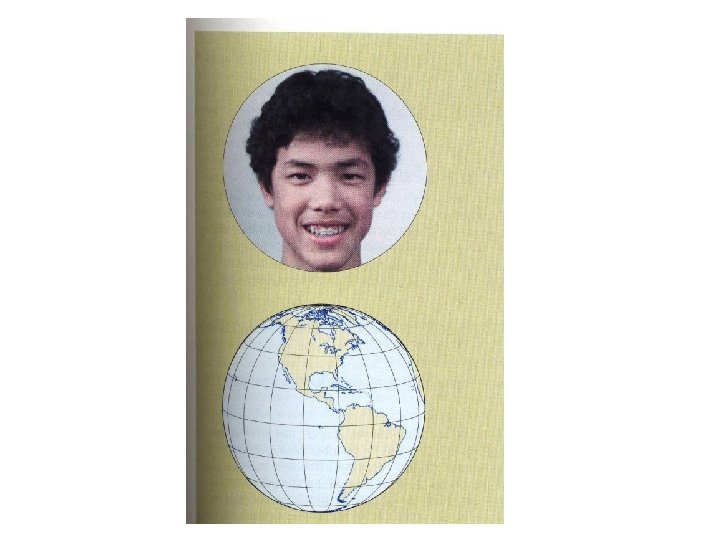
A map is… Graphic representation, drawn to scale and usually on a flat surface, of an area of the Earth. It uses lines, symbols, and colors to describe location and relationship. A globe is… The only true representation of the earth without distortion.
Why use maps? 1. To locate places 2. To show relationships 3. To show information 4. To ask questions http: //sofia. fhda. edu/gallery/geography/lessons/lesson 02. html and mapquest
A person that makes a map is called… cartographer
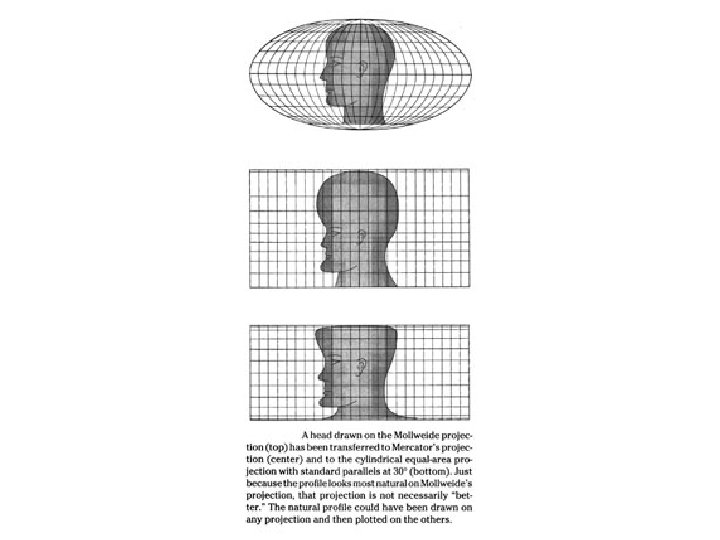
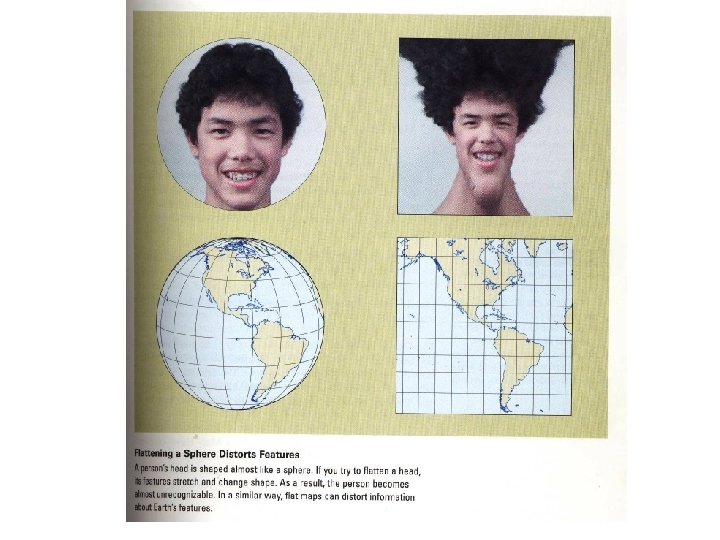
Which is more accurate – map or globe? All maps lie!
1. size/area 2. shape 3. direction 4. distance
http: //sofia. fhda. edu/gallery/geography/lessons/lesson 02. html
www. progonos. com/. . . /Proj. Int. C/proj. Int. C. html www. colorado. edu/. . . /notes/mapproj. html Proving that all maps lie – a story of projections (in class demonstration)
Scale – measurement of how the map distances relate to distances in the real world Equator fits on 2 pages Equator takes wall of classroom. Equator stretches across the U. S. !! Hint: Large scale map covers small area. Small scale map covers large area. http: //sofia. fhda. edu/gallery/geography/lessons/lesson 02. html#_Cartography
Latitude and longitude – more than one way to find your way Hastings, Minnesota 44°N, 92°W - in whole degrees 44° 42’ 36”N, 92° 27’ 11”W degrees minutes seconds 44. 73032, -92. 88255 – in decimal degrees – more common with computer mapping and with GPS systems * Other systems exist that we will discuss later this year.
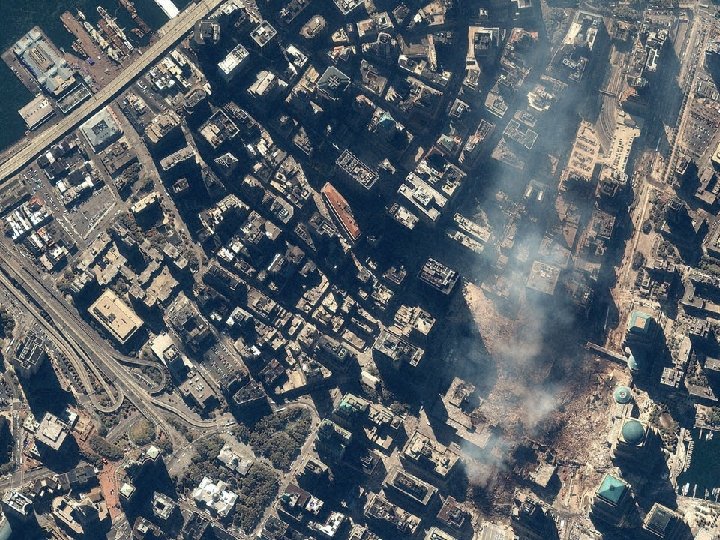
Manhattan, New York (color) - June 30, 2000 IKONOS 1 -meter (preattack) This one-meter resolution satellite image of Manhattan, New York was collected June 30, 2000 by Space Imaging's IKONOS satellite. The image, taken from the south, prominently features the 110 -story World Trade Center twin towers. IKONOS travels 423 miles above the Earth's surface at a speed of 17, 500 miles per hour.
IKONOS also aimed its camera on the wreckage of the World Trade Center in Manhattan. The image, taken from a height of 423 miles, shows an area of white and gray dust and smoke where the 110 -story twin towers had stood the day before.
Aboard the international space station, U. S. commander Frank Culbertson and his two Russian crewmates watched in horror as lower Manhattan burned. Culbertson documented the drama with a camcorder from 240 miles high. Several NASA satellites observed the long gray plume of smoke drifting along the coast from the smoldering Twin Towers. The spacecraft included Terra, the flagship of a fleet of space agency orbiters monitoring the world environment. Terra took the photograph a few hours after the attack. In the color-enhanced image, the dark blue colors depict the streaming smoke while the light blues represent concrete surfaces. The picture was snapped from a height of between 600 and 900 miles, according to NASA.
This one-meter resolution satellite image of The Pentagon was collected on Dec. 28, 2000 by Space Imaging's IKONOS satellite. Clearly visible are the cars in the parking lot, the Pentagon's renowned five-sided shape, the building's inners rings and five-acre courtyard. IKONOS travels 423 miles above the Earth's surface at a speed of 17, 500 miles per hour.
This one-meter resolution satellite image of the Pentagon was collected at 11: 46 a. m. EDT on Sept. 12, 2001 by Space Imaging's IKONOS satellite. The image shows extensive damage to the western side and interior rings of the multi-ringed building. IKONOS travels 423 miles above the Earth's surface at a speed of 17, 500 miles per hour.
Landsat-7 satellite image showing the May 18, 2001 conditions on the land prior to the June 18, 2001 Siren, Wis. tornado. The image covers an area of northern Wisconsin approximately 50 miles in the east-west direction and 20 miles in the north-south direction.
Landsat-7 satellite image showing the June 19, 2001 conditions on the land one day after the June 18, 2001 Siren, Wis. tornado. The image covers an area of northern Wisconsin approximately 50 miles in the eastwest direction and 20 miles in the north-south direction. The bright path of greatest destruction shows a change in land reflectance and can be seen running roughly parallel to Highway 70, from just east of Alpha to the eastern edge of the image, just southwest of Spooner, Wis.
Another satellite view
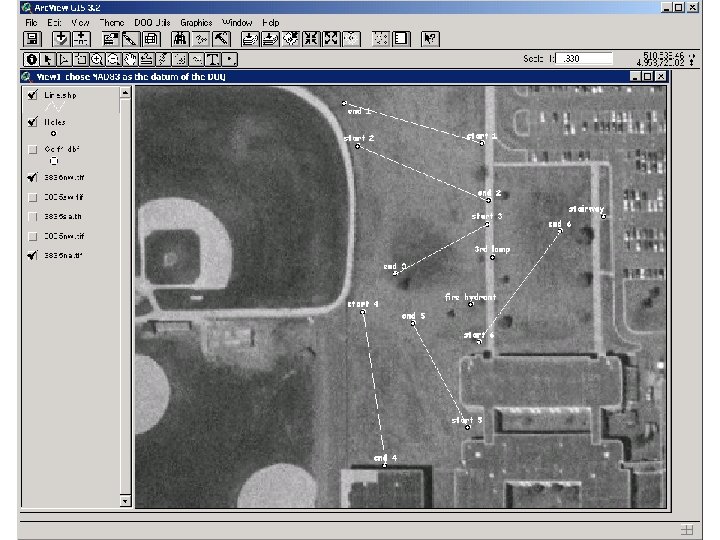
One more cartography tool…GIS mapping (Geographic Information System) Each feature is part of a theme. Each theme becomes a layer. Each layer is geo-referenced, so the layers can be put accurately on top of each other. What kinds of layers might be put together for this location if it was made into a map?
http: //vega. soi. city. ac. uk/~dk 708/images/5 layers. jpg We will use and create GIS maps this year.
GPS points can be entered onto GIS map layers.
Who cares? Utility companies for transmission lines, power poles, generators, rivers, irrigation, waterways, emergency services, phone lines, property lines, planning agencies, water and sewer lines, cable lines, roads, bridges, population, census tracts, air routes, forestry management, soil types, vegetation, land use, land topography, newspaper routes, oil wells, pipelines, school boundaries, housing developments, port facilities, cell phone tower locations, tracking package shipments, distribution of threatened and endangered species, erosion mapping, farmers’ map for fertilizer application, assistance with site location for businesses, crime pattern analysis, used by Homeland Security, public health management, disease mapping, crisis management, and more… http: //www. esri. com/company/gis_touches/everyday. html