
A Longitudinal Study of Emerging Adults Plans for
- Slides: 1
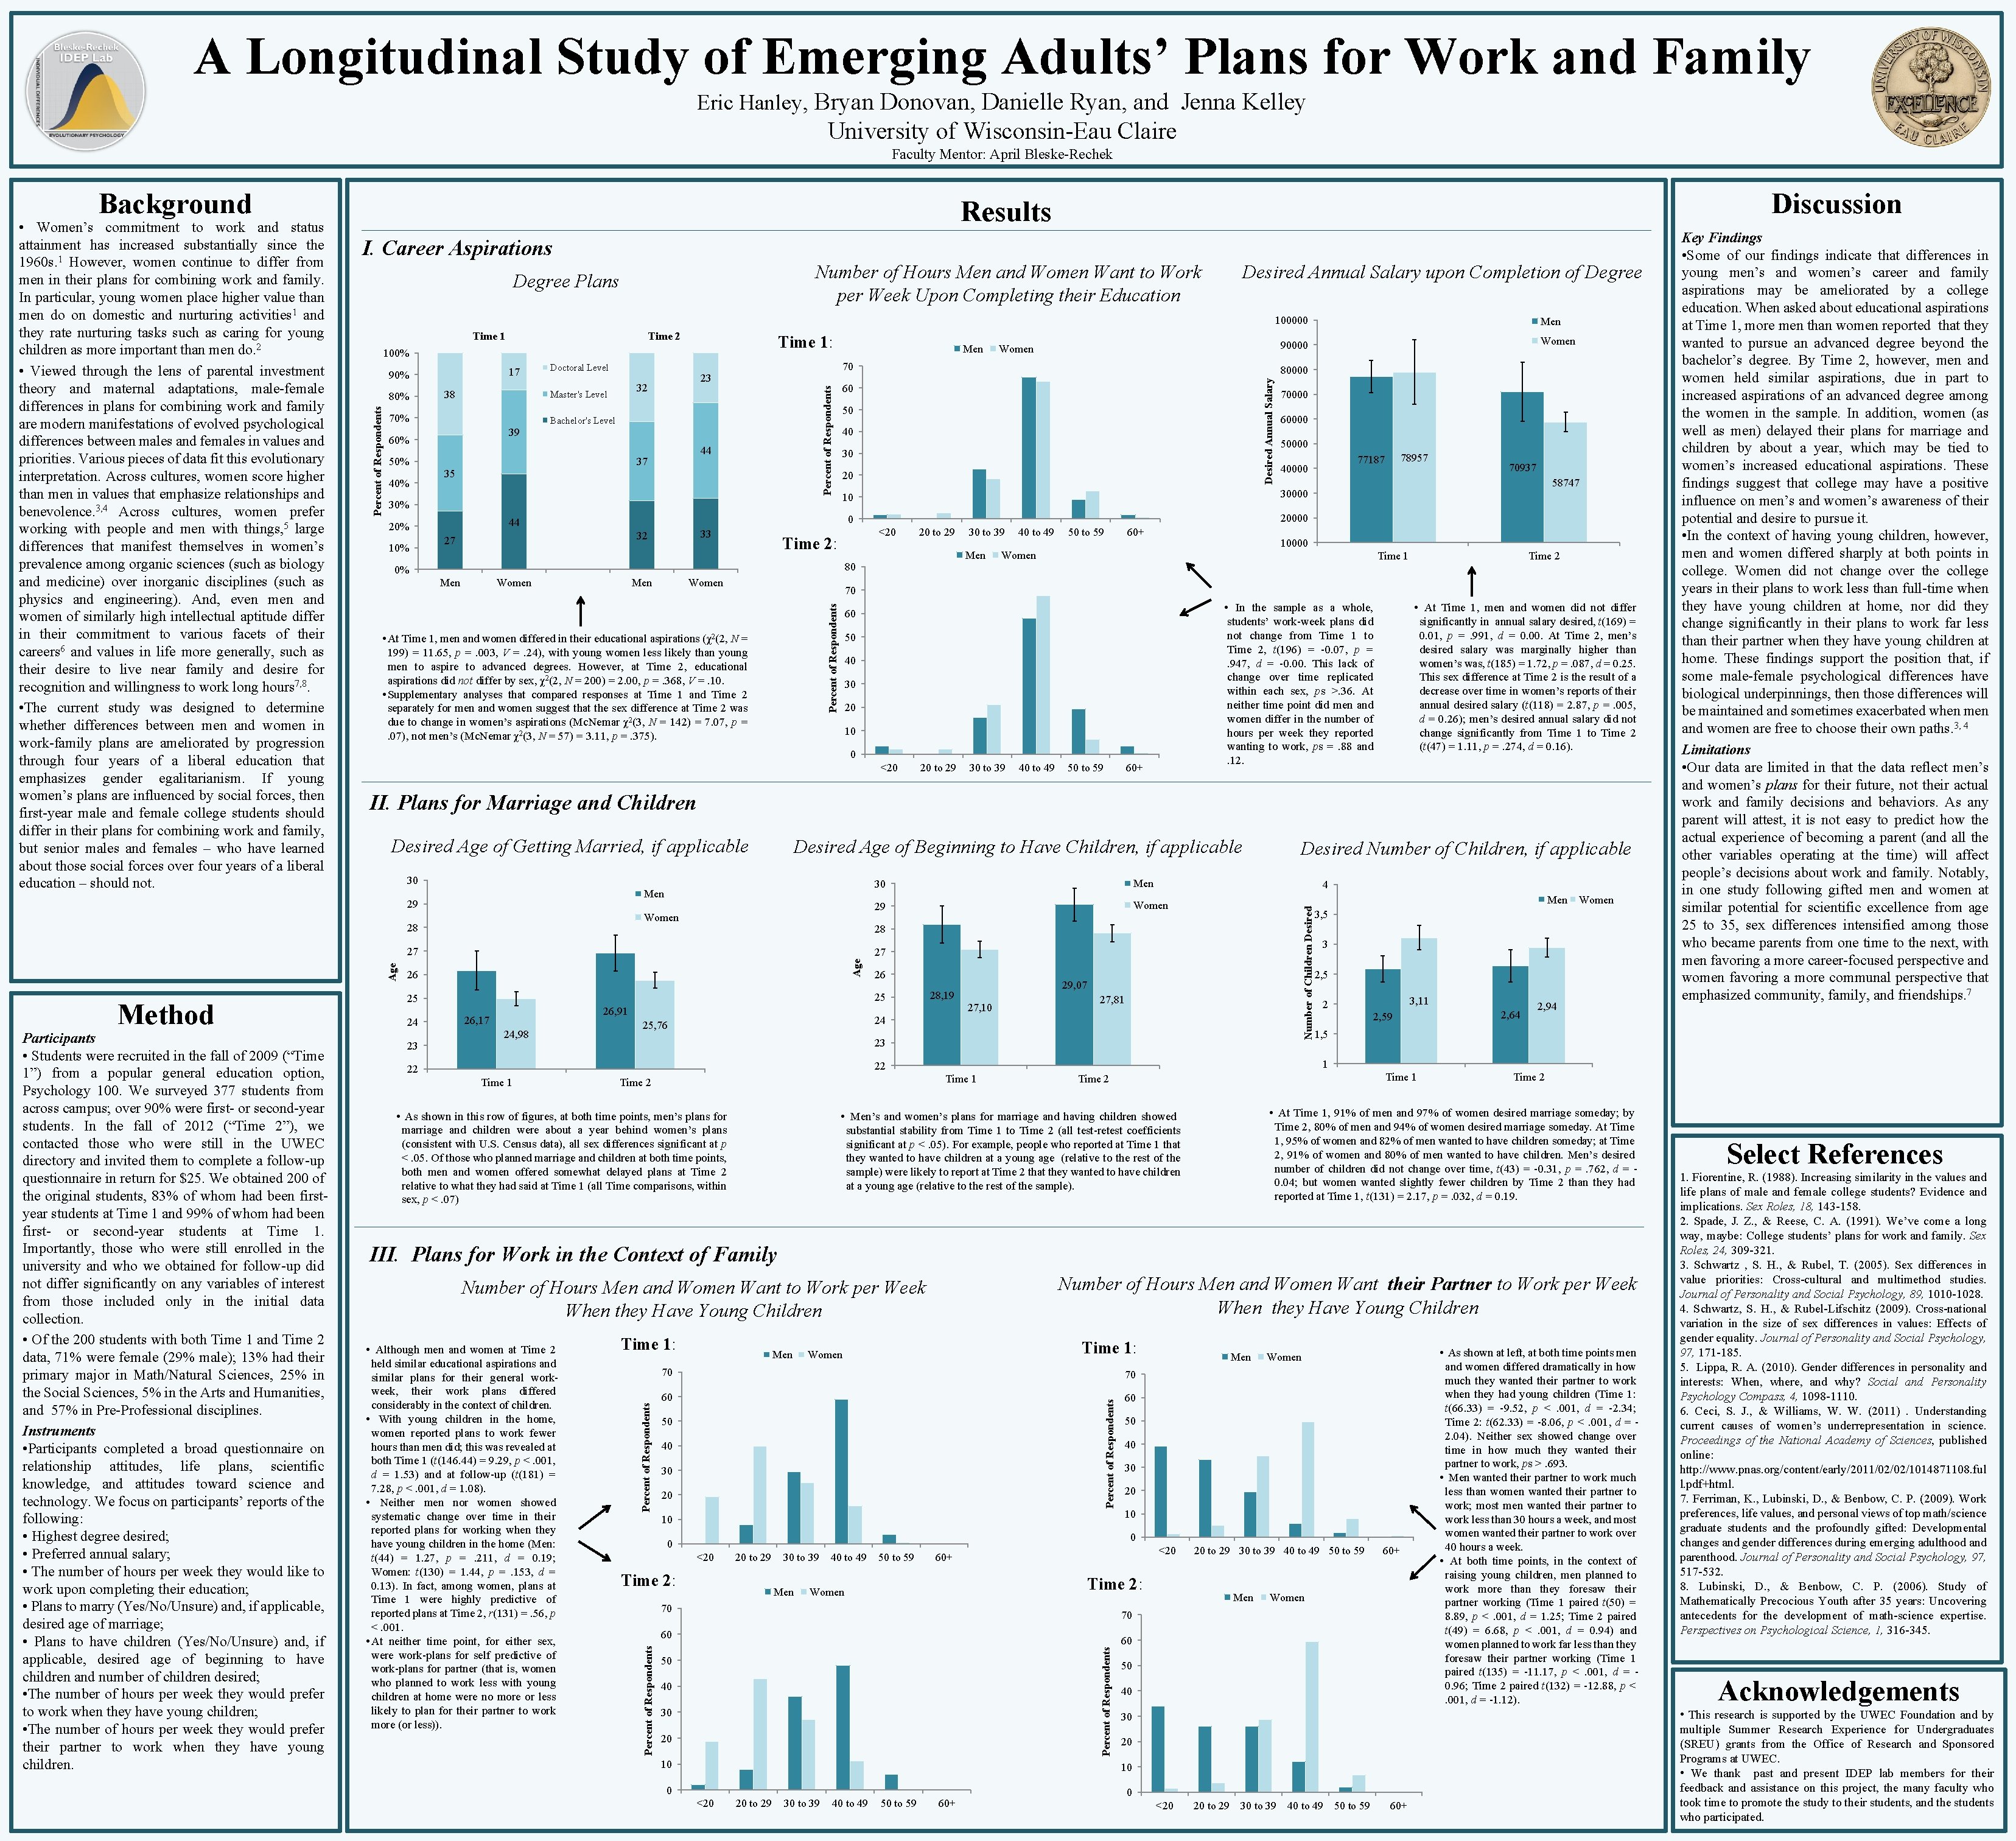
A Longitudinal Study of Emerging Adults’ Plans for Work and Family Eric Hanley, Bryan Donovan, Danielle Ryan, and Jenna Kelley University of Wisconsin-Eau Claire Faculty Mentor: April Bleske-Rechek Background I. Career Aspirations Number of Hours Men and Women Want to Work per Week Upon Completing their Education Degree Plans Time 2 Time 1: 100% 90% 80% 38 Bachelor's Level 39 60% 44 37 35 44 20% 10% 33 32 27 50 40 30 20 <20 Women 30 to 39 Men 40 to 49 50 to 59 60+ 70937 58747 10000 Women Time 1 Time 2 70 • At Time 1, men and women differed in their educational aspirations (χ2(2, N = 199) = 11. 65, p =. 003, V =. 24), with young women less likely than young men to aspire to advanced degrees. However, at Time 2, educational aspirations did not differ by sex, χ2(2, N = 200) = 2. 00, p =. 368, V =. 10. • Supplementary analyses that compared responses at Time 1 and Time 2 separately for men and women suggest that the sex difference at Time 2 was due to change in women’s aspirations (Mc. Nemar χ2(3, N = 142) = 7. 07, p =. 07), not men’s (Mc. Nemar χ2(3, N = 57) = 3. 11, p =. 375). • In the sample as a whole, students’ work-week plans did not change from Time 1 to Time 2, t(196) = -0. 07, p =. 947, d = -0. 00. This lack of change over time replicated within each sex, ps >. 36. At neither time point did men and women differ in the number of hours per week they reported wanting to work, ps =. 88 and. 12. 60 50 40 30 20 10 0 <20 20 to 29 30 to 39 40 to 49 50 to 59 60+ • At Time 1, men and women did not differ significantly in annual salary desired, t(169) = 0. 01, p =. 991, d = 0. 00. At Time 2, men’s desired salary was marginally higher than women’s was, t(185) = 1. 72, p =. 087, d = 0. 25. This sex difference at Time 2 is the result of a decrease over time in women’s reports of their annual desired salary (t(118) = 2. 87, p =. 005, d = 0. 26); men’s desired annual salary did not change significantly from Time 1 to Time 2 (t(47) = 1. 11, p =. 274, d = 0. 16). II. Plans for Marriage and Children Desired Age of Getting Married, if applicable Desired Age of Beginning to Have Children, if applicable Men Women Age 29 Women 4 Men 27 26 26 25 25 23 Men 28 27 24 30 Desired Number of Children, if applicable Number of Children Desired 30 28 26, 91 26, 17 24, 98 29, 07 28, 19 27, 10 27, 81 24 25, 76 23 Time 1 Time 2 • As shown in this row of figures, at both time points, men’s plans for marriage and children were about a year behind women’s plans (consistent with U. S. Census data), all sex differences significant at p <. 05. Of those who planned marriage and children at both time points, both men and women offered somewhat delayed plans at Time 2 relative to what they had said at Time 1 (all Time comparisons, within sex, p <. 07) Women 3, 5 3 2, 5 3, 11 2 2, 59 2, 64 2, 94 1, 5 Time 1 Time 2 • At Time 1, 91% of men and 97% of women desired marriage someday; by Time 2, 80% of men and 94% of women desired marriage someday. At Time 1, 95% of women and 82% of men wanted to have children someday; at Time 2, 91% of women and 80% of men wanted to have children. Men’s desired number of children did not change over time, t(43) = -0. 31, p =. 762, d = 0. 04; but women wanted slightly fewer children by Time 2 than they had reported at Time 1, t(131) = 2. 17, p =. 032, d = 0. 19. • Men’s and women’s plans for marriage and having children showed substantial stability from Time 1 to Time 2 (all test-retest coefficients significant at p <. 05). For example, people who reported at Time 1 that they wanted to have children at a young age (relative to the rest of the sample) were likely to report at Time 2 that they wanted to have children at a young age (relative to the rest of the sample). III. Plans for Work in the Context of Family Number of Hours Men and Women Want their Partner to Work per Week When they Have Young Children Number of Hours Men and Women Want to Work per Week When they Have Young Children Time 1: Men Time 1: Women 70 70 60 60 Percent of Respondents 50 40 30 20 10 Men Women 50 40 30 20 10 0 0 <20 20 to 29 Time 2: 30 to 39 Men 40 to 49 50 to 59 <20 60+ Time 2: Women 70 20 to 29 30 to 39 40 to 49 50 to 59 Men 60+ Women 70 60 60 Percent of Respondents • Although men and women at Time 2 held similar educational aspirations and similar plans for their general workweek, their work plans differed considerably in the context of children. • With young children in the home, women reported plans to work fewer hours than men did; this was revealed at both Time 1 (t(146. 44) = 9. 29, p <. 001, d = 1. 53) and at follow-up (t(181) = 7. 28, p <. 001, d = 1. 08). • Neither men nor women showed systematic change over time in their reported plans for working when they have young children in the home (Men: t(44) = 1. 27, p =. 211, d = 0. 19; Women: t(130) = 1. 44, p =. 153, d = 0. 13). In fact, among women, plans at Time 1 were highly predictive of reported plans at Time 2, r(131) =. 56, p <. 001. • At neither time point, for either sex, were work-plans for self predictive of work-plans for partner (that is, women who planned to work less with young children at home were no more or less likely to plan for their partner to work more (or less)). 50 40 30 20 10 10 0 0 <20 20 to 29 30 to 39 40 to 49 50 to 59 Key Findings • Some of our findings indicate that differences in young men’s and women’s career and family aspirations may be ameliorated by a college education. When asked about educational aspirations at Time 1, more men than women reported that they wanted to pursue an advanced degree beyond the bachelor’s degree. By Time 2, however, men and women held similar aspirations, due in part to increased aspirations of an advanced degree among the women in the sample. In addition, women (as well as men) delayed their plans for marriage and children by about a year, which may be tied to women’s increased educational aspirations. These findings suggest that college may have a positive influence on men’s and women’s awareness of their potential and desire to pursue it. • In the context of having young children, however, men and women differed sharply at both points in college. Women did not change over the college years in their plans to work less than full-time when they have young children at home, nor did they change significantly in their plans to work far less than their partner when they have young children at home. These findings support the position that, if some male-female psychological differences have biological underpinnings, then those differences will be maintained and sometimes exacerbated when men and women are free to choose their own paths. 3, 4 Limitations • Our data are limited in that the data reflect men’s and women’s plans for their future, not their actual work and family decisions and behaviors. As any parent will attest, it is not easy to predict how the actual experience of becoming a parent (and all the other variables operating at the time) will affect people’s decisions about work and family. Notably, in one study following gifted men and women at similar potential for scientific excellence from age 25 to 35, sex differences intensified among those who became parents from one time to the next, with men favoring a more career-focused perspective and women favoring a more communal perspective that emphasized community, family, and friendships. 7 1 22 22 Percent of Respondents Participants • Students were recruited in the fall of 2009 (“Time 1”) from a popular general education option, Psychology 100. We surveyed 377 students from across campus; over 90% were first- or second-year students. In the fall of 2012 (“Time 2”), we contacted those who were still in the UWEC directory and invited them to complete a follow-up questionnaire in return for $25. We obtained 200 of the original students, 83% of whom had been firstyear students at Time 1 and 99% of whom had been first- or second-year students at Time 1. Importantly, those who were still enrolled in the university and who we obtained for follow-up did not differ significantly on any variables of interest from those included only in the initial data collection. • Of the 200 students with both Time 1 and Time 2 data, 71% were female (29% male); 13% had their primary major in Math/Natural Sciences, 25% in the Social Sciences, 5% in the Arts and Humanities, and 57% in Pre-Professional disciplines. Instruments • Participants completed a broad questionnaire on relationship attitudes, life plans, scientific knowledge, and attitudes toward science and technology. We focus on participants’ reports of the following: • Highest degree desired; • Preferred annual salary; • The number of hours per week they would like to work upon completing their education; • Plans to marry (Yes/No/Unsure) and, if applicable, desired age of marriage; • Plans to have children (Yes/No/Unsure) and, if applicable, desired age of beginning to have children and number of children desired; • The number of hours per week they would prefer to work when they have young children; • The number of hours per week they would prefer their partner to work when they have young children. 20 to 29 78957 77187 40000 20000 Percent of Respondents Men 50000 0 80 Women 60000 30000 0% Men 70000 10 Time 2: Women 80000 60 30% Men 90000 Women 70 23 32 Master's Level 70% 50% Doctoral Level Percent of Respondents 17 Men Desired Annual Salary Time 1 29 Method Desired Annual Salary upon Completion of Degree 100000 Percent of Respondents • Women’s commitment to work and status attainment has increased substantially since the 1960 s. 1 However, women continue to differ from men in their plans for combining work and family. In particular, young women place higher value than men do on domestic and nurturing activities 1 and they rate nurturing tasks such as caring for young children as more important than men do. 2 • Viewed through the lens of parental investment theory and maternal adaptations, male-female differences in plans for combining work and family are modern manifestations of evolved psychological differences between males and females in values and priorities. Various pieces of data fit this evolutionary interpretation. Across cultures, women score higher than men in values that emphasize relationships and benevolence. 3, 4 Across cultures, women prefer working with people and men with things, 5 large differences that manifest themselves in women’s prevalence among organic sciences (such as biology and medicine) over inorganic disciplines (such as physics and engineering). And, even men and women of similarly high intellectual aptitude differ in their commitment to various facets of their careers 6 and values in life more generally, such as their desire to live near family and desire for recognition and willingness to work long hours 7, 8. • The current study was designed to determine whether differences between men and women in work-family plans are ameliorated by progression through four years of a liberal education that emphasizes gender egalitarianism. If young women’s plans are influenced by social forces, then first-year male and female college students should differ in their plans for combining work and family, but senior males and females – who have learned about those social forces over four years of a liberal education – should not. Discussion Results 60+ <20 20 to 29 30 to 39 40 to 49 50 to 59 60+ • As shown at left, at both time points men and women differed dramatically in how much they wanted their partner to work when they had young children (Time 1: t(66. 33) = -9. 52, p <. 001, d = -2. 34; Time 2: t(62. 33) = -8. 06, p <. 001, d = 2. 04). Neither sex showed change over time in how much they wanted their partner to work, ps >. 693. • Men wanted their partner to work much less than women wanted their partner to work; most men wanted their partner to work less than 30 hours a week, and most women wanted their partner to work over 40 hours a week. • At both time points, in the context of raising young children, men planned to work more than they foresaw their partner working (Time 1 paired t(50) = 8. 89, p <. 001, d = 1. 25; Time 2 paired t(49) = 6. 68, p <. 001, d = 0. 94) and women planned to work far less than they foresaw their partner working (Time 1 paired t(135) = -11. 17, p <. 001, d = 0. 96; Time 2 paired t(132) = -12. 88, p <. 001, d = -1. 12). Select References 1. Fiorentine, R. (1988). Increasing similarity in the values and life plans of male and female college students? Evidence and implications. Sex Roles, 18, 143 -158. 2. Spade, J. Z. , & Reese, C. A. (1991). We’ve come a long way, maybe: College students’ plans for work and family. Sex Roles, 24, 309 -321. 3. Schwartz , S. H. , & Rubel, T. (2005). Sex differences in value priorities: Cross-cultural and multimethod studies. Journal of Personality and Social Psychology, 89, 1010 -1028. 4. Schwartz, S. H. , & Rubel-Lifschitz (2009). Cross-national variation in the size of sex differences in values: Effects of gender equality. Journal of Personality and Social Psychology, 97, 171 -185. 5. Lippa, R. A. (2010). Gender differences in personality and interests: When, where, and why? Social and Personality Psychology Compass, 4, 1098 -1110. 6. Ceci, S. J. , & Williams, W. W. (2011). Understanding current causes of women’s underrepresentation in science. Proceedings of the National Academy of Sciences, published online: http: //www. pnas. org/content/early/2011/02/02/1014871108. ful l. pdf+html. 7. Ferriman, K. , Lubinski, D. , & Benbow, C. P. (2009). Work preferences, life values, and personal views of top math/science graduate students and the profoundly gifted: Developmental changes and gender differences during emerging adulthood and parenthood. Journal of Personality and Social Psychology, 97, 517 -532. 8. Lubinski, D. , & Benbow, C. P. (2006). Study of Mathematically Precocious Youth after 35 years: Uncovering antecedents for the development of math-science expertise. Perspectives on Psychological Science, 1, 316 -345. Acknowledgements • This research is supported by the UWEC Foundation and by multiple Summer Research Experience for Undergraduates (SREU) grants from the Office of Research and Sponsored Programs at UWEC. • We thank past and present IDEP lab members for their feedback and assistance on this project, the many faculty who took time to promote the study to their students, and the students who participated.