A Kernel Vulnerability Detection Framework based on Hardware

A Kernel Vulnerability Detection Framework based on Hardware Guanglu Yan
Contributor Jianfeng Pan, Guanglu Yan, and Xiaocao Fan www. iceswordlab. com
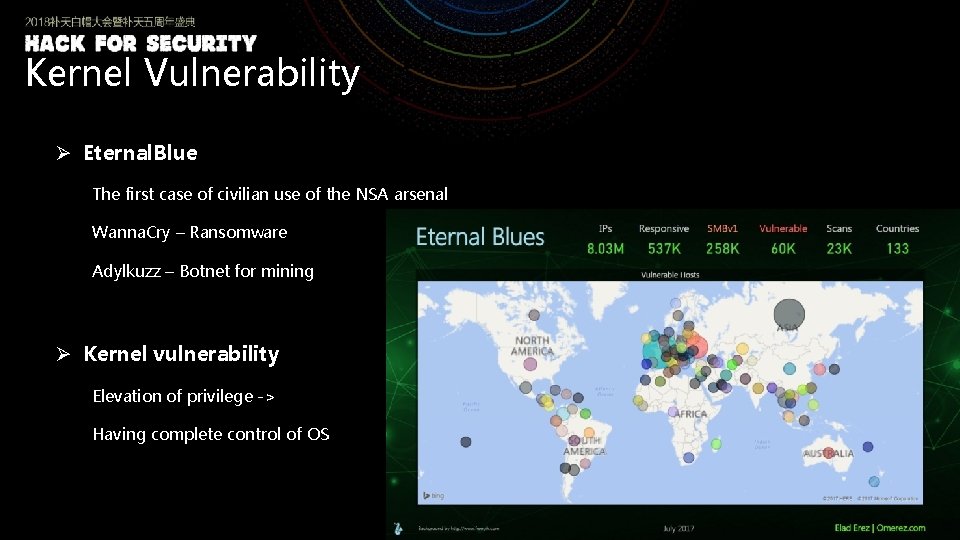
Kernel Vulnerability Ø Eternal. Blue The first case of civilian use of the NSA arsenal Wanna. Cry – Ransomware Adylkuzz – Botnet for mining Ø Kernel vulnerability Elevation of privilege -> Having complete control of OS
Agenda 1 Overall Architecture 2 Error Identification 3 Path Exploration 4 Detecting Vulnerabilities

Overall Architecture
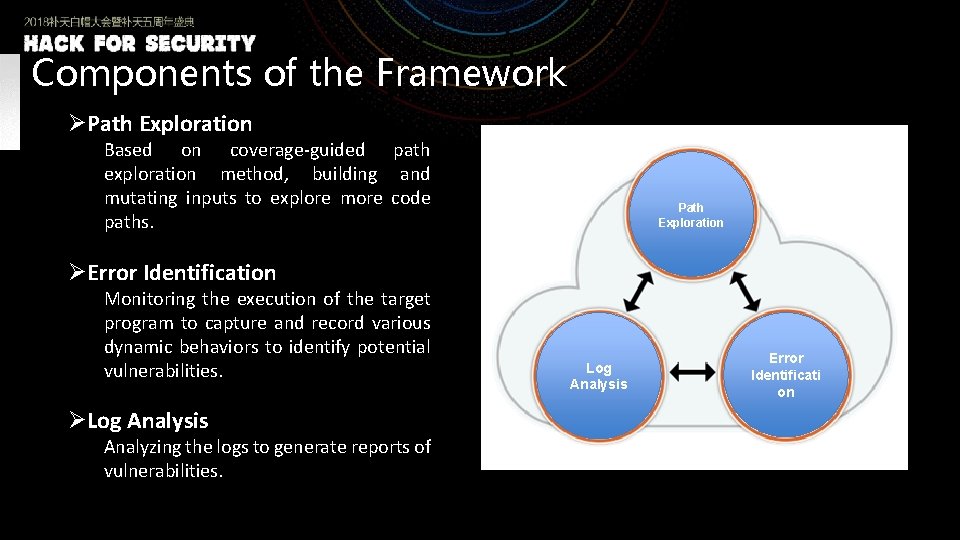
Components of the Framework ØPath Exploration Based on coverage-guided path exploration method, building and mutating inputs to explore more code paths. Path Exploration ØError Identification Monitoring the execution of the target program to capture and record various dynamic behaviors to identify potential vulnerabilities. ØLog Analysis Analyzing the logs to generate reports of vulnerabilities. Log Analysis Error Identificati on
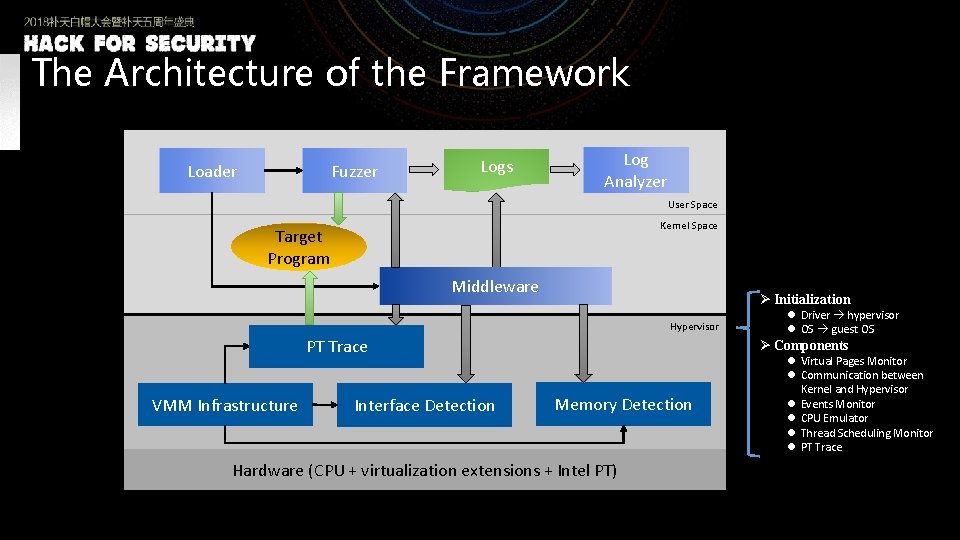
The Architecture of the Framework Loader Fuzzer Logs Log Analyzer User Space Kernel Space Target Program Middleware Guest OS Ø Initialization Hypervisor PT Trace VMM Infrastructure Interface Detection l Driver hypervisor l OS guest OS Ø Components Memory Detection Hardware (CPU + virtualization extensions + Intel PT) l Virtual Pages Monitor l Communication between Kernel and Hypervisor l Events Monitor l CPU Emulator l Thread Scheduling Monitor l PT Trace
Components of Error Identification
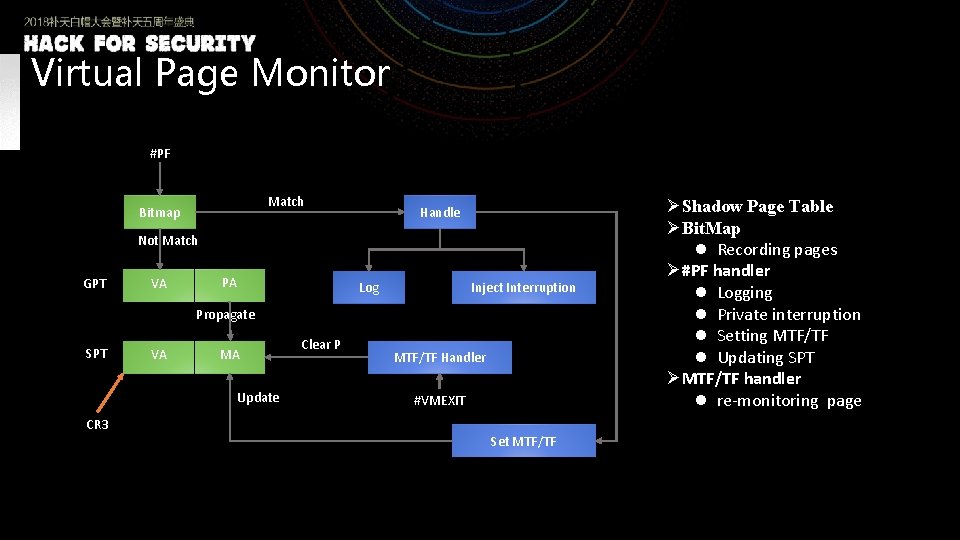
Virtual Page Monitor #PF Match Bitmap Handle Not Match GPT VA PA Log Inject Interruption Propagate SPT VA MA Update CR 3 Clear P MTF/TF Handler #VMEXIT Set MTF/TF ØShadow Page Table ØBit. Map l Recording pages Ø#PF handler l Logging l Private interruption l Setting MTF/TF l Updating SPT ØMTF/TF handler l re-monitoring page
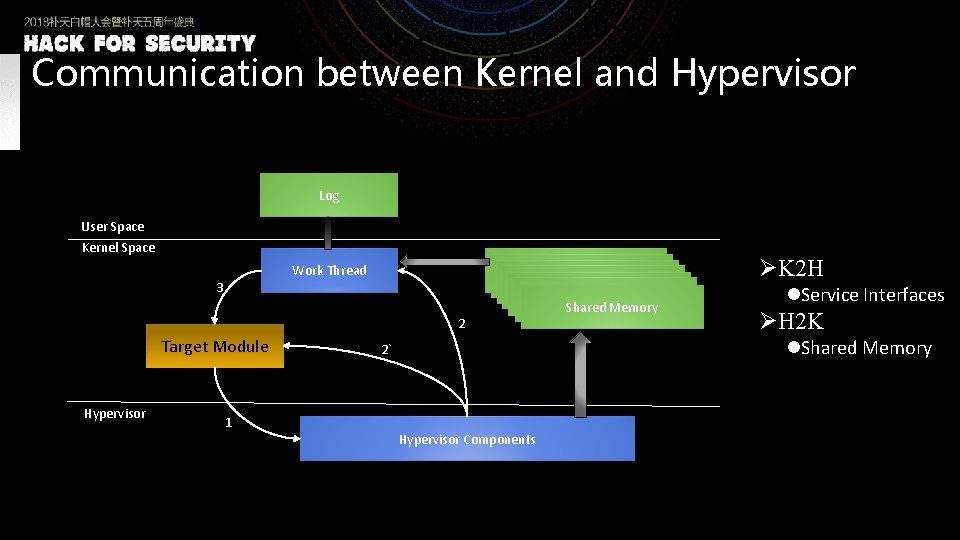
Communication between Kernel and Hypervisor Log User Space Kernel Space Work Thread 3 2 Target Module Hypervisor 1 Shared Memory Shared Memory ØK 2 H l. Service Interfaces ØH 2 K l. Shared Memory 2` Hypervisor Components
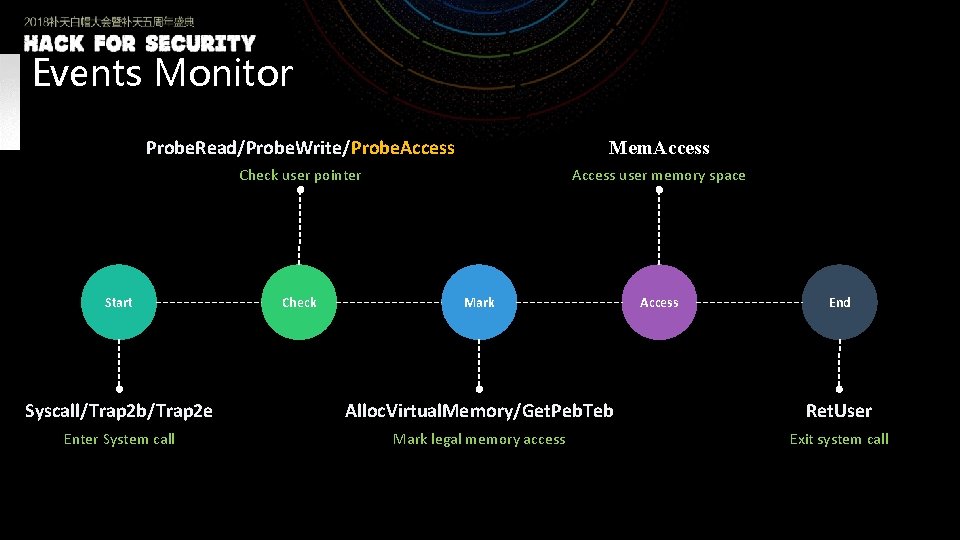
Events Monitor Probe. Read/Probe. Write/Probe. Access Mem. Access Check user pointer Access user memory space Start Check Mark Access End Syscall/Trap 2 b/Trap 2 e Alloc. Virtual. Memory/Get. Peb. Teb Ret. User Enter System call Mark legal memory access Exit system call
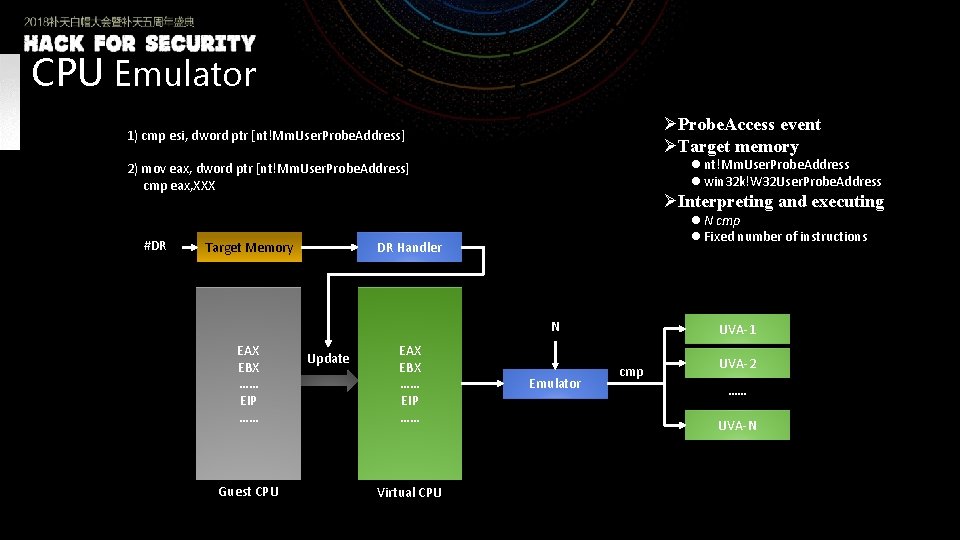
CPU Emulator ØProbe. Access event ØTarget memory 1) cmp esi, dword ptr [nt!Mm. User. Probe. Address] l nt!Mm. User. Probe. Address l win 32 k!W 32 User. Probe. Address 2) mov eax, dword ptr [nt!Mm. User. Probe. Address] cmp eax, XXX #DR Target Memory ØInterpreting and executing l N cmp l Fixed number of instructions DR Handler N EAX EBX …… EIP …… Guest CPU Update EAX EBX …… EIP …… Virtual CPU Emulator UVA-1 cmp UVA-2 …… UVA-N
Details of the Path Exploration Method
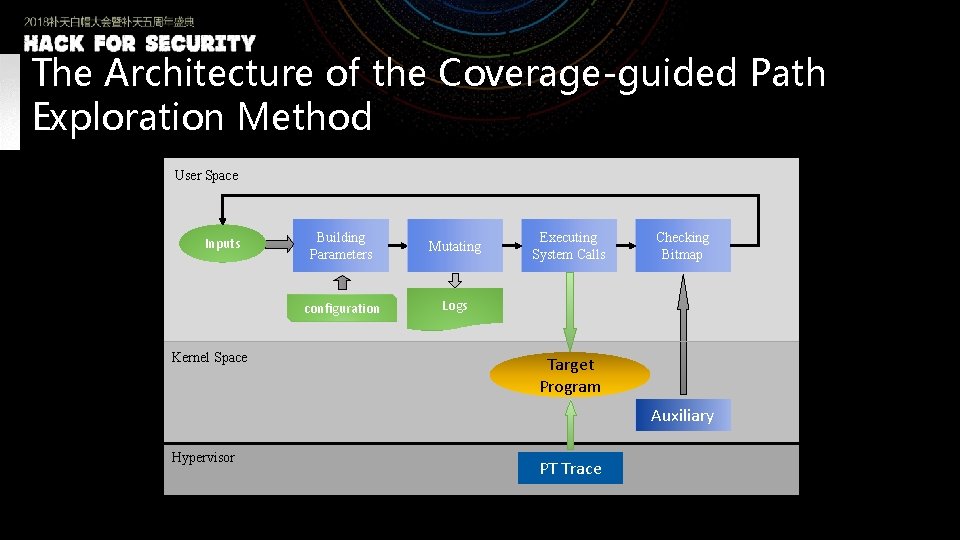
The Architecture of the Coverage-guided Path Exploration Method User Space Inputs Building Parameters configuration Kernel Space Mutating User Executing System Calls Checking Bitmap Logs Target Program Auxiliary Hypervisor PT Trace
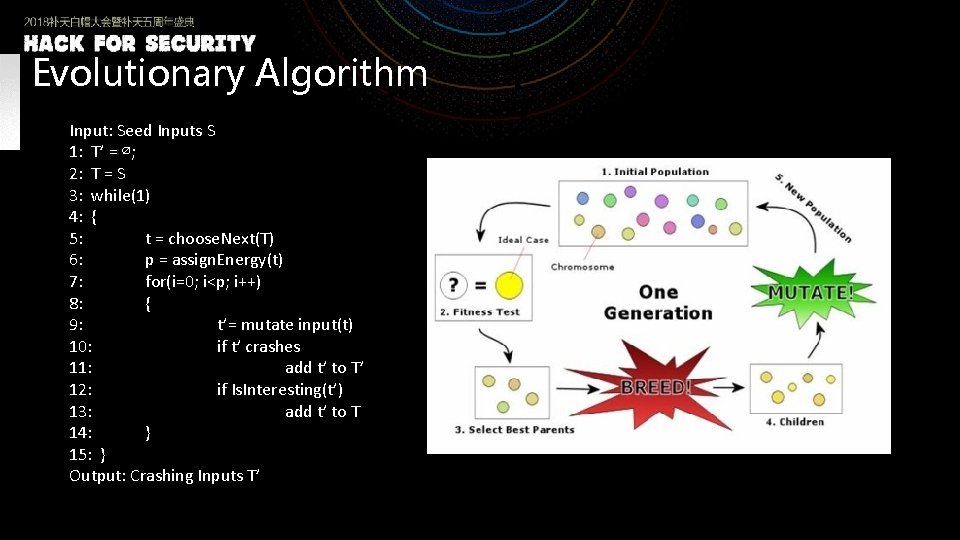
Evolutionary Algorithm Input: Seed Inputs S 1: T’ = ∅; 2: T = S 3: while(1) 4: { 5: t = choose. Next(T) 6: p = assign. Energy(t) 7: for(i=0; i<p; i++) 8: { 9: t’= mutate input(t) 10: if t’ crashes 11: add t’ to T’ 12: if Is. Interesting(t’) 13: add t’ to T 14: } 15: } Output: Crashing Inputs T’
PT Trace Ø Intel® Processor Trace (Intel PT) It captures information about software execution using dedicated hardware facilities that cause only minimal performance perturbation to the software being traced. Ø Data Packets Taken Not-Taken (TNT) packets: TNT packets track the direction of direct conditional branch. 1 signifies a taken branch and 0 signifies a not-taken branch. Target IP (TIP) packets: TIP packets record the target IP of indirect branches, exceptions, and interrupt handlers.
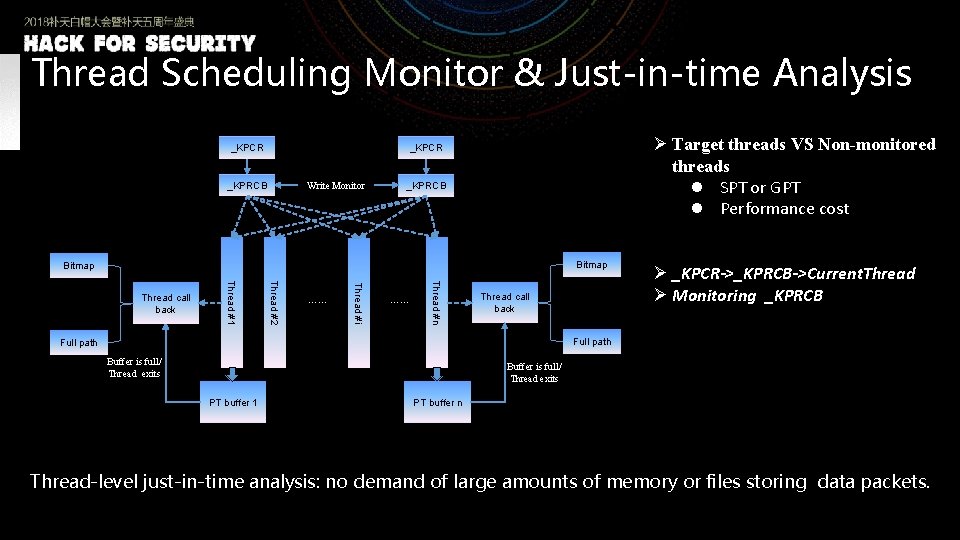
Thread Scheduling Monitor & Just-in-time Analysis _KPCR Ø Target threads VS Non-monitored threads l SPT or GPT l Performance cost _KPCR _KPRCB Write Monitor _KPRCB Bitmap …… Thread #n …… Thread #i Thread #2 Thread #1 Thread call back Ø _KPCR->_KPRCB->Current. Thread Ø Monitoring _KPRCB Full path Buffer is full/ Thread exits PT buffer 1 PT buffer n Thread-level just-in-time analysis: no demand of large amounts of memory or files storing data packets.
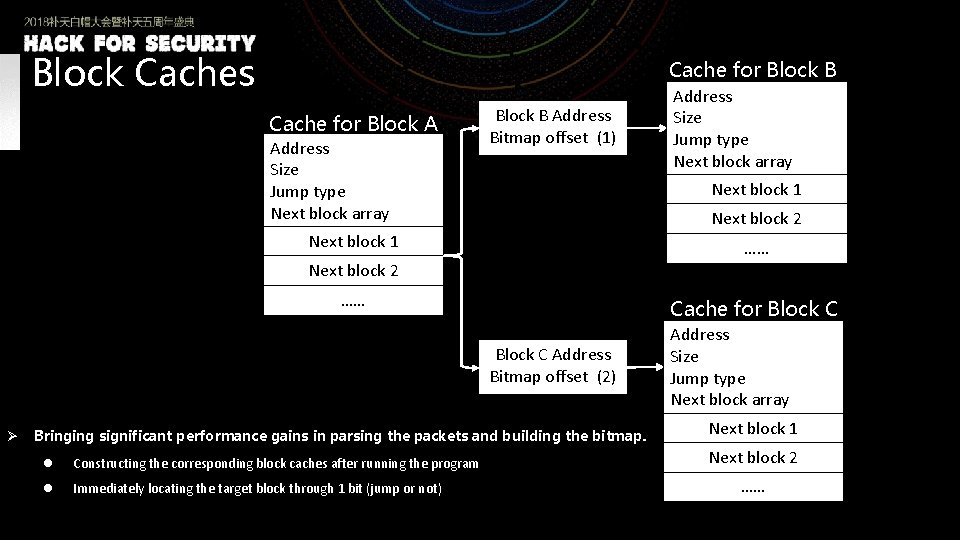
Block Caches Cache for Block B Cache for Block A Address Size Jump type Next block array Block B Address Bitmap offset (1) Address Size Jump type Next block array Next block 1 Next block 2 Next block 1 …… Next block 2 …… Cache for Block C Address Bitmap offset (2) Ø Bringing significant performance gains in parsing the packets and building the bitmap. l Constructing the corresponding block caches after running the program l Immediately locating the target block through 1 bit (jump or not) Address Size Jump type Next block array Next block 1 Next block 2 ……
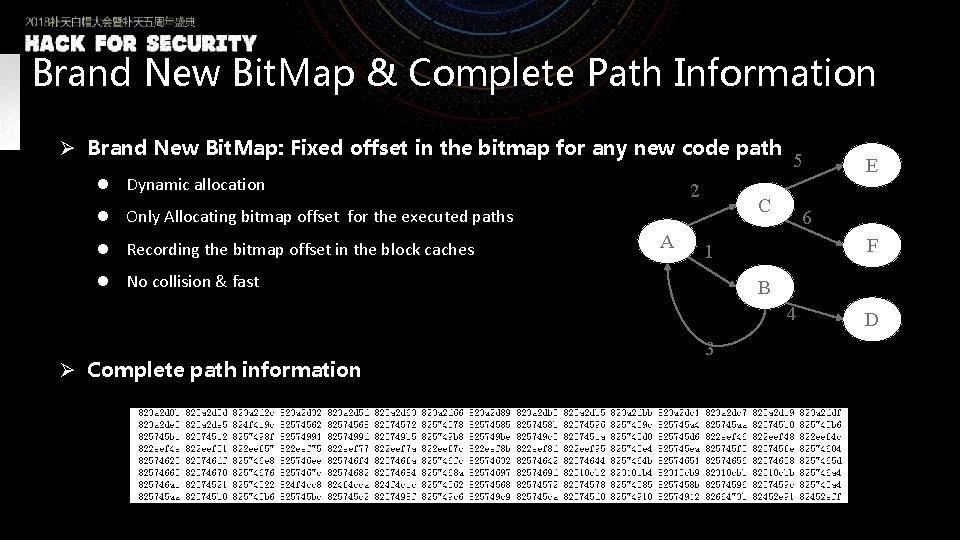
Brand New Bit. Map & Complete Path Information Ø Brand New Bit. Map: Fixed offset in the bitmap for any new code path l Dynamic allocation 2 C l Only Allocating bitmap offset for the executed paths l Recording the bitmap offset in the block caches A 5 6 F 1 l No collision & fast B 4 Ø Complete path information E 3 D
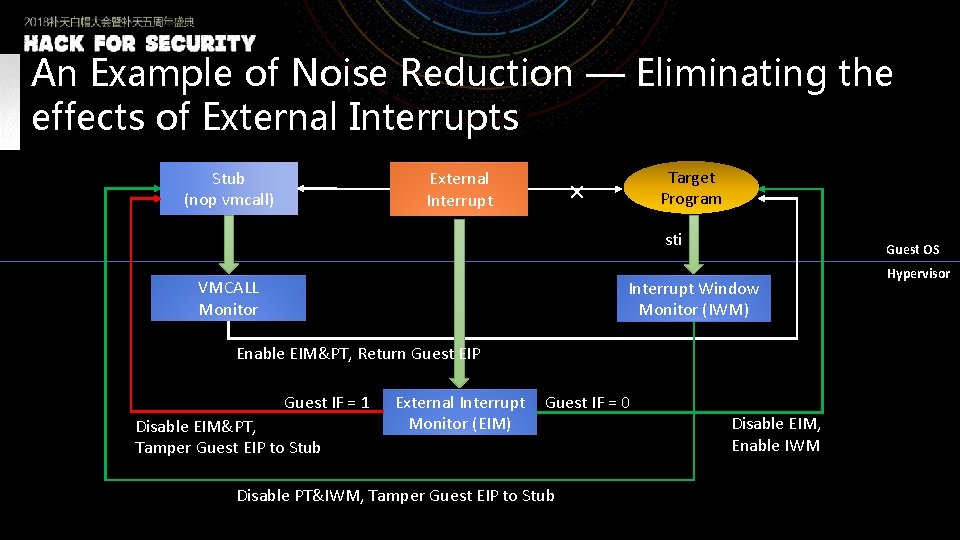
An Example of Noise Reduction — Eliminating the effects of External Interrupts Stub (nop vmcall) External Interrupt Target Program × sti VMCALL Monitor Guest OS Interrupt Window Monitor (IWM) Enable EIM&PT, Return Guest EIP Guest IF = 1 Disable EIM&PT, Tamper Guest EIP to Stub External Interrupt Monitor (EIM) Guest IF = 0 Disable PT&IWM, Tamper Guest EIP to Stub Disable EIM, Enable IWM Hypervisor
![Building & Mutating System Calls Parameters [info] ; funs count number=4 ; STRATEGY_GUID = Building & Mutating System Calls Parameters [info] ; funs count number=4 ; STRATEGY_GUID =](http://slidetodoc.com/presentation_image_h2/8bc4e533266104dde8469bd3708caae3/image-21.jpg)
Building & Mutating System Calls Parameters [info] ; funs count number=4 ; STRATEGY_GUID = 2, STRATEGY_RANDOM = 1, strategy=2 [parameters 1] index=0 x 15 c Sub. Structs. Num=3 args=_HANDLE_PTR, _UINT 32, _STRUCT_PTR, _STRUCT _PTR, _UINT 32, _HANDLE, NIL mask=0 xffff ; deep first subargs 1=_UINT 32, _HANDLE, _STRUCT_PTR, _UINT 32, _VOID_PTR, NIL submask 1=0 xffff subargs 2=_INT 16, _VOID_PTR, NIL submask 2=0 xffff subargs 3=_INT 32, _INT 64, NIL submask 3=0 xffff ……

Exported Interfaces DTENABLETRACE Enable. Trace; DTDISABLETRACE Disable. Trace; DTTRACEADDTHREAD Trace. Add. Thread; DTTRACESTARTTHREAD Trace. Start. Thread; DTTRACESTOPTHREAD Trace. Stop. Thread; DTQUERYTRACEINFORMATION Query. Trace. Information; DTENABLEIPT Enable. Ipt; DTDISABLEIPT Disable. Ipt; DTIPTQUERYINFORMATION Ipt. Query. Information; DTIPTADDTHREAD Ipt. Add. Thread; DTIPTSTARTTHREAD Ipt. Start. Thread; For thread-level path exploration DTIPTSTOPTHREAD Ipt. Stop. Thread; DTPREPAREDECODER Prepare. Decoder; DTDECODEIPTLOG Decode. Ipt. Log; DTINITIALIZEDECODECACHE Initialize. Decode. Cache; DTDECODEIPTLOGSIMPLE Decode. Ipt. Log. Simple; For just-in-time analysis DTDECODEIPTLOGTOBITMAP Decode. Ipt. Log. To. Bitmap;

Detecting Vulnerabilities
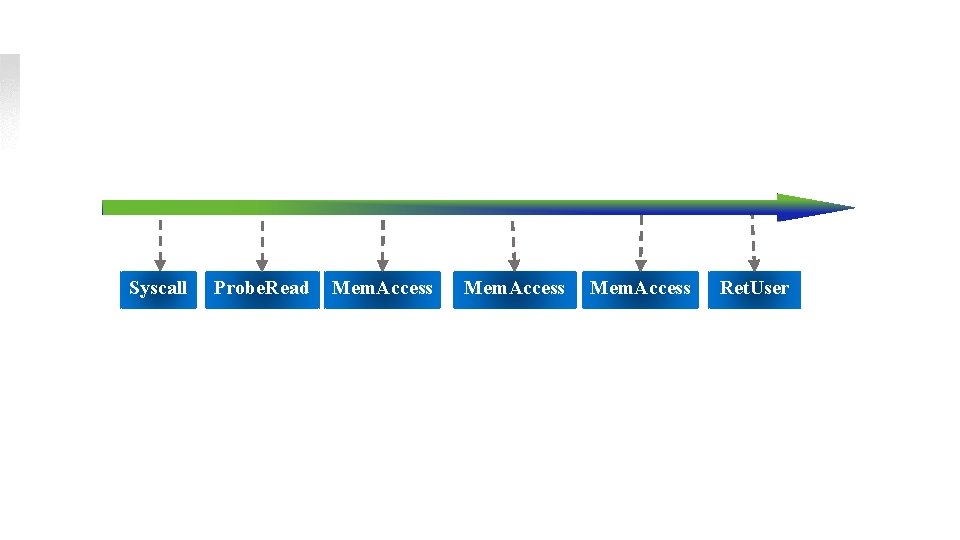
Detecting UNPROBE & TOCTTOU Vulnerabilities n Syscall n+1 n+2 n+3 Probe. Read Mem. Access (Probe X) (Access Y) n+4 Ret. User An example of recording events during system call process

Examples of UNPROBE & TOCTTOU Vulnerabilities UNPROBE (Avast 11. 2. 2262) Nt. Allocate. Virtual. Memory : Eip : 89993 f 3 d, Address : 0023 f 304, rw: R Eip : 84082 ed 9, Address : 0023 f 304, PROBE Ki. Fast. System. Call. Ret TOCTTOU (Dr. Web 11. 0) Nt. Create. Section : …… Eip : 89370 d 54 Address : 3 b 963 c Sequence : 399 rw: R Eip : 89370 d 7 b Address : 3 b 963 c Sequence : 401 rw: R Ki. Fast. System. Call. Ret

Detecting UAF Vulnerabilities ØTracing freed memory ØCapturing “use” instruction through Virtual Page Monitor ØRecording “free” instruction and its call stack when it is invoked ØDelayed release MS 16 -123/CVE-2016 -7211: Single step exception - code 80000004 (first chance) First chance exceptions are reported before any exception handling. This exception may be expected and handled. win 32 k!_Scroll. DC+0 x 21: 96 b 50 f 3 e 83 ff 01 cmp edi, 1 kd> r eax=fe 809268 ebx=96 b 50 e 37 ecx=85 eefb 40 edx=0000 esi=fe 809268 edi=0000 …… 96 b 50 f 3 b 8 b 7 e 68 mov edi , dword ptr [esi+68 h] 96 b 50 f 3 e 83 ff 01 cmp edi , 1// win 32 k !_Scroll. DC+0 x 21
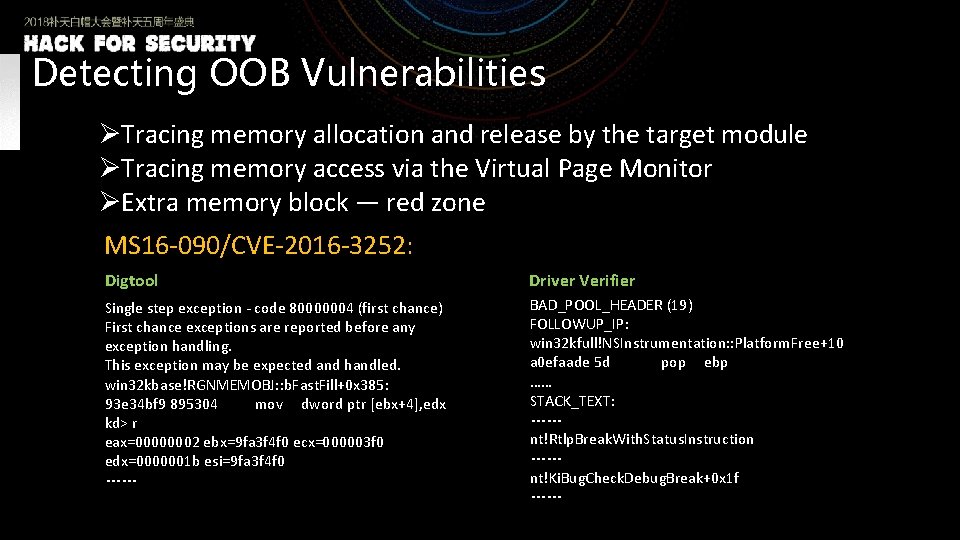
Detecting OOB Vulnerabilities ØTracing memory allocation and release by the target module ØTracing memory access via the Virtual Page Monitor ØExtra memory block — red zone MS 16 -090/CVE-2016 -3252: Digtool Driver Verifier Single step exception - code 80000004 (first chance) First chance exceptions are reported before any exception handling. This exception may be expected and handled. win 32 kbase!RGNMEMOBJ: : b. Fast. Fill+0 x 385: 93 e 34 bf 9 895304 mov dword ptr [ebx+4], edx kd> r eax=00000002 ebx=9 fa 3 f 4 f 0 ecx=000003 f 0 edx=0000001 b esi=9 fa 3 f 4 f 0 …… BAD_POOL_HEADER (19) FOLLOWUP_IP: win 32 kfull!NSInstrumentation: : Platform. Free+10 a 0 efaade 5 d pop ebp …… STACK_TEXT: …… nt!Rtlp. Break. With. Status. Instruction …… nt!Ki. Bug. Check. Debug. Break+0 x 1 f ……
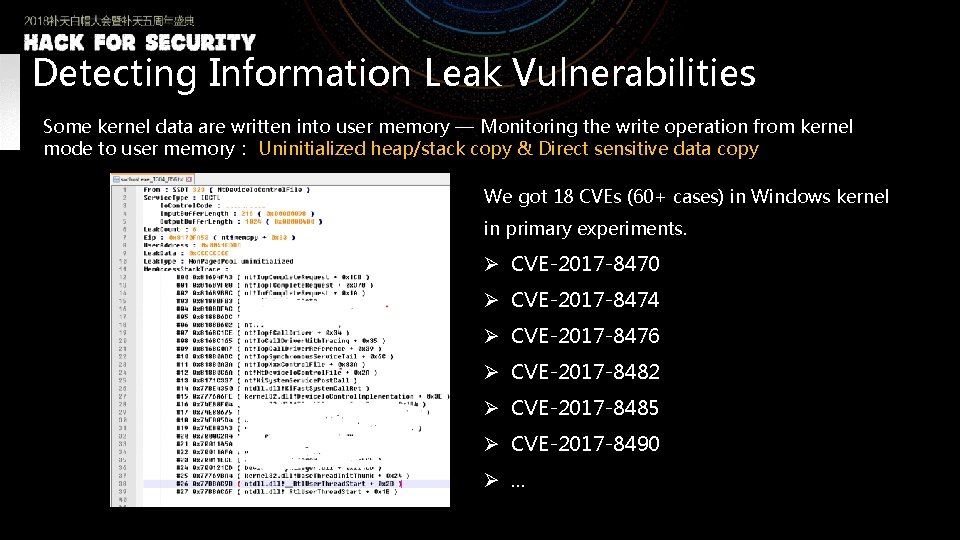
Detecting Information Leak Vulnerabilities Some kernel data are written into user memory — Monitoring the write operation from kernel mode to user memory: Uninitialized heap/stack copy & Direct sensitive data copy We got 18 CVEs (60+ cases) in Windows kernel in primary experiments. Ø CVE-2017 -8470 Ø CVE-2017 -8474 Ø CVE-2017 -8476 Ø CVE-2017 -8482 Ø CVE-2017 -8485 Ø CVE-2017 -8490 Ø. . .
Conclusion & Advantages ØCrash resilient l Record characteristics of vulnerabilities continuously. ØProviding an exact context l Be able to stop the OS at the moment a program error occurs. ØMore vulnerabilities l UNPROBE, TOCTTOU, UAF(MS 16 -123/CVE-2016 -7211), OOB, Information Leakage … ØBetter performance l Only affect monitored threads and system calls. l Intel PT brings slight performance overhead

Thank You! Ice. Sword. Lab@360. cn
- Slides: 30