A GIS AND AHP BASED VULNERABILITY ASSESSMENT FOR

A GIS AND AHP BASED VULNERABILITY ASSESSMENT FOR COASTAL EROSION CASE STUDY: SOUTHERN COASTLINE OF SRI LANKA By PGRNI Pussella SABARAGAMUWA UNIVERSITY OF SRI LANKA

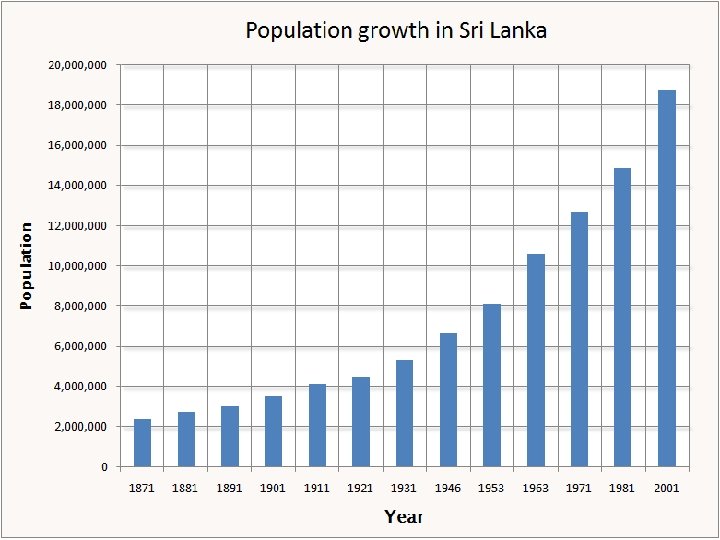
Sri Lanka

Infra Structure Development Projects

Results Bad for natural environment Frequent Natural and man made disasters

Impact on the Coast Generating New hazards Increase potential, magnitude and frequency of existing hazards These hazards may be Chronic (eg. Sea Level Rise) Episodic (eg. Storm Events) Sea Level Rise link with global warming Major challenge to the coast of Sri Lanka.

Impact on the Coast Climate Change would affect to the Physical condition of the shoreline Rising sea level Change in wave patterns Changes in wind pattern and water depth Increased rainfall The occurrence of extreme events

Impact on the Coast This Leads to several issues: Inundation and displacement of low lying coastal areas and wetlands Coastal erosion Degradation of shorelines Salinization of estuaries and freshwater Changes of coastal eco-systems and habitats

Coast of Sri Lanka Two monsoons: Southwest and Northeast. Southwest waves are coming from the bare sea with heavy energy and hit on southern and western coastlines. 1600 km in length Was not a big issue due to sediment supply from rivers

Main Reasons for Erosion Coastline geometry Sediment instability Wave incident angle Destruction of mangrove land cover 120 km 2 in 1986 60 km 2 in 2000) Shrimp farming
 Erosion % of Erosion Level Coastline (m/ Year) Colombo")
Erosion Scenario District Coastline (km) Erosion % of Erosion Level Coastline (m/ Year) Colombo 40 40 – 50 0. 0 – 0. 1 Kalutara 40 70 – 80 0. 1 – 0. 5 Galle 75 70 – 80 0. 3 Matara 55 80 0. 9 – 1. 0 Hambantota 135 40 – 50 0. 2 Jaffna 275 60 – 70 0. 3 Mullaitivu 50 20 – 30 0. 2
 Management oriented approach 1971 Coast Conservation Department")
Mitigation Acts The Coast Protection Unit (1963) Management oriented approach 1971 Coast Conservation Department (1978) to halt the continued deterioration of the coastal zone Coast Conservation Act No. 57 (1981) - permits System within 300 m No Build Coastal Buffer Zone (2004)

Objectives Assess the vulnerability of the South Western coastal area for coastal erosion Very vulnerable for coastal disasters Tsunami disaster 30 000 deaths 100 000 loss of houses Very important for mitigation and adaptation, aiming to reduce losses.
 Composite Vulnerability Index Multi")
Coastal Vulnerability Assessments Index based methods Coastal Vulnerability Index (CVI) Composite Vulnerability Index Multi – Scale Coastal Vulnerability Index Indicator based approach GIS based decision support systems DEcision support SYstem for COastal climate change (DESYCO) Dynamic computer models Risk Assessment of Coastal Erosion (RACE) Dynamic Interactive Vulnerability Assessment model (DIVA)
 The most commonly used method A Simple method Provides a")
Coastal Vulnerability Index (CVI) The most commonly used method A Simple method Provides a simple numerical basis for ranking sections of coastline in terms of their potential for change to identify regions where risks may be relatively high

Study Area

Methodology Data requirements 1: 10, 000 topographic maps Google Earth images Field Surveys Questionnaire Surveys Factors for Vulnerability Geomorphology Width of the sand dune Coastal slope Rate of coastline change Average tidal range Direction of tides Mean wave height Availability of coastal protection measures Vegetation cover of the adjacent land to the coast

Methodology Field data collection 01 km regular intervals Spatial interpolation technique in GIS with raster cell size of 100 m. Sub criteria - Semi structured questionnaire 20 experts 05 officers from coastal conservation 10 academics 05 government officers.

Factors and Initial Weights Factor Initial Ranking of Coastal Vulnerability Factors Very low Low Moderate High Very high High hard rock cliffs Medium cliffs Estuaries/ lagoons Muddy Sandy coasts Sand dune width (m) >50 30 -50 10 -30 3 -10 <3 Coastal slope (%) >2. 0 1 -2 0. 5 -1 0. 1 -0. 5 <0. 1 Geomorphology Rate of coastline erosion (m/yr) Average tidal range (m) <0 0 -0. 2 -0. 5 -1 >1 <0. 5 -1 1 -1. 5 -2 >2 Direction of tides (Deg. ) >800 700 -800 600 -700 450 -600 <450 Mean wave height (m) <0. 2 -0. 5 -1 1 -2 >2 Natural barriers - Man-made barriers - Open Forest Shrubs Agriculture Marshy/ Water Built up Protection measures Adjacent Landuse

Analytical Hierarchical Process Semi structured questionnaire Relative influences for CVI – through Hierarchical tree structure Comparison judgment with nine degree scale Priority composition - pair wise matrix

Hierarchical Structure GOAL LEVEL A - Coastal Slope B – Geomorphology idth C - Rate of Erosion D – Dune Width Developing CVI E – Direction of Tides F – Ave. Tidal Range G – Mean Wave Height H - Protection Measures I - Adjacent Land-use

Nine Degree Scale & Pair wise Comparison Degree Description of pair wise comparison judgment 1 Criteria i is equally important as Criteria j 3 Criteria i is moderately more important as Criteria j 5 Criteria i is strongly more important as Criteria j 7 Criteria i is very strongly more important as Criteria j 9 Criteria i is extremely more important as Criteria j 2, 4, 6, 8 The importance is between the two degrees When criteria A is strongly important than B A 9 8 7 6 5 4 3 2 1 2 3 4 5 6 7 8 9 B

Pair Wise Comparison Matrix A B C D E F G H I SUM A B C D E F G H I 1 1/2 1/4 1/5 1/7 1/6 1/4 1/9 2 1 1 1/3 1/4 1/2 1/3 4 1 1 1/3 1/4 1/6 1/5 1/6 1/9 5 3 3 1 1/3 1/4 1/4 1/7 5 3 4 3 1 1/9 1/8 1/5 7 4 6 4 9 1 1 1/8 1/4 6 4 5 4 8 1 1 1/2 1/3 4 2 6 4 5 8 2 1 1 9 3 9 7 5 4 3 1 1 2. 821 6. 000 7. 228 13. 226 16. 636 32. 375 29. 833 33. 000 42. 000 “Minority should obey to the majority” theory

Normalized Matrix Dividing cell values from the sum of respective columns A A B B C D E F G H I 0. 355 0. 333 0. 553 0. 378 0. 301 0. 216 0. 201 0. 121 0. 214 0. 177 C 0. 089 D 0. 071 E 0. 071 F 0. 051 G 0. 059 H 0. 089 I 0. 039 SUM 1 0. 167 0. 056 0. 042 0. 083 0. 056 1 0. 138 0. 046 0. 035 0. 023 0. 028 0. 023 0. 015 1 0. 227 0. 076 0. 025 0. 019 0. 011 1 0. 180 0. 240 0. 180 0. 060 0. 007 0. 008 0. 012 1 0. 124 0. 185 0. 124 0. 278 0. 031 0. 004 0. 008 1 0. 134 0. 168 0. 134 0. 268 0. 034 0. 017 0. 011 1 0. 061 0. 182 0. 121 0. 152 0. 242 0. 061 0. 030 1 0. 071 0. 214 0. 167 0. 119 0. 095 0. 071 0. 024 1 Final Influence 2. 673 1. 279 1. 610 0. 974 1. 063 0. 543 0. 351 0. 301 0. 206 9
 A Coastal slope 29. 71 B Geomorphology 14.")
Final Weights of Criteria Weight (%) A Coastal slope 29. 71 B Geomorphology 14. 21 C Rate of erosion 17. 89 D Dune width 10. 82 E Direction of tides 11. 81 F Average tidal range 6. 03 G Mean wave height 3. 90 H Protection measures 3. 34 I Adjacent landuse 2. 29 SUM 100. 00

Classification of CVI Values Vulnerability status Very low CVI value range 148 – 211 Low 212 – 248 Moderate High Very high 249 – 282 283 – 328 329 – 411

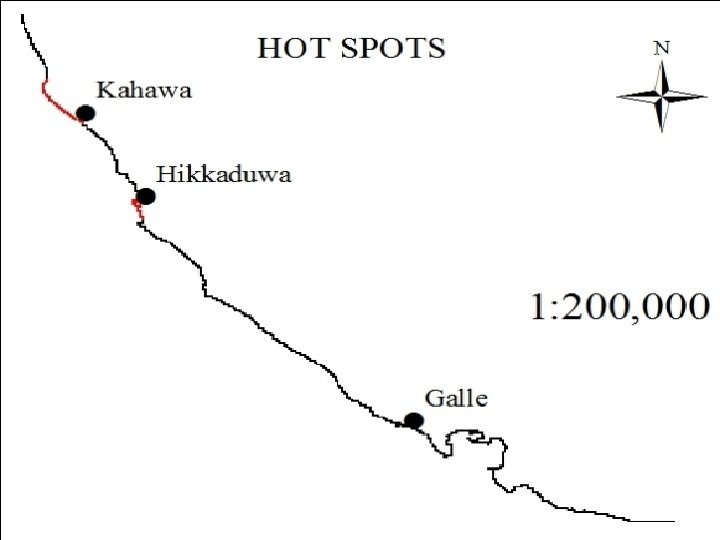
FINAL VULNERABILITY CLASSIFIED MAP 1: 200, 000

CVI Values Criteria Value Field Rank Weight Rank * Weight 0. 02 0. 2293 1. 1465 Mainland Beach 5 5 0. 1919 0. 9595 -0. 05 3 0. 1814 0. 5442 Land Use Pattern P 1 0. 1202 Geomorphology B 5 0. 1121 0. 5605 Relative Sea Level Change 2. 2 4 0. 0586 0. 2344 Beach Types RE 5 0. 0470 0. 2350 Dune Height 12 3 0. 0293 0. 0879 Mean Tidal Range 0. 7 4 0. 0157 0. 0628 Mean Wave Height 0. 3 1 0. 0145 Regional Coastal Slope Barrier Types Shoreline Erosion & Accretion Final CVI Value 3. 9655
 Very Low Vulnerable 12. 25 Low Vulnerable 29. 40")
Classification Vulnerability Class Percentage (%) Very Low Vulnerable 12. 25 Low Vulnerable 29. 40 Moderately Vulnerable 27. 11 Highly Vulnerable 23. 74 Very Highly Vulnerable 7. 50
 of the total line segment Factor Coastal Slope")
Pearson product moment correlation coefficients (r) of the total line segment Factor Coastal Slope Geomorphology Erosion rate Dune width Tide direction Tidal range Wave height Protection type Adj. landuse Correlation 0. 7392 0. 1810 0. 3152 -0. 2590 -0. 3775 -0. 0161 -0. 1427 -0. 1046 -0. 2558 Category High Low Medium Low Low Medium

Concluding Remarks Higher risk is there with the open areas and low coastal slope Vulnerability is a cumulative effect Different variables act in a different way at different locations Suggests to conduct more studies with micro level datasets.

Concluding Remarks Immediate attention is needed for Hot Spots Constructing hard stone barriers is not enough Rate of erosion is severe in some areas after constructing these stone barriers. Systematic analysis of the profile of the coastline is a must

Publications Lin L, Pussella PGRNI Assessment of vulnerability for coastal erosion with GIS and AHP techniques case study: Southern coastline of Sri Lanka. NATURAL RESOURCE MODELING (SCI Indexed) 2017; 00: e 12146. Doi: 10. 1111/nrm. 12146

Thank You Very Much
- Slides: 35