A genetic approach to the automatic clustering problem

A genetic approach to the automatic clustering problem Author : Lin Yu Tseng Shiueng Bien Yang Graduate : Chien-Ming Hsiao

Outline n Motivation Objective Introduction The basic concept of the genetic strategy n The genetic clustering algorithm n n n The heuristic to find a good clustering Conclusion Personal Opinion

Motivation n Some clustering algorithms require the user to provide the number of clusters as input n It is not easy for the user to guess how many clusters should be there. n n The user in general has no idea about the number of clusters. The clustering result may be no good n Especially when the number of clusters is large and not easy to guess

Objective n Propose a genetic clustering algorithm n n Will automatically search for a proper number Classify the objects into these clusters

Introduction n The clustering methods n Hierarchical n n The agglomerative methods The divisive methods Non-Hierarchical The K-means algorithm n n Is an iterative hill-climbing algorithm the solution obtained depends on the initial clustering

The basic concept of the genetic strategy

The genetic clustering algorithm n The algorithm CLUSTERING consists of two stages n The nearest-neighbor algorithm. n n n To group those data that are close to one another. To reduce the size of the data to a moderate one that is suitable for the genetic clustering algorithm. Genetic clustering algorithm. n n To group the small clusters into larger cluster. A heuristic strategy is then used to find a good clustering.

The nearest-neighbor algorithm. The distance n n Base on the average of the nearest-neighbor distances Steps n 1. For each object Oi , find the distance between Oi and its nearest neighbor.

The nearest-neighbor algorithm Steps n 2. 3. Compute dav, the average of the nearest-neighbor distance by using step 1 View the n objects as nodes of a graph. Compute the adjacency matrix An*n

The nearest-neighbor algorithm Steps n 4. n n Find the connected components of this graph. The data sets represented by these connected components be denoted by B 1, B 2, …, Bm The center of each set be denoted by n n Vi , 1 ≤ i ≤ m

The genetic algorithm n n Initialization step Iterative generations n n n Reproduction phase Crossover phase Mutation phase

The genetic algorithm n Initialization step n A population of N strings is randomly generated n The length of each string is m n n n m is the number of the sets obtained in the first stage. If Bi is in this subset, the ith position of the string will be 1; otherwise, it will be 0 Each Bi in the subset is used as a seed to generate a cluster.

The genetic algorithm

The genetic algorithm n How to generate a set of clusters from the seeds n n n Let T = {T 1, T 2, …, Ts} be the subset corresponding to a string. The initial clusters Ci’s are Ti’s and initial centers Si’s of clusters are Vi’s for i = 1, 2, …, s. The size of cluster Ci is Ci = Ti for i = 1, 2, …, s, where Ti denotes the number of objects belonging to Ti

The genetic algorithm n n n The Bi’s in {B 1, B 2, …, Bm} – T are taken one by one and the distance between the center Vi of the taken Bi. the center Sj of each cluster Cj is calculated If Bi is classified as in the cluster Cj, the center Sj and the size of the cluster Cj will be recomputed

The genetic algorithm n Reproduction phase n n n The intra-distance in the center Ci The inter-distance between this cluster Ci and the set of all other clusters. The fitness function of a string R

The genetic algorithm n Crossover phase n n n Two random number p and q in [1, m] are generated to decide which pieces of the string are to be interchanged. The crossover operator is done with probability pc Mutation Phase n Each chosen bit will be changed from 0 to 1 or from 1 to 0.
 estimates the")
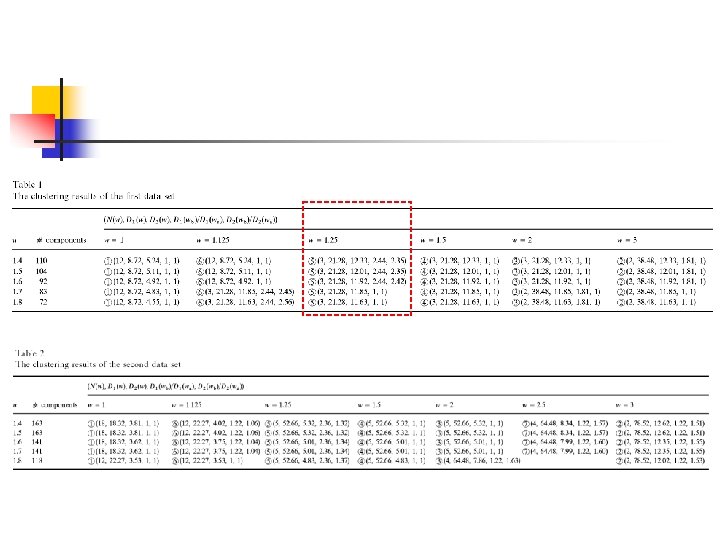
The heuristic strategy to find a good clustering n n D 1(w) estimates the closeness of the clusters in the clustering D 2(w) estimates the compactness of the clusters in the clustering

The heuristic strategy to find a good clustering n n The value of w’s are chosen from [w 1, w 2] by some kind of binary search To finds the greatest jump on the values of D 1(w)’s and the greatest jump on the values of D 2(w)’s. n Based on these jumps, it then decides which a good clustering is

Experiments n n The population size is 50 The crossover rate is 80 % The mutation rate is 5 % [w 1, w 2] = [1, 3] n n w 1 is the smallest value, w 2 is the largest value Three sets of data were used
 n n Fig. (b), (c) n n K-mean algorithm Fig. (d)")
n Fig. (a) n n Fig. (b), (c) n n K-mean algorithm Fig. (d) n n The first set of data consists of three groups of points on the plane. The densities of three groups are not the same Complete-link method Fig. (e) n Single-link method
 n n Fig. (b), (c) and (d) n n The original")
n Fig. (a) n n Fig. (b), (c) and (d) n n The original data set with five groups of points K-mean algorithm Fig. (e) n By CLUSTERING, complete-link, singlelink and K-mean
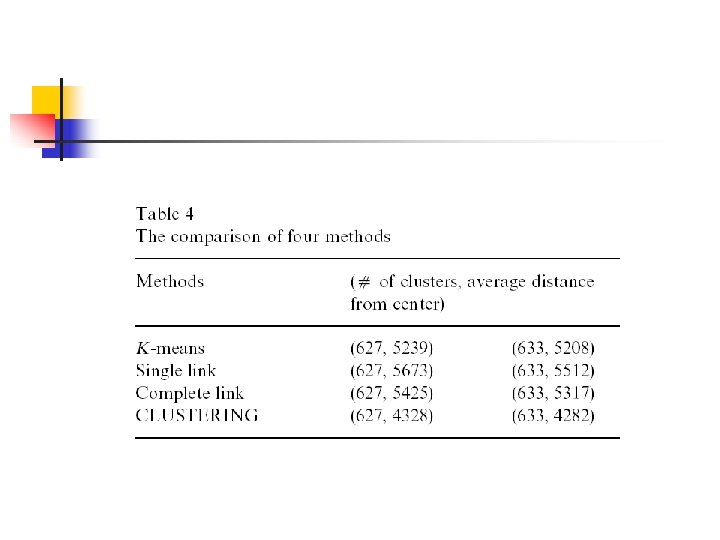

Conclusion and Personal Opinion n n The experimental results show that CLUSTERING is effective. Can automatically search for a proper number as the number of clusters.
- Slides: 25