A Framework for Online Performance Analysis and Visualization
- Slides: 22

A Framework for Online Performance Analysis and Visualization of Large. Scale Parallel Applications Kai Li, Allen D. Malony, Robert Bell, Sameer Shende {likai, malony, bertie, sameer}@cs. uoregon. edu Department of Computer and Information Science Computational Science Institute, Neuro. Informatics Center University of Oregon

Outline Problem description r Scaling and performance observation r Interest in online performance analysis r General online performance system architecture r Access models ¦ Profiling issues and control issues ¦ r Framework for online performance analysis TAU performance system ¦ SCIRun computational and visualization environment ¦ Experiments r Conclusions and future work r PPAM 2003 Framework for Online Performance Analysis, and Visualization 2

Problem Description r Need for parallel performance observation ¦ r In general, there is the concern for intrusion ¦ r Issues of data size, processing time, and presentation Online approaches add capabilities as well as problems ¦ r Seen as a tradeoff with accuracy of performance diagnosis Scaling complicates observation and analysis ¦ r Instrumentation, measurement, analysis, visualization Performance interaction, but at what cost? Tools for large-scale performance observation online Supporting performance system architecture ¦ Tool integration, effective usage, and portability ¦ PPAM 2003 Framework for Online Performance Analysis, and Visualization 3

Scaling and Performance Observation r Consider “traditional” measurement methods Profiling: summary statistics calculated during execution ¦ Tracing: time-stamped sequence of execution events ¦ r More parallelism more performance data overall Performance specific to each thread of execution ¦ Possible increase in number interactions between threads ¦ Harder to manage the data (memory, transfer, storage, …) r More parallelism / performance data harder analysis r More time consuming to analyze ¦ More difficult to visualize (meaningful displays) ¦ r Need techniques to address scaling at all levels PPAM 2003 Framework for Online Performance Analysis, and Visualization 4

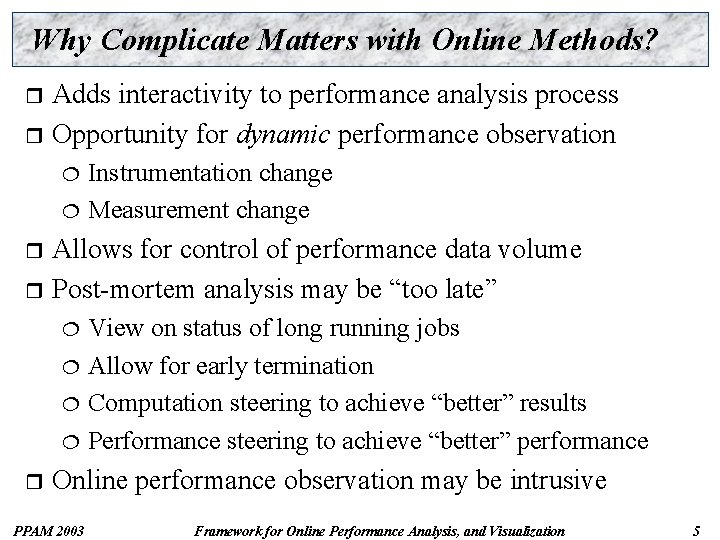
Why Complicate Matters with Online Methods? Adds interactivity to performance analysis process r Opportunity for dynamic performance observation r Instrumentation change ¦ Measurement change ¦ Allows for control of performance data volume r Post-mortem analysis may be “too late” r View on status of long running jobs ¦ Allow for early termination ¦ Computation steering to achieve “better” results ¦ Performance steering to achieve “better” performance ¦ r Online performance observation may be intrusive PPAM 2003 Framework for Online Performance Analysis, and Visualization 5

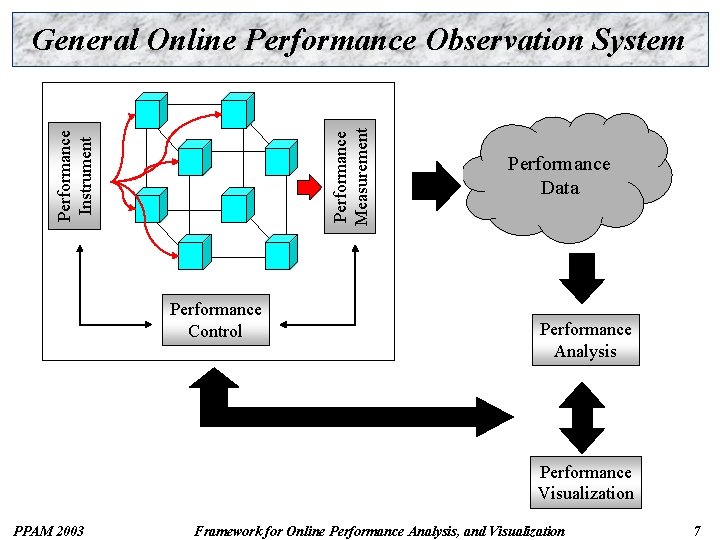
Performance Instrument Performance Measurement General Online Performance Observation System Performance Control Performance Data Performance Analysis Performance Visualization PPAM 2003 Framework for Online Performance Analysis, and Visualization 7

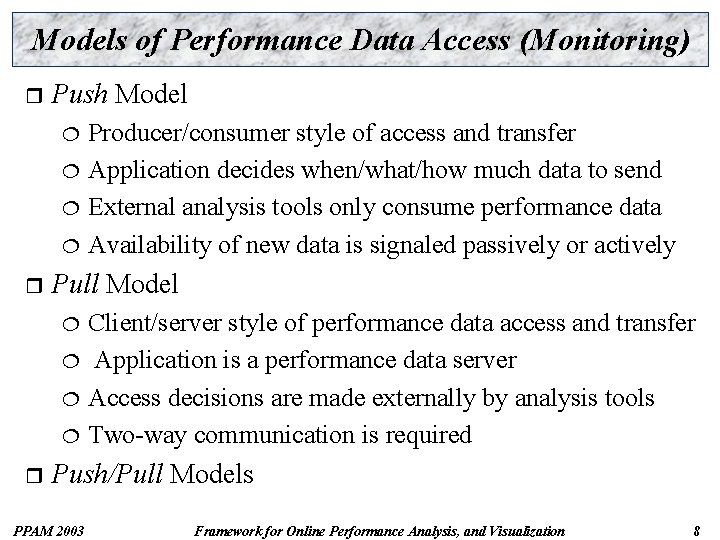
Models of Performance Data Access (Monitoring) r Push Model Producer/consumer style of access and transfer ¦ Application decides when/what/how much data to send ¦ External analysis tools only consume performance data ¦ Availability of new data is signaled passively or actively ¦ r Pull Model Client/server style of performance data access and transfer ¦ Application is a performance data server ¦ Access decisions are made externally by analysis tools ¦ Two-way communication is required ¦ r Push/Pull Models PPAM 2003 Framework for Online Performance Analysis, and Visualization 8

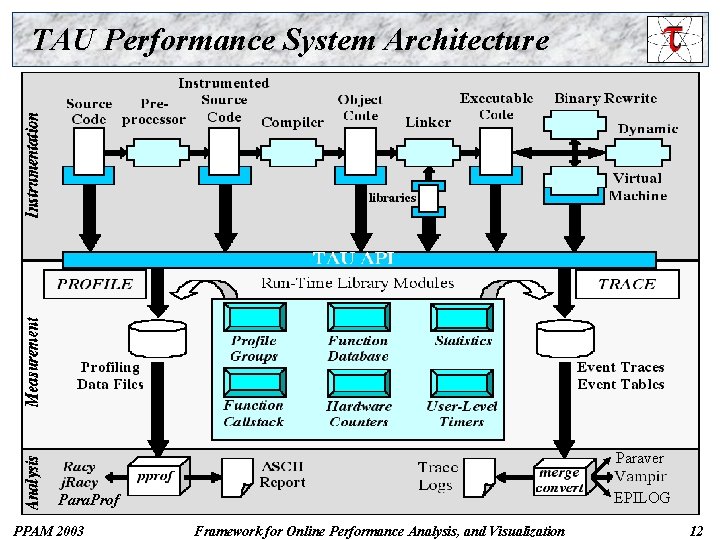
TAU Performance System Architecture Paraver EPILOG Para. Prof PPAM 2003 Framework for Online Performance Analysis, and Visualization 12

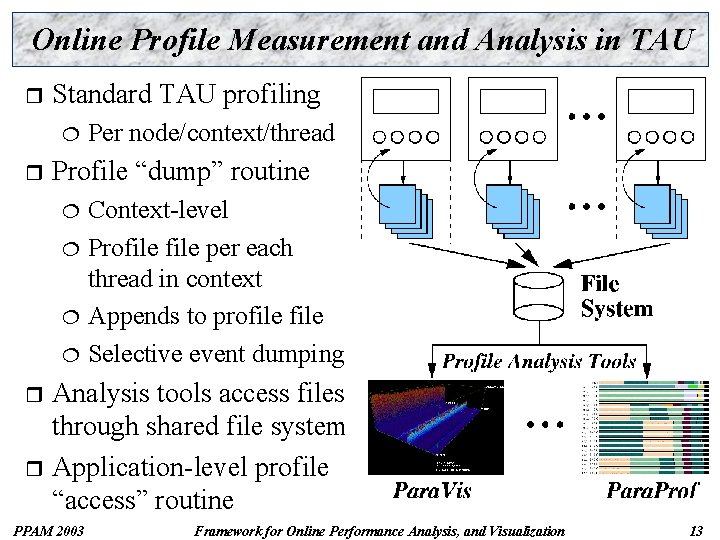
Online Profile Measurement and Analysis in TAU r Standard TAU profiling ¦ r Per node/context/thread Profile “dump” routine Context-level ¦ Profile per each thread in context ¦ Appends to profile ¦ Selective event dumping ¦ Analysis tools access files through shared file system r Application-level profile “access” routine r PPAM 2003 Framework for Online Performance Analysis, and Visualization 13

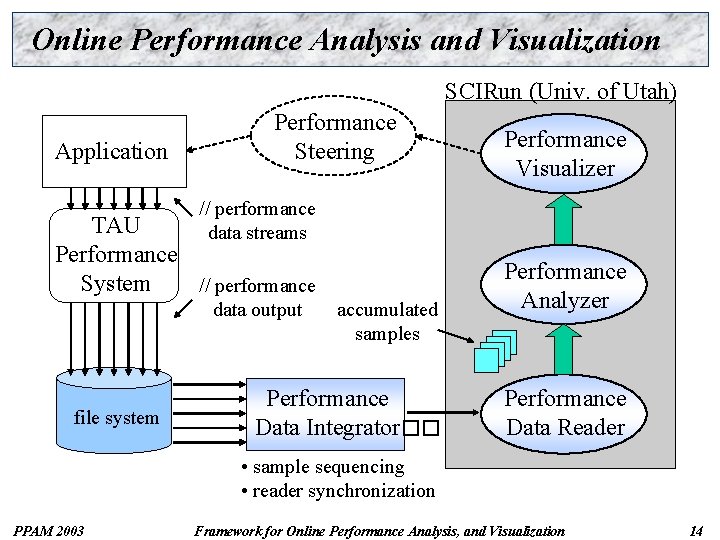
Online Performance Analysis and Visualization SCIRun (Univ. of Utah) Application Performance Steering Performance Visualizer // performance data streams TAU Performance System // performance data output file system accumulated samples Performance Data Integrator�� Performance Analyzer Performance Data Reader • sample sequencing • reader synchronization PPAM 2003 Framework for Online Performance Analysis, and Visualization 14

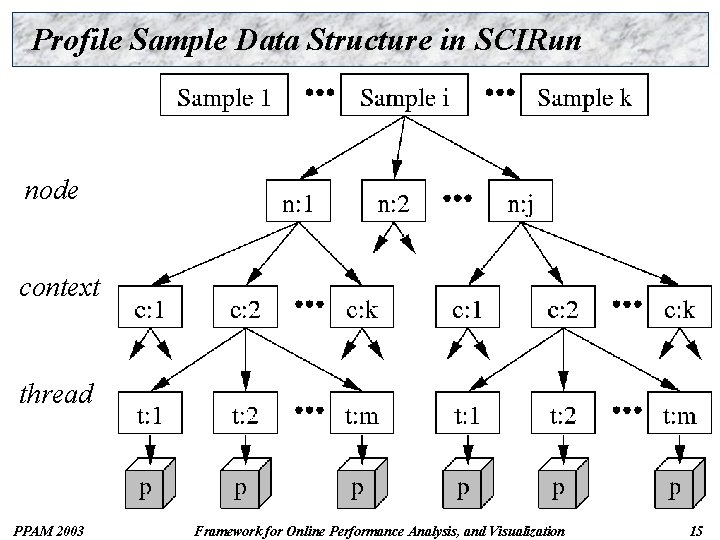
Profile Sample Data Structure in SCIRun node context thread PPAM 2003 Framework for Online Performance Analysis, and Visualization 15

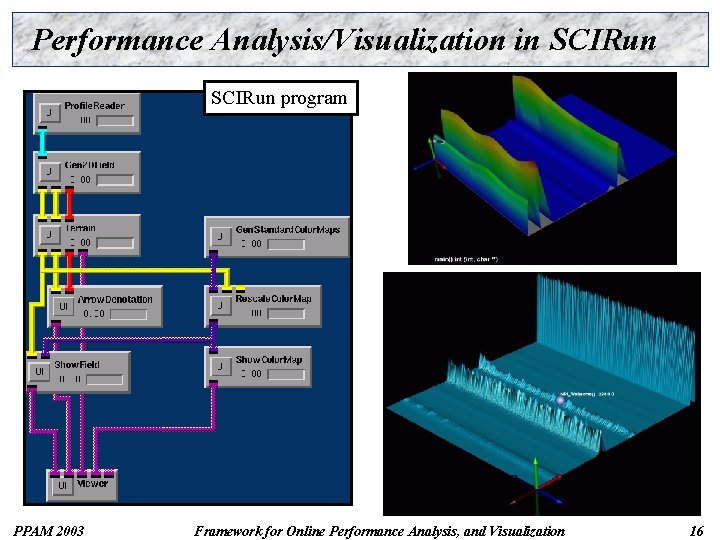
Performance Analysis/Visualization in SCIRun program PPAM 2003 Framework for Online Performance Analysis, and Visualization 16

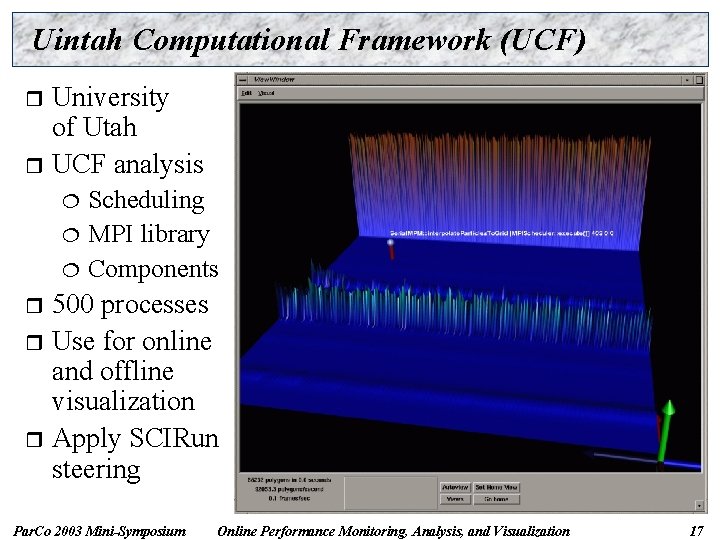
Uintah Computational Framework (UCF) University of Utah r UCF analysis r Scheduling ¦ MPI library ¦ Components ¦ 500 processes r Use for online and offline visualization r Apply SCIRun steering r Par. Co 2003 Mini-Symposium Online Performance Monitoring, Analysis, and Visualization 17

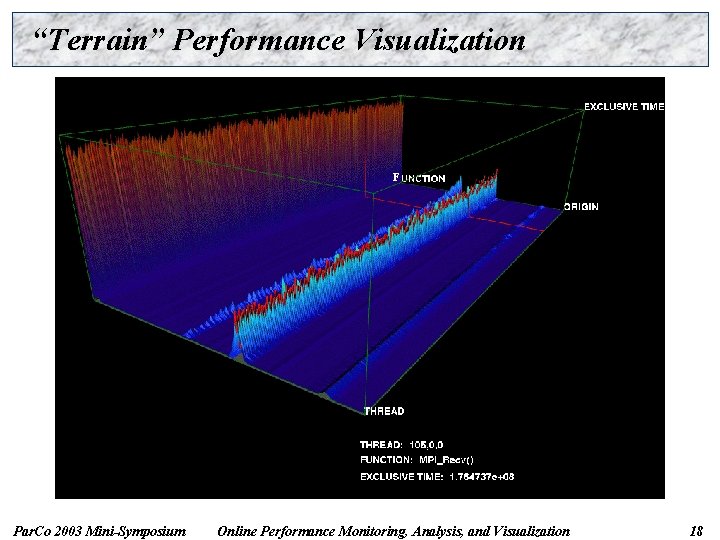
“Terrain” Performance Visualization F Par. Co 2003 Mini-Symposium Online Performance Monitoring, Analysis, and Visualization 18

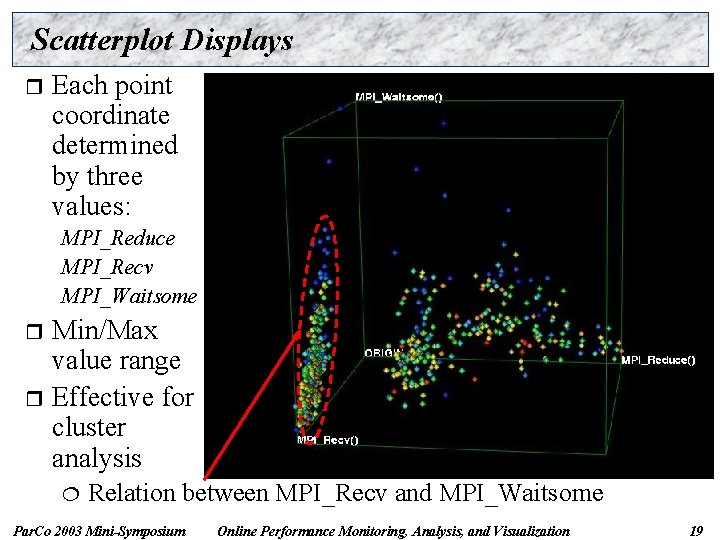
Scatterplot Displays r Each point coordinate determined by three values: MPI_Reduce MPI_Recv MPI_Waitsome Min/Max value range r Effective for cluster analysis r ¦ Relation between MPI_Recv and MPI_Waitsome Par. Co 2003 Mini-Symposium Online Performance Monitoring, Analysis, and Visualization 19

Online Unitah Performance Profiling Demonstration of online profiling capability r Colliding elastic disks r Test material point method (MPM) code ¦ Executed on 512 processors ASCI Blue Pacific at LLNL ¦ r Example 1 (Terrain visualization) Exclusive execution time across event groups ¦ Multiple time steps ¦ r Example 2 (Bargraph visualization) ¦ r MPI execution time and performance mapping Example 3 (Domain visualization) ¦ Task time allocation to “patches” Par. Co 2003 Mini-Symposium Online Performance Monitoring, Analysis, and Visualization 20

Example 1 (Event Groups) Par. Co 2003 Mini-Symposium Online Performance Monitoring, Analysis, and Visualization 21

Example 2 (MPI Performance) Par. Co 2003 Mini-Symposium Online Performance Monitoring, Analysis, and Visualization 22

Example 3 (Domain-Specific Visualization) Par. Co 2003 Mini-Symposium Online Performance Monitoring, Analysis, and Visualization 23

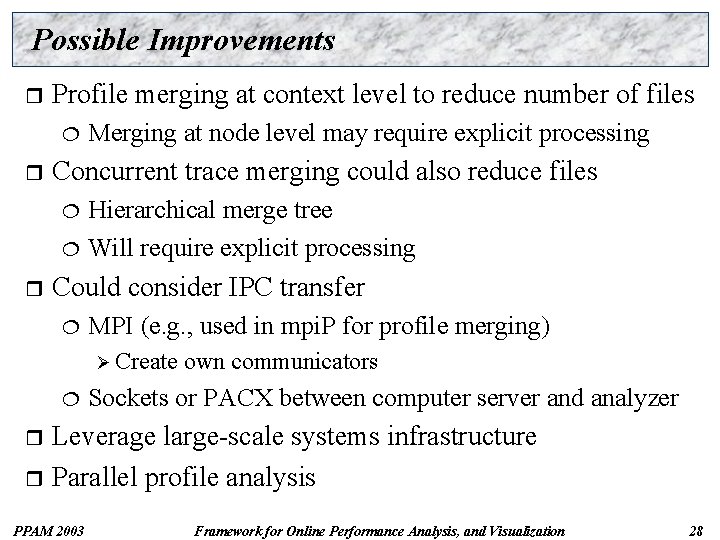
Possible Improvements r Profile merging at context level to reduce number of files ¦ r Merging at node level may require explicit processing Concurrent trace merging could also reduce files Hierarchical merge tree ¦ Will require explicit processing ¦ r Could consider IPC transfer ¦ MPI (e. g. , used in mpi. P for profile merging) Ø Create ¦ own communicators Sockets or PACX between computer server and analyzer Leverage large-scale systems infrastructure r Parallel profile analysis r PPAM 2003 Framework for Online Performance Analysis, and Visualization 28

Concluding Remarks Interest in online performance monitoring, analysis, and visualization for large-scale parallel systems r Need to intelligently use r Benefit from other scalability considerations of the system software and system architecture r See as an extension to the parallel system architecture r Avoid solutions that have portability difficulties r In part, this is an engineering problem r Need to work with the system configuration you have ¦ Need to understand if approach is applicable to problem ¦ r Not clear if there is a single solution PPAM 2003 Framework for Online Performance Analysis, and Visualization 29

Future Work r Build online support in TAU performance system ¦ Extend to support PULL model capabilities Develop hierarchical data access solutions r Performance studies of full system r Latency analysis ¦ Bandwidth analysis ¦ r Integration with other performance tools System performance monitors ¦ Para. Prof parallel profile analyzer ¦ r Development of 3 D visualization library ¦ PPAM 2003 Portability focus Framework for Online Performance Analysis, and Visualization 30