A Framework for Linking the NWS National Water

 estimation in reservoir operation")


 Runoff (Inches) Precipitation (Inches) Wet year (1991) Runoff (Inches) Precipitation (Inches)")
 Simulates rainfall- runoff response in the watershed P")


 Wet year (1991) SOIL in 0 -4 -inch layer")
 Wet year (1991) SOIL 4 -16 -inch layer (Inches)")
 Water in soil 0 -40 inches 5. 2+2. 5+0. 6 =")


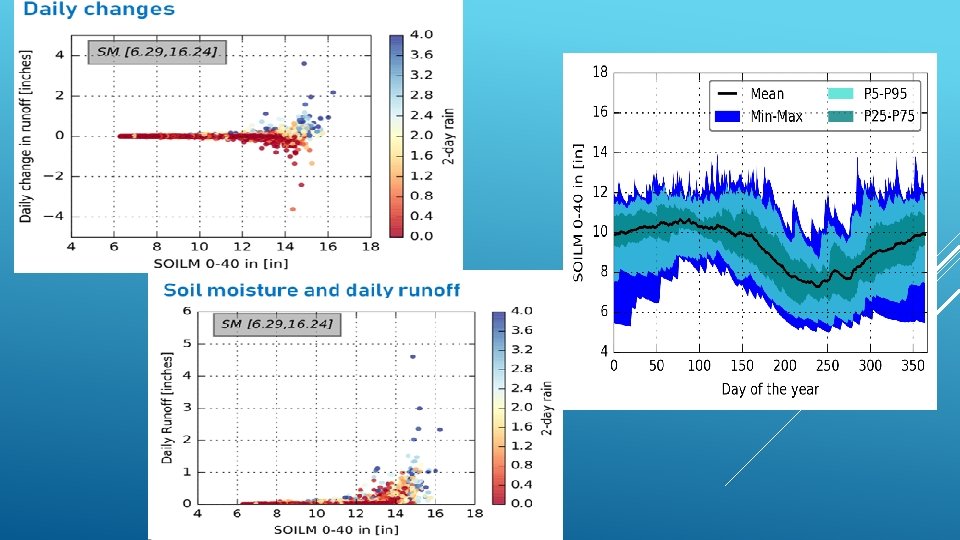
 CL t QF = precipitation = initial loss as a")


- Slides: 20
A Framework for Linking the NWS National Water Model with the HEC-HMS to Improve Flood Modeling Luciana Cunha, David Curtis and Pavithra Prakash WEST Consultants, Folsom, CA CWEMF 2019
PURPOSE : To improve stream inflow (runoff) estimation in reservoir operation
Physiographical regions of Texas Gaged basins and Sub-basins in the basin of interest
Location of Dams and their Watershed Boundary
Dry year (2011) Runoff (Inches) Precipitation (Inches) Wet year (1991) Runoff (Inches) Precipitation (Inches) RAINFALL-RUNOFF
HYDROLOGIC MODELING SYSTEM ( HEC- HMS) Simulates rainfall- runoff response in the watershed P – HL = R P = average basin precipitation R = runoff generated in the basin HL = hydrologic losses correspond to sum of losses due to evapotranspiration, infiltration and reserved watershed storage
HYDROLOGIC LOSS RATE ESTIMATION ֍ ֍ ֍ ֍ ֍ Deficit constant Exponential Green Ampt Gridded deficit constant Gridded SCS Gridded SMA Initial Constant SCS curve number Smith Parlange Soil moisture accounting
DEFICIT AND CONSTANT METHOD Initial Loss Soil Moisture Rainfall Continuous Loss Infiltration Percolation Evaporation Initial Continuous
Average soil moisture Precipitation (Inches) Wet year (1991) SOIL in 0 -4 -inch layer (Inches) Dry year (2011) SOIL in 0 -4 -inch layer (Inches) SOIL MOISTURE VARIATION AT SOIL DEPTH LAYER ( 0 – 4 INCHES)
Average soil moisture Precipitation (Inches) Wet year (1991) SOIL 4 -16 -inch layer (Inches) Dry year (2011) SOIL 4 -16 -inch layer (Inches) SOIL MOISTURE VARIATION AT SOIL DEPTH LAYER ( 4 – 16 INCHES)
Wet year (1991) Water in soil 0 -40 inches 5. 2+2. 5+0. 6 = 8. 3 inches Average soil moisture Precipitation (Inches) Water in soil 0 -40 inches 2. 5+2. 0+0. 7 = 5. 2 inches SOIL 16 -40 -inch layer (Inches) Dry year (2011) SOIL 16 -40 -inch layer (Inches) SOIL MOISTURE VARIATION AT SOIL DEPTH LAYER ( 16 – 40 INCHES)
BRIDGING DATA GAP No adequate data available on spatial distribution of Soil Moisture content NLDAS-2 National Water Model(NWS) HEC - HMS Spatial soil moisture measurements NLADS-2 : North American Land Data Assimilation System
NLDAS-2 SOIL MOISTURE FOR 0 -80 INCHES SOIL LAYER
Total Loss P IL(MS) CL t QF = precipitation = initial loss as a function of the moisture state of the watershed = continuous loss as a function of the rainfall event properties (RE) = time for which rainfall is larger than zero = flow resulting from the rainfall event ( streamflow – baseflow)
TOTAL LOSS ESTIMATION Initial Loss : Rain > 0; Runoff = 0 Rain Initial Loss Continuous Loss : Rain > 0; Runoff > 0 LC & LT= f(Rain, Soil Moisture)
DATASETS Basin Original Characteristics Resolution Land Use Type 30 m Hydrologic Soil Group 10 m Available Water Storage 10 m Elevation 100 m Mean Annual Precipitation Slope Runoff Curve Number 4000 m Mean Annual 100 m 30 m Source National Land Cover Database 2011 Gridded Soil Survey Geographic (g. SSURGO) Database National Elevation Dataset (NED) data PRISM Normal Calculated from Elevation Calculated from Land Use Type and Hydrologic Soil Type Resampled from Mean Land Cover Curve Number Mean Rainfall Mean Temp
Mean Total Loss
Summary ֍ Decision support tool being deployed – 24 reservoirs ֍ Automated which is operator friendly ֍ Improved runoff prediction using NLDAS soil moisture data ֍ Can be used with observed and forecast rainfall
Thank You!