A Brief Guide to National Data Systems National

A Brief Guide to National Data Systems

National data systems and how they relate to strategic data use in schools: • Often they don’t, although they may provide a starting point for questioning, that can be confirmed or denied by school evidence. • They provide an indication towards future policy direction. • The figures the national systems generate should not be a surprise to schools that are on top of their own data use. • They can be useful to glean a national or local picture from that can help schools to understand their own position.

Overarching Strategic Aims: • Data should help provide clarity for teaching staff and assist strategic decision making at all levels. • Getting the blend right between systems, culture and practice. • Define clear objectives. • Communicate changes and stick to them. • Present data clearly and concisely. • Allow time for analysis, discussion and strategic thinking.

Main National Data Sources: Recent Past • RAISEonline Present Replaced by • Analyse School Performance • Inspection Dashboard Replaced by • IDSR • Df. E Performance tables Evolved into • Df. E Performance tables (compare school performance) • Statistical first releases remain as • Statistical first releases
: What? School specific information, on attainment, absence characteristics. Has dedicated")
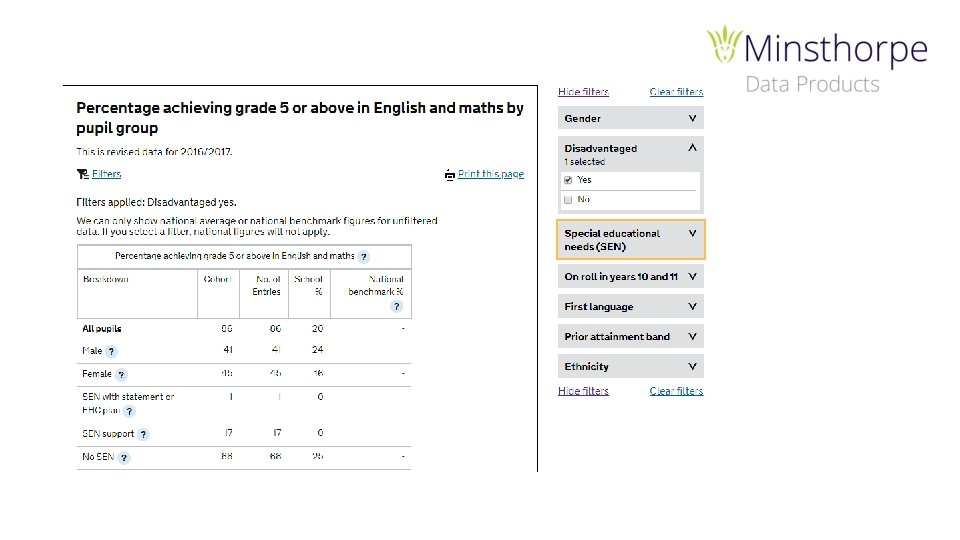
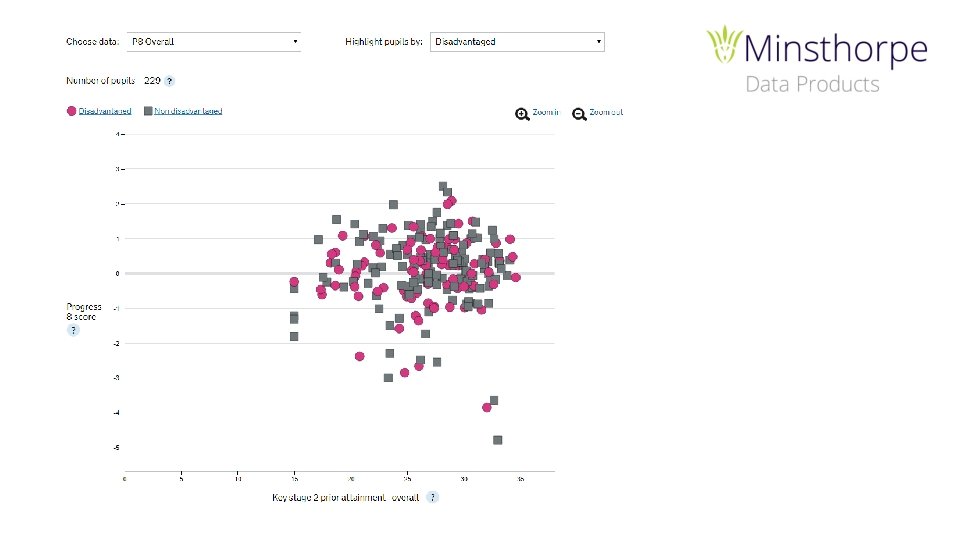
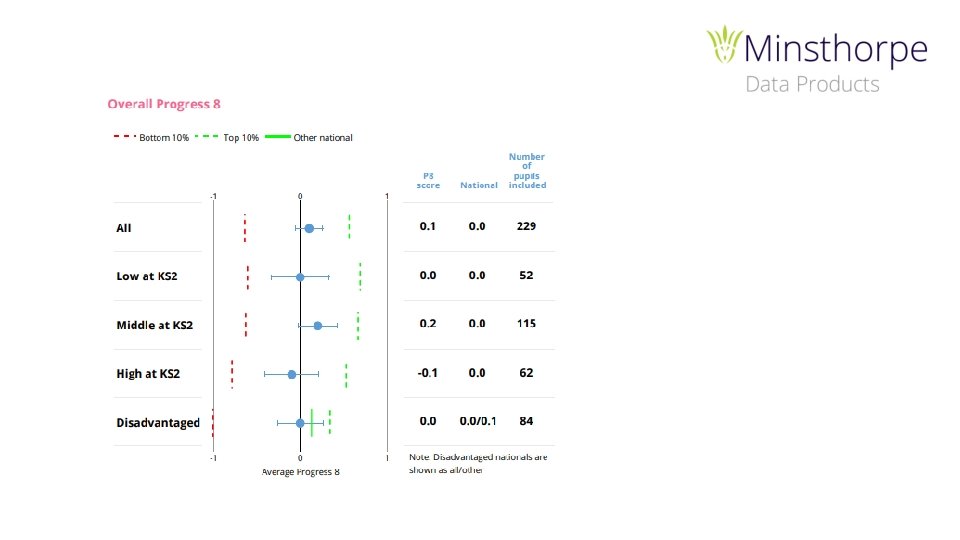
Analyse School Performance (ASP): What? School specific information, on attainment, absence characteristics. Has dedicated disadvantaged section. Where? Via ‘Secure Access’ or analyse-school-performance. service. gov. uk When? Updates periodically through September to March. The majority of information appears in January. Who? The ASP is for school leaders and staff, Ofsted can also access the ASP to support inspection.
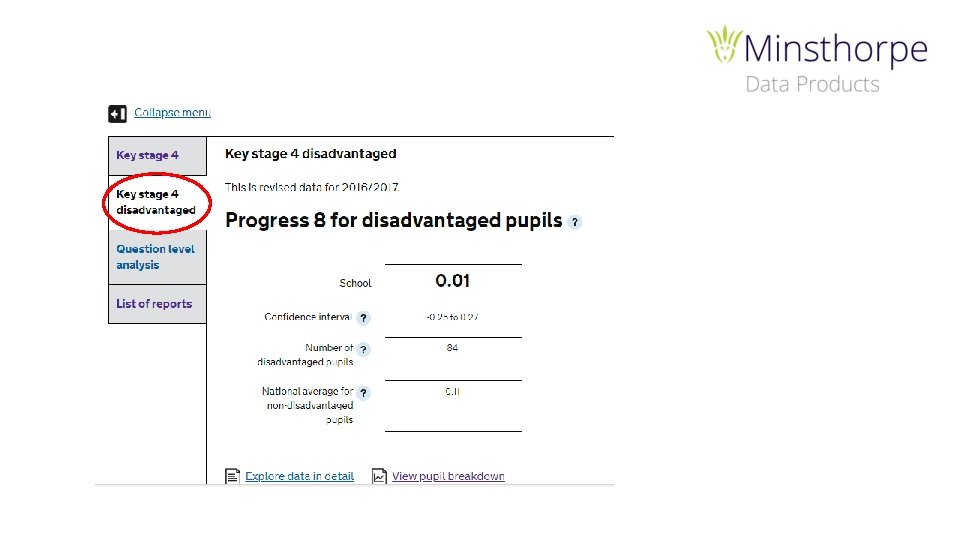


IDSR: What? Ofsted Inspection Data Summary Reports. The first ‘data’ point of call for inspection. Where? Via ‘Secure Access’ or analyse-school-performance. service. gov. uk - Found under ‘List of Reports’ When? November/December Updated January/March Who? School leaders and Ofsted Inspectors.

IDSR gives areas to investigate and often these form Key Lines of Enquiry:

Areas to investigate show notable aspects of the data. They can be positive as well as negative, and may become lines of enquiry during an inspection. They are generated if data meets criteria set out in guidance and in most cases require at least 11 pupils in a group or cohort, but progress trends can be produced for groups of 6 or more pupils. This page also shows floor standards and coasting thresholds with an indication of whether either applies to the school. Floor standards apply to one year; coasting is a rolling 3 year measure (requires 3 red boxes in a row).

IDSR: Page 7 & 8

Compare School Performance: What? Overview statistics on individual schools, that can be viewed individually or in comparison tables. Where? https: //www. compare-school-performance. service. gov. uk/ When? October – Provisional, January – Validated, March/April - Final Who? Public
, has improved the most out of all the")
Compare school performance (the performance tables), has improved the most out of all the national data sources. It can be much more useful than it was previously to either view a single school’s outcomes or to compare across schools.

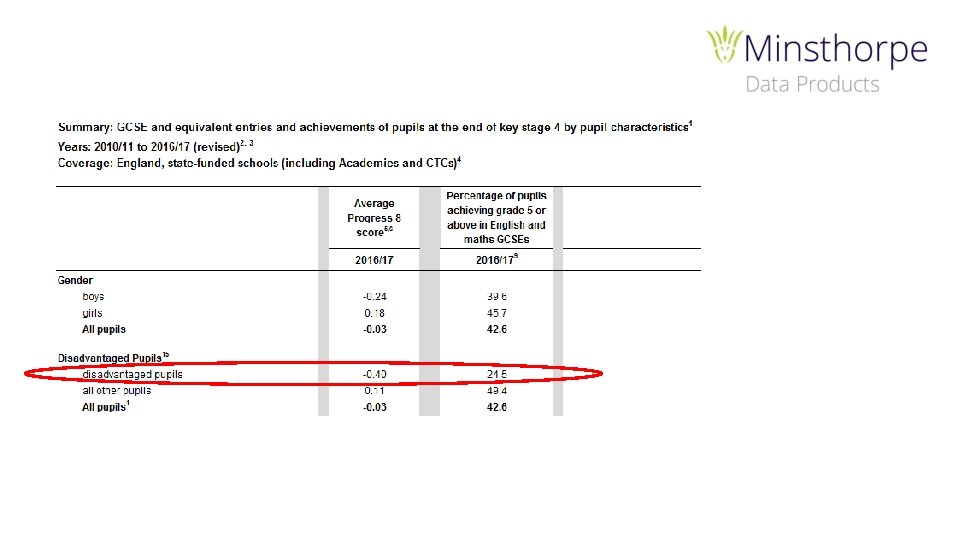
Statistical First Releases: What? Government statistics at national, regional, local authority level. Where? https: //www. gov. uk/government/collections/statistics-gcses-key-stage-4 When? October (Provisional) January (Validated) Who? Public
- Slides: 18