
9302020 Advanced Medicinal Chemistry Lecture 5 Drug Metabolism
9/30/2020 Advanced Medicinal Chemistry Lecture 5: Drug Metabolism and Pharmokinetics - 2 Barrie Martin Astra. Zeneca R&D Charnwood
9/30/2020 Quantitative DMPK involves the measurement of a number of pharmacokinetic parameters which describe the fate of compounds in the body. These can be used to compare compounds, to highlight deficiencies in compounds (e. g. high metabolism) and to predict how the potential drug will behave in man – generate dose predictions.
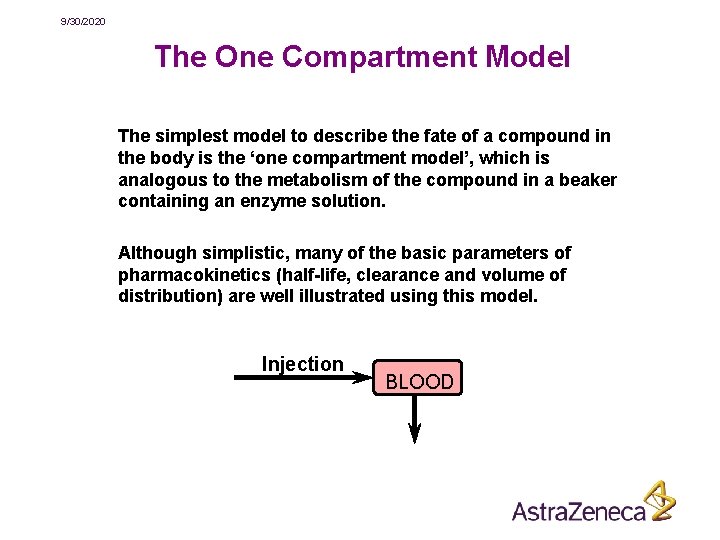
9/30/2020 The One Compartment Model The simplest model to describe the fate of a compound in the body is the ‘one compartment model’, which is analogous to the metabolism of the compound in a beaker containing an enzyme solution. Although simplistic, many of the basic parameters of pharmacokinetics (half-life, clearance and volume of distribution) are well illustrated using this model. Injection BLOOD
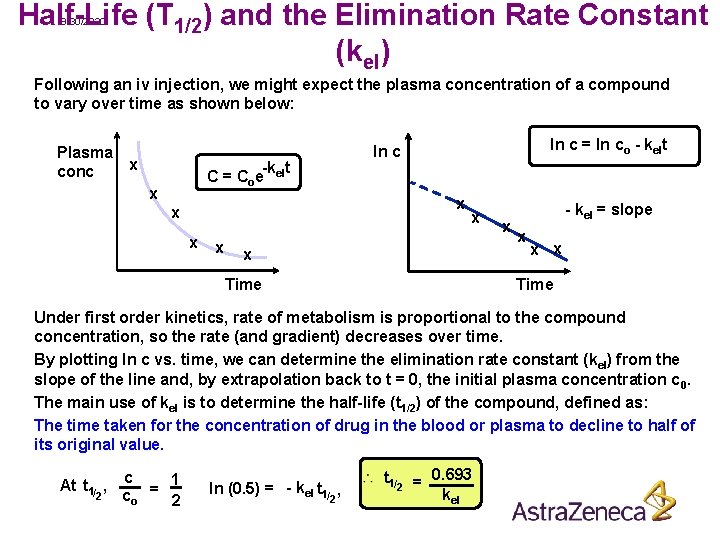
Half-Life (T 1/2) and the Elimination Rate Constant (kel) 9/30/2020 Following an iv injection, we might expect the plasma concentration of a compound to vary over time as shown below: Plasma x conc -k t C = Coe el x ln c = ln co - kelt ln c x x x Time x - kel = slope x x x Time Under first order kinetics, rate of metabolism is proportional to the compound concentration, so the rate (and gradient) decreases over time. By plotting ln c vs. time, we can determine the elimination rate constant (kel) from the slope of the line and, by extrapolation back to t = 0, the initial plasma concentration c 0. The main use of kel is to determine the half-life (t 1/2) of the compound, defined as: The time taken for the concentration of drug in the blood or plasma to decline to half of its original value. At t 1/ , 2 c 1 = co 2 ln (0. 5) = - kel t 1/ , 2 t 1/ 2 = 0. 693 kel
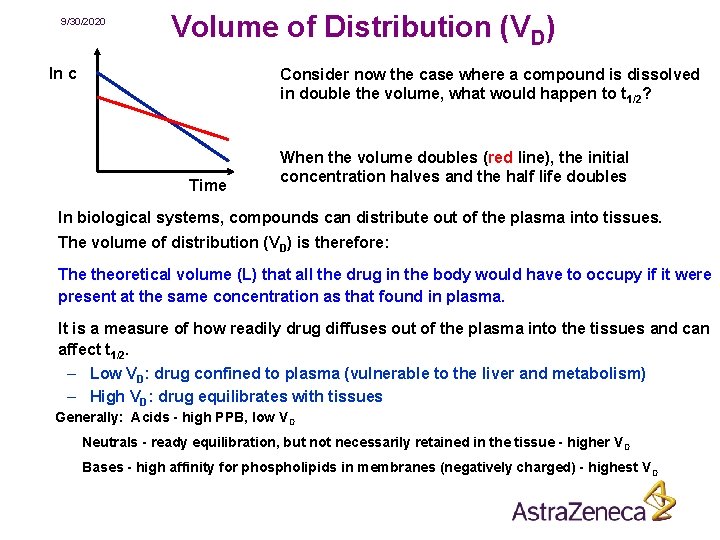
9/30/2020 Volume of Distribution (VD) ln c Consider now the case where a compound is dissolved in double the volume, what would happen to t 1/2? Time When the volume doubles (red line), the initial concentration halves and the half life doubles In biological systems, compounds can distribute out of the plasma into tissues. The volume of distribution (VD) is therefore: The theoretical volume (L) that all the drug in the body would have to occupy if it were present at the same concentration as that found in plasma. It is a measure of how readily drug diffuses out of the plasma into the tissues and can affect t 1/2. – Low VD: drug confined to plasma (vulnerable to the liver and metabolism) – High VD: drug equilibrates with tissues Generally: Acids - high PPB, low VD Neutrals - ready equilibration, but not necessarily retained in the tissue - higher V D Bases - high affinity for phospholipids in membranes (negatively charged) - highest V D

9/30/2020 Clearance (Cl) is a measure of how readily compounds are eliminated (i. e. metabolised or excreted) It is defined as: The volume of plasma (or blood) from which all drug is removed per unit time. (n. b. units of Cl are units of flow ml/min) Cl is a constant, characteristic of a drug in a particular species. It is a scaling factor that relates the plasma concentration of a compound to the rate of elimination ( d. D )Rate of elimination (ng/min) = Clearance x concentration (ng/ml) dt Rate of elimination (ng/min) Clearance (ml/min) = concentration (ng/ml)
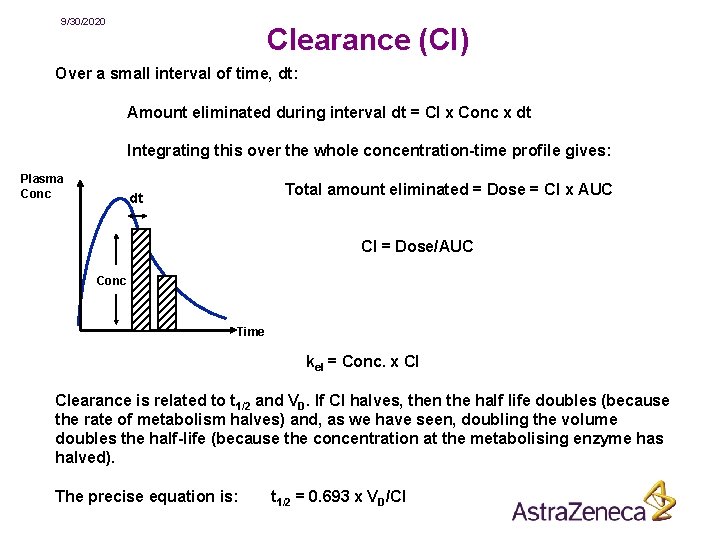
9/30/2020 Clearance (Cl) Over a small interval of time, dt: Amount eliminated during interval dt = Cl x Conc x dt Integrating this over the whole concentration-time profile gives: Plasma Conc Total amount eliminated = Dose = Cl x AUC dt Cl = Dose/AUC Conc Time kel = Conc. x Cl Clearance is related to t 1/2 and VD. If Cl halves, then the half life doubles (because the rate of metabolism halves) and, as we have seen, doubling the volume doubles the half-life (because the concentration at the metabolising enzyme has halved). The precise equation is: t 1/2 = 0. 693 x VD/Cl
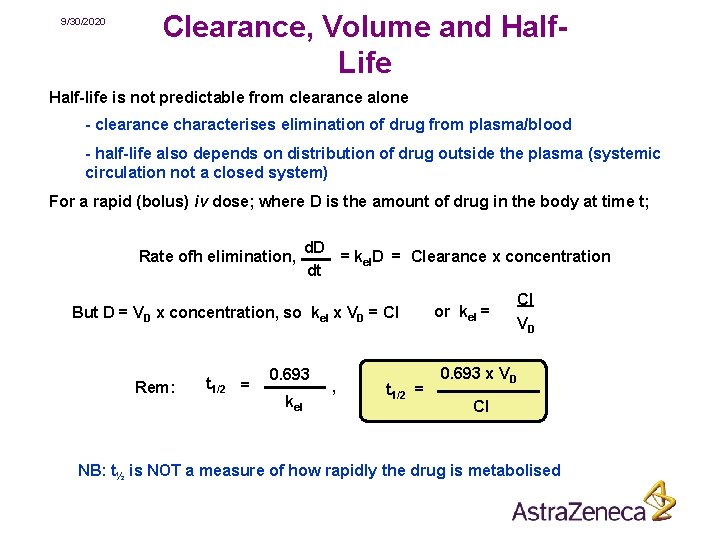
9/30/2020 Clearance, Volume and Half. Life Half-life is not predictable from clearance alone - clearance characterises elimination of drug from plasma/blood - half-life also depends on distribution of drug outside the plasma (systemic circulation not a closed system) For a rapid (bolus) iv dose; where D is the amount of drug in the body at time t; Rate ofh elimination, d. D = kel. D = Clearance x concentration dt But D = VD x concentration, so kel x VD = Cl Rem: t 1/2 = 0. 693 kel , t 1/2 = or kel = Cl VD 0. 693 x VD Cl NB: t½ is NOT a measure of how rapidly the drug is metabolised

9/30/2020 Clearance, Extraction and Absorption For the three main elimination processes, metabolism, renal, and biliary, clearances are additive, i. e. Cl. T = Cl. M + Cl. R + Cl. B e. g. If Cl. T = 20 ml/min/Kg and %dose as parent in urine = 20% Then Cl. R = 4 ml/min/Kg Can relate clearance to liver blood flow (Q): Cl = E x Q (E = extraction ratio) If Cl ~ Q (i. e. E~1), then 1 st pass metabolism is a likely problem. E = (Cin –Cout) / Cin Fraction absorbed (fa) can now be worked out if know %F Q = flow (ml/min) Q: Rat ~ 70 ml/min/kg Dog ~ 40 ml/min/kg Man ~ 20 ml/min/kg Cin = conc. entering liver Cout = conc. leaving liver
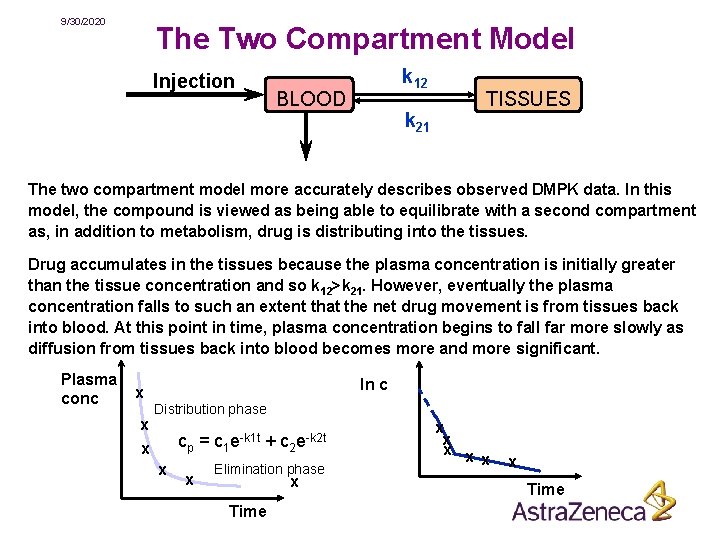
9/30/2020 The Two Compartment Model Injection k 12 BLOOD k 21 TISSUES The two compartment model more accurately describes observed DMPK data. In this model, the compound is viewed as being able to equilibrate with a second compartment as, in addition to metabolism, drug is distributing into the tissues. Drug accumulates in the tissues because the plasma concentration is initially greater than the tissue concentration and so k 12>k 21. However, eventually the plasma concentration falls to such an extent that the net drug movement is from tissues back into blood. At this point in time, plasma concentration begins to fall far more slowly as diffusion from tissues back into blood becomes more and more significant. Plasma conc x x ln c Distribution phase cp = c 1 e-k 1 t + c 2 e-k 2 t x x x Elimination phase x Time x x x Time
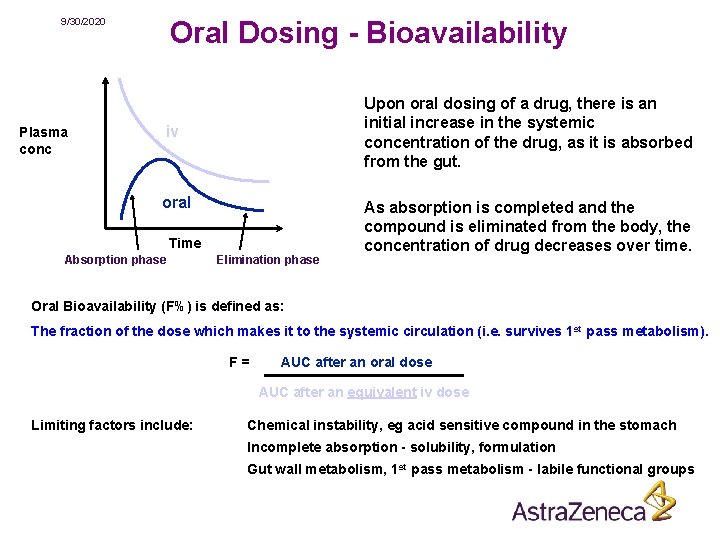
Oral Dosing - Bioavailability 9/30/2020 Plasma conc Upon oral dosing of a drug, there is an initial increase in the systemic concentration of the drug, as it is absorbed from the gut. iv oral Time Absorption phase Elimination phase As absorption is completed and the compound is eliminated from the body, the concentration of drug decreases over time. Oral Bioavailability (F%) is defined as: The fraction of the dose which makes it to the systemic circulation (i. e. survives 1 st pass metabolism). F= AUC after an oral dose AUC after an equivalent iv dose Limiting factors include: Chemical instability, eg acid sensitive compound in the stomach Incomplete absorption - solubility, formulation Gut wall metabolism, 1 st pass metabolism - labile functional groups
9/30/2020 Predicting in vivo DMPK using in vitro Measurements A number of DMPK parameters may be predicted from in vitro assays to build up understanding of compound properties – predict behaviour in man • Absorption – Pampa, Caco-2 • Clearance - Microsomes, Hepatocytes • Distribution - Plasma protein binding, • Cytochrome P 450 inhibition (5 major isozymes) • Physical parameters – log D, p. Ka, solubility These assays are used extensively to profile compounds and filter out those that do not possess the required properties to be drugs.
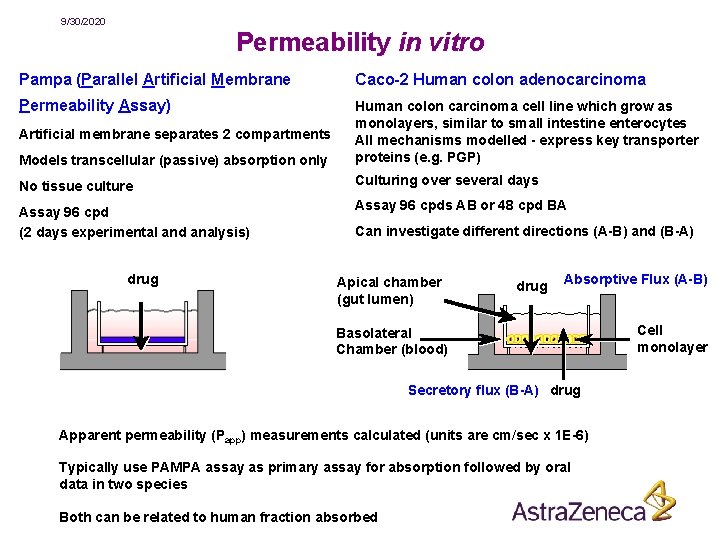
9/30/2020 Permeability in vitro Pampa (Parallel Artificial Membrane Caco-2 Human colon adenocarcinoma Permeability Assay) Models transcellular (passive) absorption only Human colon carcinoma cell line which grow as monolayers, similar to small intestine enterocytes All mechanisms modelled - express key transporter proteins (e. g. PGP) No tissue culture Culturing over several days Assay 96 cpd (2 days experimental and analysis) Assay 96 cpds AB or 48 cpd BA Artificial membrane separates 2 compartments drug Can investigate different directions (A-B) and (B-A) Apical chamber (gut lumen) drug Absorptive Flux (A-B) Basolateral Chamber (blood) Secretory flux (B-A) drug Apparent permeability (Papp) measurements calculated (units are cm/sec x 1 E-6) Typically use PAMPA assay as primary assay for absorption followed by oral data in two species Both can be related to human fraction absorbed Cell monolayer
9/30/2020 In vitro Measurement of Metabolism In vivo Cl can also be predicted using in vitro assays: Microsomes (species – rat, dog, human) A subcellular fraction obtained by centrifugation of liver cells. Mainly composed of vesicles containing CYP 450 enzymes formed from fragmented endoplasmic reticulum. Perform Phase I reactions. Hepatocytes (species – rat, dog, human) Isolated whole liver cells. Capable of performing both Phase I and II reactions. Rates of metabolism are reported as intrinsic clearance - Clint (ul/min/106 cells) Typically: Rat Hepatocytes Clint Low (< 10), Moderate (10 -20), High (> 20) Human Microsomes Clint Low (< 15), Moderate (15 -30), High (> 30)
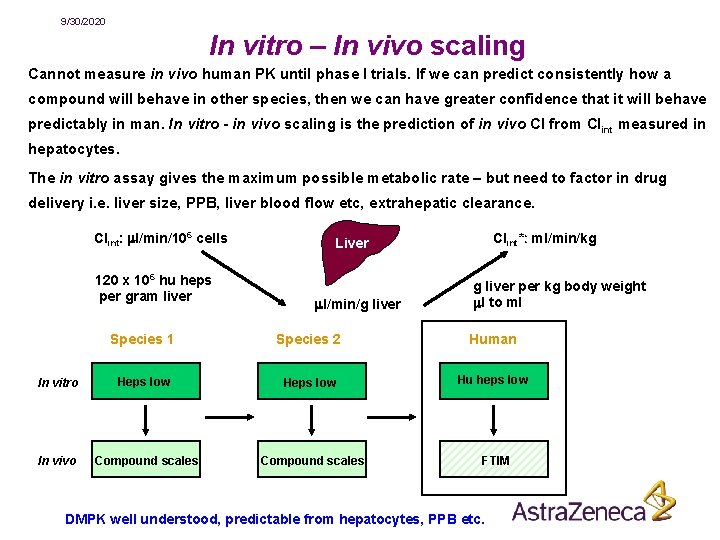
9/30/2020 In vitro – In vivo scaling Cannot measure in vivo human PK until phase I trials. If we can predict consistently how a compound will behave in other species, then we can have greater confidence that it will behave predictably in man. In vitro - in vivo scaling is the prediction of in vivo Cl from Clint measured in hepatocytes. The in vitro assay gives the maximum possible metabolic rate – but need to factor in drug delivery i. e. liver size, PPB, liver blood flow etc, extrahepatic clearance. Clint: ml/min/106 cells 120 x 106 hu heps per gram liver Clint*: ml/min/kg Liver ml/min/g liver per kg body weight ml to ml Species 1 Species 2 Human In vitro Heps low Hu heps low In vivo Compound scales FTIM DMPK well understood, predictable from hepatocytes, PPB etc.

9/30/2020 Dose Prediction to Man DMPK measurements enable prediction of human PK parameters. Incorporation of potency and safety data enables Dose to Man (Dt. M) and safety margin predictions. Predicted human PK appropriate for once a day oral dosing: Therapeutic Dose Pred. Human DMPK Plasma conc < 5 mg/kg uid t 1/2 6 -12 h, F > 30% Toxic Plasma conc Therapeutic Safety Margin Cssmax Cssmin (typically 3 x potency) Time Ineffective Time
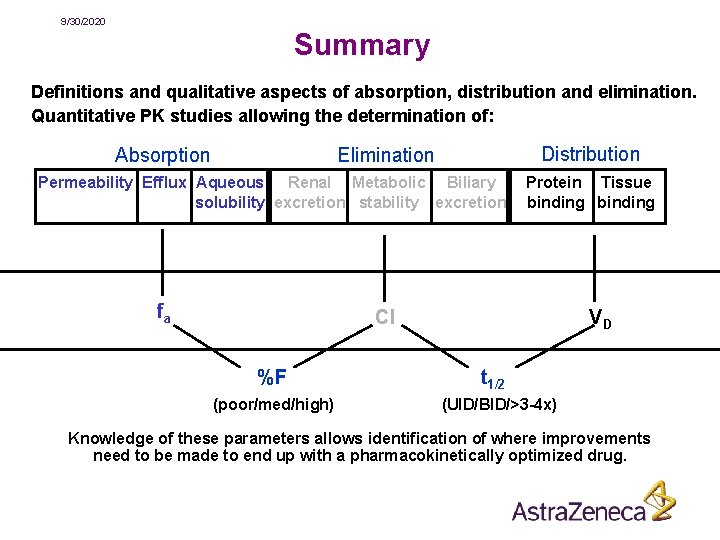
9/30/2020 Summary Definitions and qualitative aspects of absorption, distribution and elimination. Quantitative PK studies allowing the determination of: Absorption Distribution Elimination Permeability Efflux Aqueous Renal Metabolic Biliary solubility excretion stability excretion fa Protein Tissue binding Cl %F (poor/med/high) VD t 1/2 (UID/BID/>3 -4 x) Knowledge of these parameters allows identification of where improvements need to be made to end up with a pharmacokinetically optimized drug.
- Slides: 17