8 th Grade Honors Science Chapter 1 Describing

8 th Grade Honors Science Chapter 1 Describing Motion Ms. Bormann Kawameeh Middle School

Physics Introduction The motion of objects can be described by words. Even a person without a background in physics has a collection of words that can be used to describe moving objects. Words and phrases such as going fast, stopped, slowing down, speeding up, and turning provide a sufficient vocabulary for describing the motion of objects. In physics, we use these words and many more. We will be expanding upon this vocabulary list with words such as (but not limited to) distance, displacement, speed, velocity, and acceleration.
 and")
Some Physics Quantities Vector - quantity with both magnitude (size or numerical value) and direction Scalar - quantity with magnitude (size or numerical value) only Vectors: • Displacement Scalars: • Distance • Velocity • Acceleration • Momentum • Force • Speed • Time • Mass • Energy

Vectors l l Often represented by arrows. Length of the arrow represents the magnitude (how far, how fast, how strong, etc. depending on the type of vector)

Do you know the difference? Quantity 5 m 30 m/sec, East 5 mi. , North 20 degrees Celsius 256 bytes 4000 Calories Category Scalar Vector Scalar

Kinematics The study of motion of an object without regard to the causes of the motion.

Reference Frame l 1 minute!!! Discuss with the person next to you: Is the speed of the ball different relative to the pitcher, the truck driver, and the jet pilot? Why or why not?

Chapter 1: Lesson 1

Reference Point and Position l To locate an object we need a reference point l l We also then need to consider where the object is relative to the origin – the position of the object. l l Reference Point – the origin – the starting point you choose to describe the position of an object. Position (x) – where you are located A complete description of position includes: • Distance • Direction • Reference Point

Position l The object’s position is its location with respect to a chosen reference point. l l Consider the point to be the origin of a coordinate system. In the diagram, allow the road sign to be the reference point.
 – how far an object travels. l Does not depend")
Distance l Distance (d) – how far an object travels. l Does not depend on direction. l Scalar or vector quantity? Scalar l 0 cm l Imagine an ant crawling along a ruler. 1 2 3 4 5 6 7 8 What distance did the ant travel? d = 3 cm 9 10

Distance does not depend on direction. l Here’s our intrepid ant explorer again. l 0 cm l 1 3 4 5 6 7 8 9 Now what distance did the ant travel? ld l 2 = 3 cm Does his direction change the answer? 10

Distance l l 0 cm l l Distance does not depend on direction. Let’s follow the ant again. 1 2 3 4 5 6 7 8 9 What distance did the ant walk this time? d = 7 cm 10
 – where you are in relation to where you")
Displacement l Displacement ( x) – where you are in relation to where you started. l l l Does depend on direction. Vector Quantity Displacement = final position – initial position Examples of directions: l l l + and – N, S, E, W Angles

Displacement l Let’s revisit our ant, and this time we’ll find his displacement. - + 0 cm 1 2 3 4 5 6 7 8 Distance: 3 cm l Displacement: +3 cm l l The positive gives the ant a direction! 9 10

Displacement l Find the ant’s displacement again. l Remember, displacement has direction! - + 0 cm 1 2 3 4 5 Distance: 3 cm l Displacement: -3 cm l 6 7 8 9 10

Displacement l Find the distance and displacement of the ant. - + 0 cm 1 2 3 4 5 Distance: 7 cm l Displacement: +3 cm l 6 7 8 9 10

Displacement vs. Distance l Example of distance: l The l Example of displacement: l The l ant walked 3 cm EAST. An object’s distance traveled and its displacement aren’t always the same!

Distance vs. Displacement l l You drive the path, and your odometer goes up by 8 miles (your distance). Your displacement is the shorter directed distance from start to stop (green arrow). start stop

Motion in Dimensions l 1 dimension l Distance/length is measured in ONE direction (left to right OR north to south) l 2 dimension l Distance/length is measured in TWO dimensions (north and east OR south and west)

Practice Problem 1 l An athlete runs around a track that is 100 meters long three times, then stops. l What is the athlete’s distance and displacement? l l l Distance = 300 m Displacement = 0 m Why?
 a distance")
Practice Problem 2 l A whale swims due east (from 0 km) a distance of 5 km, turns around and goes due west for 2 km and finally turns around again and heads 4 km due east. l What is the total distance traveled? l What is the displacement?

Practice Problem 3 Motion An object moves from point 1 to point 4 then reverses and ends at point 2 An object moves from point 1 to point 5 then reverses to point 2 An object moves from point 1 to point 3 then reverses to 0 An object moves from point 3 to point 5 and then reverses to point 1 An object moves from point 2 to point 4 and reverses to point 2 Distance Traveled Displacement X

Practice Problem 4 l Janice drives her scooter 7 kilometres north. She stops for lunch and then drives 5 kilometres east. What distance did she cover? What was her displacement?

Practice Problem 5 l David walks 3 km north, then turns and walks 4 km east. Express your answer in kilometers

Practice Problem 5 Answer Key

Chapter 1: Lesson 2

Rates A rate measures how fast something changes. l In physics, a rate is almost always calculated as a quantity divided by time. l Speed, Velocity and Acceleration l
 – Rate at which an object moves l speed = distance /")
Speed (s) – Rate at which an object moves l speed = distance / time l s = d/t l Units: m/s OR km/h l Like distance, speed does not depend on direction. l l Scalar or Vector? Scalar

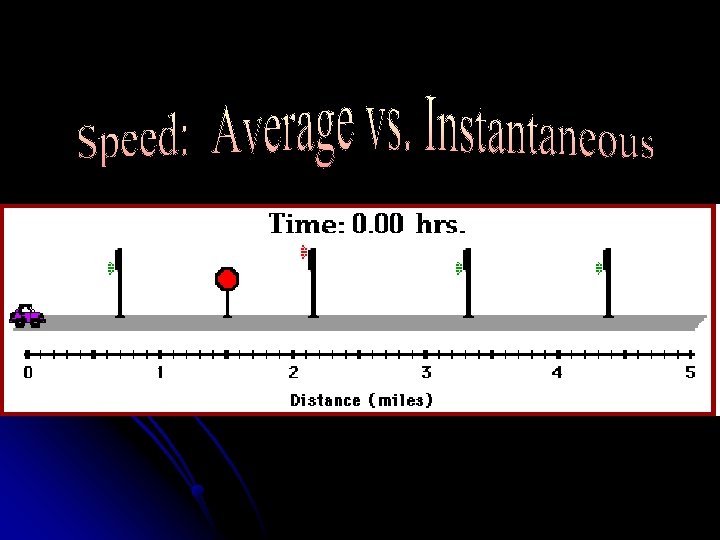
Types of Speed l Constant speed - Speed that does not change (same distance is travelled the same amount of time) l Instantaneous speed – Speed at a given instant in time (what the speedometer says)

When completing a formula you MUST show all your work! Step 1 – write formula l Step 2 – plug in the information you are given l Step 3 – solve l Step 4 – add your units (and direction if needed) l

Practice l A car drives 100 meters in 5 seconds. 1 s 2 3 4 5 100 m l. What ls is the car’s speed? = d/t l s = (100 m) / (5 s) = 20 m/s

Practice l A hydroplane boat, made speed records by traveling 239 miles in 0. 75 hours (45 minutes). What is it’s record breaking speed? d/t 239 miles/ 0. 75 hr

Average Speed l Average speed - Total distance traveled divided by total time traveled.

Practice Problem: Average Speed l Melissa shot a model rocket 360 m into the air. It took the rocket 4 s to fly that far. What was the average speed of the rocket?

Practice Problem: Average Speed l If Jessica ran 5 meters the first second, eight meters the next second, and 8 meters the third second to her house. What was her average speed?

Can I determine time given distance and speed? How? l A rocket is traveling at 10 km/s. How long does it take the rocket to travel 30 km?

Can I determine distance given time and speed? How? l A racecar is traveling at 85. 0 m/s. How far does the car travel in 30. 0 s?

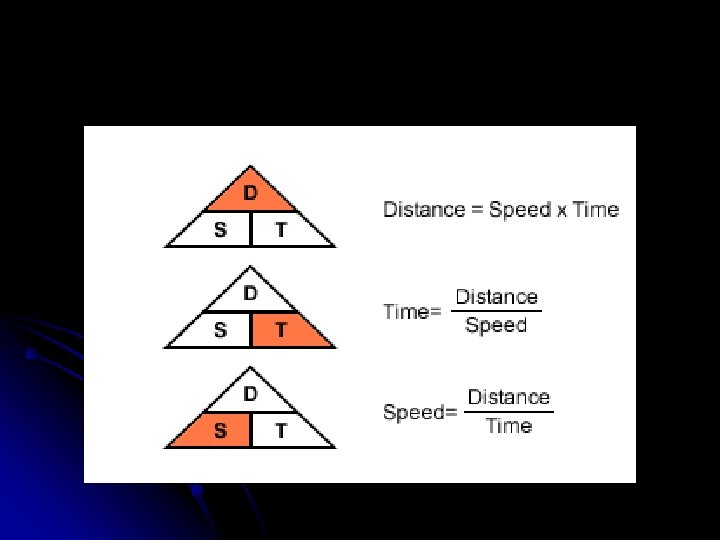
Calculating Speed, Distance or Time l If you know any two of the variables, you can calculate the missing variable.

Is their speed the same? Is their velocity the same?
 – measure of speed in a given direction. l velocity = x")
Velocity (v) – measure of speed in a given direction. l velocity = x / time, w/ direction l Scalar or Vector? Vector l The velocity of an object can change if: l • It speeds up • It slows down • It changes direction

Velocity Practice l What is the velocity of a car that traveled a total of 75 kilometers in 1. 5 hours from Florida to New Jersey?

Speed Vs Velocity An object is moving in a circle at a constant speed of 10 m s-1. We say that it has a constant speed but its velocity is changing. Why? Direction of Motion The direction of the object keeps changing.

Average Velocity l l Displacement in a given amount of time. Average Velocity = total displacement total time

Average Velocity Practice l A man walks 7 km in 2 hours West and 2 km in 1 hour back toward the East. l What is the man’s average velocity? l What is the man’s average speed?

Average Speed and Velocity Practice l A teacher walks back and forth in front of the room during a lesson. She starts at one end of the desk and walks from the door to the windows, a distance of 4. 0 m in 5 s. She then stops, turn around and walks 2. 0 m back toward the door in 3 s. She stops here for 10 s and then walks 3 meters toward the door in 6 s. l What is the average speed of the teacher? l What was the average velocity of the teacher?

Average Velocity Practice l You drive your truck south for 5. 2 miles in 10 minutes, at which point you run out of fuel. You walk 1. 2 miles further to the nearest gas station in 30 minutes. What is your average velocity?

Pulling It All Together l Back to our ant explorer! - + 1 s 2 3 4 5 0 cm 1 2 l Distance 3 4 5 6 7 8 9 10 traveled: 7 cm l Displacement: +3 cm l Average speed: (7 cm) / (5 s) = 1. 4 cm/s l Average velocity: (+3 cm) / (5 s) = +0. 6 cm/s

Distance vs. Time Graph Important Graphing Information 1. Draw your axes 2. Label your axes 3. Choose your intervals 4. Choose appropriate spacing between intervals. 5. Plot your data 6. Draw a line best fit 7. Give your graph a title

Graphs show relationships l A good way to show a relationship between two variables is to use a graph. A graph makes it easy to see if changes in one variable cause changes in the other variable (the effect). Distance l

The distance vs. time graph Distance l l To graph data, you put time on the horizontal (x) axis – this is your independent variable. Distance goes on the vertical (y) axis – this is your dependent variable.

The distance vs. time graph l l Distance vs. time data tells you the runner’s position at different points in time. The runner is at 50 meters after 10 sec. , 100 meters after 20 sec. and 150 meters at 30 sec. Distance

A straight, diagonal line indicates… l Constant Speed Why is the line in a constant speed graph straight and diagonal? • The object is traveling the same distance in the same amount of time.

An Object At Rest Object’s AT REST are not moving l A horizontal line on a Distance vs. Time graph has NO SLOPE = 0 speed l

object is not moving, constant speed negative velocity (reversing or moving in the opposite direction. )

A curved line indicates… • Changing Speed

Distance-Time Graph and Changing Speed What do the different lines indicate when an object is changing speed? Downward Curve l Slowing down Horizontal Line • Stopping Upward Curve • Speeding Up

Comparing Slopes Fast, steady speed Constant speed Increase speed stationary Change direction at a constant rate

Terry, Jade and Jerome Raced. Plot their data on a distance vs. time graph

How to determine total average speed by looking at a line graph Find total distance (ending distance) 2. Divide by total time (ending time) 1. t t

Comparing speeds on a Distance – Time Graph 1. Find the average speed of each line. 2. Compare the steepness of each line. The steeper slope indicates: Faster Speeds

Distance vs. Time Graphs l Which graph shows the faster moving object?

What does the slope tell you on a distance vs. time graph? l Rise = Distance (y axis) l Run = Time (x axis) l Rise/Run = Speed or velocity
 /")
Graphing Speed Distance vs. Time Graph l Slope: Rise/Run (y 2 -y 1) / (x 2 -x 1)

Graphing Speed Distance vs. Time Graph Slope

Graphing Speed Distance vs. Time Graph Slope

Practicing with Slope

Practicing with Slope

Practicing with Slope We can now quantify the results because we have gridlines, numbers and aces. l Calculate the slope from A to B l Slope = rise/run l

Practicing with Slope l Calculate slope from B to C

Practicing with Slope l Calculate slope from C to D Practice problem is from http: //www. oswego. edu/~dristle/Motion_Graphs. pdf

Chapter 1: Lesson 3

Acceleration l Acceleration – the rate at which velocity changes l Can be an: l Increase in speed l Decrease in speed l Change in direction

Types of acceleration l Increasing speed l Example: l Decreasing speed l Example: l Car speeds up at green light screeeeech Car slows down at stop light Changing Direction l Example: speed) Car takes turn (can be at constant

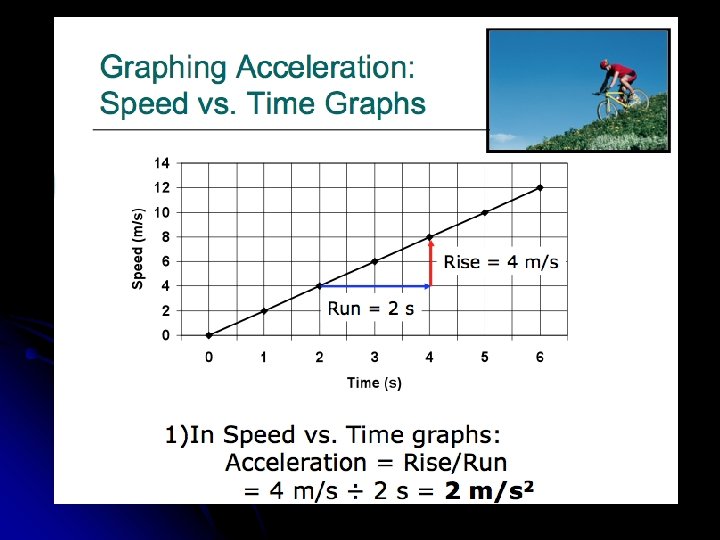
Calculating Acceleration ¡ Units of acceleration: l m/s 2

A bicyclist started from rest along a straight path. After 5 s, his speed was 8 m/s. What was his acceleration during the time?

Can we find time? l A car accelerates at a rate of 3. 0 m/s 2. If its original speed is 8. 0 m/s, how many seconds will it take the car to reach a final speed of 25. 0 m/s?

Can we find Final Velocity? l A motorcycle traveling at 25 m/s accelerates at a rate of 7. 0 m/s 2 for 6. 0 seconds What is the final speed of the motorcycle?


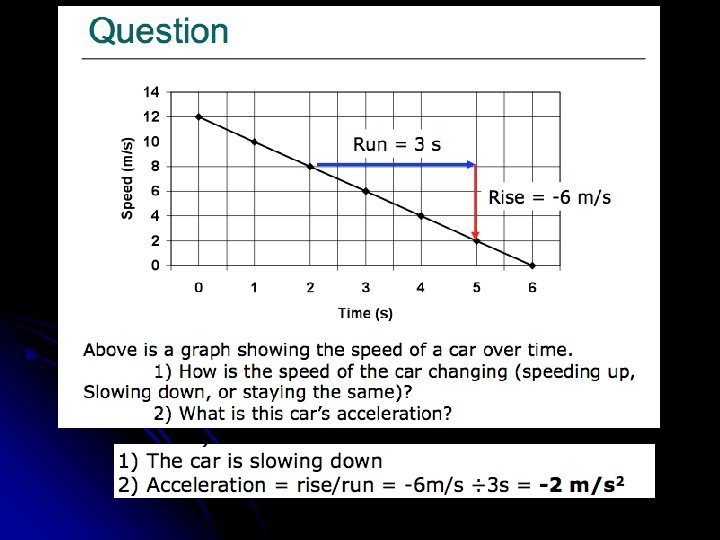
Graphing Acceleration Speed – Time Graphs l Shows how SPEED time l X axis = TIME l Y axis = SPEED changes over

Object at Rest • The speed is zero and does not change • Horizontal line (like a distance – time graph y = 0 )

Constant Speed • The line will be HORIZONTAL • The further the line is from the X - AXIS the FASTER SPEED It is moving.

Speeding Up • The line on a speed – time graph is CLOSER to the x-axis in the BEGINNING of the time period when it has a LOWER speed. • The line slants UPWARD toward the right side of the graph as the speed INCREASES.

Slowing Down • When initially starting to slow down the point representing speed is FAR from the x-axis. • As speed DECREASES the points representing speed get CLOSER to the x-axis. • The line on a speed-time graph slopes DOWNWARD to the right. • When the line touches the x-axis, the speed is ZERO and the object stopped.


Comparing Distance – Time and Speed – Time Graphs Objects at Rest

Comparing Distance – Time and Speed – Time Graphs Constant Speed

Comparing Distance – Time and Speed – Time Graphs Speeding Up

Comparing Distance – Time and Speed – Time Graphs Slowing Down
- Slides: 94