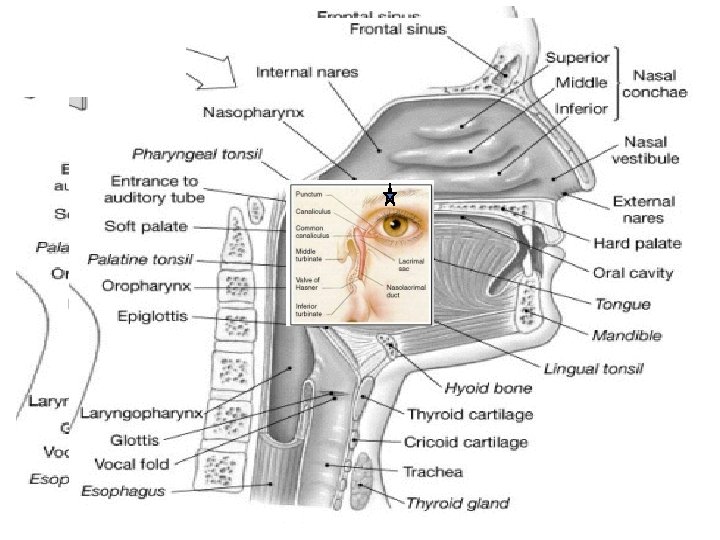
8 Seasonal Respiratory Infections The Common Cold Influenza


 Adults, million visits • cough 22. 4")
 Children, Visits per Year 1. 2. 3.")


 April–November (red) year-round (yellow)")

 Can reproduce only between 33")
 temperature")


 Antihistamines Adrenergic")


")


 27+ million? >50% of")


- Slides: 57
8. Seasonal Respiratory Infections The Common Cold Influenza Alan F. Rothfeld, M. D.
Questions • Why are respiratory infections seasonal? • Why can’t we cure the common cold? • Should I get a flu shot?
Reasons for Physician Visits (U. S. ) Adults, million visits • cough 22. 4 • sore throat 17. 5 • skin rash 13. 5 • vision 13. 0 • knee 12. 5 • back 12. 5 • stomach 12. 3 • earache 11. 3 • hypertension 10. 4 (most common disease 35 m) • depression 10. 0
Reasons for Physician Visits (U. S. ) Children, Visits per Year 1. 2. 3. 4. 5. 6. 7. 8. 9. Colds 5 -10 times per year Coughs 4 -5 times per year Croup 1 -2 times per year Sore throat 4 -5 times per year, mostly with colds, occasionally with Strep Eyes with pus or drainage 1 -2 times per year Earache 1 -2 times per year Diarrhea 3 -4 times per year Vomiting 1 -2 times per year Wheezing: 50% of infants experience wheezing during a viral respiratory infection (called bronchiolitis). Of these, 1/3 wheeze once, 1/3 have 1 or 2 recurrences, and 1/3 go on to develop asthma. 10. Fever 5 -10 times per year with the above symptoms/infections; 1 -2 times per year without any other symptoms
“We can put a man on the moon, but we have no idea how to treat the common cold…” Why? -G. Mc. Govern
Why Are Respiratory Infections Seasonal?
Colds and Temperature
Seasonal risk areas for influenza November–April (blue) April–November (red) year-round (yellow)
Causes of Upper Respiratory Infections Etiology Types % Rhinovirus 120+ 30 hand to eye Coronavirus 5+ 13 aerosol Syncytial 1 Parainfluenza 4 Adenovirus 33 Enterovirus 60+ Reovirus 3 13 other viruses 35 bacteria 7 Influenza 3 2(0 -90%) aerosol
Rhinovirus 16 as resolved with x-ray crystallography (color-coded proteins) Can reproduce only between 33 -34°C Single stranded RNA
The Respiratory Virus Cycle viral factors Acquisition viral factors host factors invasiveness (“energy”) temperature tolerance built in limits source responsiveness activity host defenses genetic novelty climate/weather social factors population density mixing animal husbandry contact customs Disease prior exposure (antibodies) day length, sunlight sleep drugs
Colds, Temperature, and Contact
Vertebrates as Viral Chauffeurs • Over 100 distinct types of virus cause colds • Cold viruses disappear soon after the onset of symptoms • Cold viruses do not invade • Induced Symptoms are designed to spread the virus • Convenient attachment locale • The disease is the defense • Carefully modulated severity
Cures for the Common Cold 1. Kill the virus • Rhinoviruses cannot survive at >37 o. C • Steam inhalation • Zinc kills effectively • Jackson, Arch Int Med 1997; 157: 2373 • Interferon and • Farr, Antimicrob Agents Chemother 1984; 26: 31 • Sperber, J Infect Dis 1989; 160: 700 • Ribavirin • Dolovich, Chest 1992; 102: 284 • Dichloroflavan • Phillpotts, Arch Virol 1983; 75: 115 • Pirodavir • Hayden, Antimicrob Agents Chemother 1995; 39: 290 2. Prevent adhesion • ICAM-1 • Huguenel, Am J Resp Crit Care Med 1997; 155: 1206
3. Prevent the response • • • Steroids NSAIDs Anticholinergics (nasal Atrovent) Antihistamines Adrenergic agents (phenylepinepherine, Afrin) Expectorants, suppressants • Nausea and narcosis 4. Prevent spread • Nasal iodine • Wash hands compulsively • No handshaking
5. Magic • The chicken soup legacy • Chicken Soup Inhibits Neutrophil Chemotaxis In Vitro. Rennard, Chest 2000; 118: 1150 • Saketkhoo K, Effects of drinking hot water, cold water and chicken soup on nasal mucus velocity and nasal airflow resistance. Chest 1978; 74: 408 • Vitamin C • The Nobel Cult of Linus Pauling • Ginsana G • Antibiotics • ~25% of all antibiotic prescriptions • Echinacea
Drugs and Respiratory Illnesses DEFENSE ACTION SUPPRESSION EFFECT fever viral kill antipyretics virulence cilia clear bacteria cough narcotics impaired bacterial antihistamines and irritant sedatives clearance airway narcotics pneumonia clearance mucus block antihistamines prolonged disease penetration, decongestants antibodies bacteria kill pathogens inappropriate bacterial antibiotics pneumonia
So Why Can’t We Cure the Common Cold? • Killing the virus is not feasible • Complexity through simplicity • Very poor antigenicity • Hit and Run • Viruses are largely gone when symptoms become prominent • Symptoms are the response, not the infection • Prevention of Spread theoretically possible • drug therapy likely limited to symptomatic • Walking the tightrope
Where Should I Invest Money for the Common Cold? • Cures for the Common Cold • 120 -valent inhaled vaccine? • A Common rhinovirus protein antibody? • Change the irritant receptor biology? • Invest in antiviral environmental surfaces? • Sell PR to the government • Make handwashing easy and socially desirable • Fashion • Cool wash stations? • Advertising • Obsoleting the handshake?
Influenza
The Influenza A Virus hemaglutinin Rhinovirus 16
Influenza vs Cold Symptoms Signs & Symptoms Onset Fever Cough Headache Myalgia (aches and pains) Fatigue; weakness Extreme exhaustion Chest discomfort Stuffy nose Sneezing Sore throat Influenza Sudden Characteristic, high (over 101 F); lasting 3 to 4 days Nonproductive; can become severe Prominent Usual; often severe Can last up to 2 to 3 weeks Early and prominent Common moderate Sometimes Adapted from the National Institute of Allergy and Infectious Diseases. Cold Gradual Rare Hacking Rare Slight Very mild Never Mild Common Usual Common
Per 10, 000 Pneumonia and Influenza Mortality Rates by Age <5 5 -9 10 -14 15 -19 20 -24 25 -34 35 -44 45 -54 55 -64 65 Age (yr) Glezen WP. Epidemiol Rev. 1996; 18: 73
Secondary Complications of Influenza Southwestern US Health Plan Study Complications/1, 000 Events 30 Synergy Health Care, Inc. data 27 22 18 9
Influenza Surface Proteins Neuraminidase Hemagglutinin RNA M 2 protein (only on type A)
Clinically Relevant Influenza Viruses Type A Type B Type C Potentially severe illness Epidemics and pandemics Rapidly changing Usually less severe illness Epidemics More uniform Usually mild or asymptomatic illness Minimal public health impact Centers for Disease Control and Prevention. Influenza Prevention and Control. Influenza. Available at: http: //www. cdc. gov/ncidod/diseases/fluinfo. htm.
A Constantly Mutating Virus Type B Type A H 1 N 1 H 2 N 2 H 3 N 2 H 5 N 1
Antigenic Shift
Natural History of Influenza Viruses Serum antibody prevalence B Virus isolation H 3 N 8 H 3 N 2 H 2 N? H 1 N 1 1880 1890 1900 1910 1920 1930 1940 1950 1960 1970 1980 1990 2000 Topley and Wilson’s Microbiology and Microbial Infections. 9 th ed, Vol 1, Virology. Mahy and Collier, eds, 1998 Arnold, page 387, with permission.
Incidence of clinically manifest influenza Mean level of population antibody vs A Hx. Nx Mean level of population antibody vs A Hy. Ny Pandemic Disease Incidence Interpandemic Period Epidemic 1 Introduction of hypothetical A Hx. Nx virus Pandemic 2 3 4 5 6 7 8 Time in Years 9 Significant minor variation A Hx. Nx may occur at any of these points. Epidemics may or may not be associated with such variations 10 11 12 Mean Population Antibody Level Occurrence of Influenza Pandemics and Epidemics Introduction of hypothetical A Hy. Ny major (new subtype) variant A Hx. Nx disappears Mandell, Douglas and Bennett’s Principles and Practice of Infectious Diseases, 5 th ed. 2000: 1829. Modified from Kilbourne ED. Influenza. 1987: 274
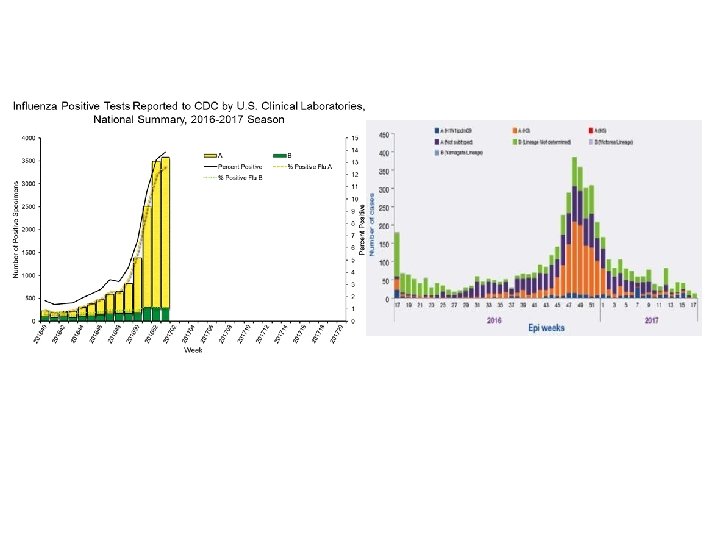
Confirmed Influenza Isolates: Type A vs Type B
Traditional Therapy for Influenza therapy possible effect antipyretics increased severity and duration Plaisance, Pharmacotherapy, 2000; 20: 1417 antitussives sedatives decreased mucociliary action and decreasd cough (secretion retention, mucus plugging, pneumonia, atelectasis) antihistamines decongestants thickened secretions impaired mucus defense layer antibiotics impaired bacterial defense layer
Newer Management Options • Influenza vaccination • antiviral therapy • therapeutic • prophylactic
Rapid Diagnostic Tests Four commercially available kits • Directigen™ Flu A+B * • Zstat. Flu™ * * • Flu OIA® • Quick. Vue® (CLIA waived, October 4, 2000) * CLIA certification required
The Value of Surveillance • Monto, Arch Int Med 2000; 160: 3243 • 3744 patients in 231 centers • influenza known to be circulating • cough and fever (>100. 0 o. F) alone had an 80% positive predictive value for influenza (p<. 001) • “…when influenza virus is confirmed in a region, persons with fever, muscle aches, and cough most likely have influenza. ” Treanor JJ. In: Mandell, Douglas, and Bennett’s Principles and Practice of Infectious Diseases. 5 th ed. 2000: 1837.
Influenza Activity in the US 2010 -2016
2017 -18 Influenza Vaccine • 2 March 2017 • an A/Michigan/45/2015 (H 1 N 1)pdm 09 -like virus; • an A/Hong Kong/4801/2014 (H 3 N 2)-like virus; and • a B/Brisbane/60/2008 -like virus. • 166 -173 million doses available
Efficacy of the 2015 -16 Influenza Vaccine • Statistically, 43% effective in completely preventing illness 2016 -17; significantly reduces severity in >80% • Composite of past 10 years • 70%-90% effective in preventing illness <65 yrs old • 30%-70% in preventing hospitalization in elderly not in chronic care facility • 30%-40% in preventing illness in frail elderly • 50%-60% in preventing hospitalization in nursing home elderly • 80% in preventing death in nursing home elderly
Tamiflu
Limitations • Must be given within 48 hours of symptom onset • Only works for influenza • Expense • No direct comparison with amantidine • Advantages are theoretical • Nausea
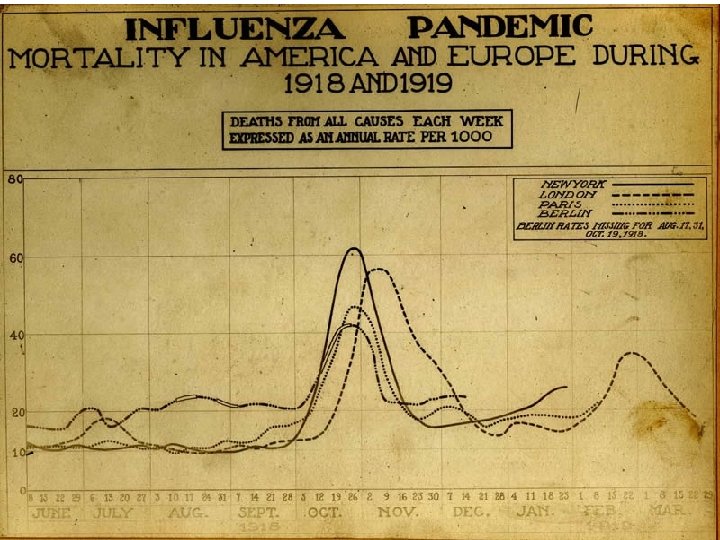
Pandemic, The Movie • Sudden onset of severe cough, shortness of breath, headache, bleeding from nose and lungs, turning blue and followed by death in 4 -6 hours • No treatment works • Spreads rapidly, without physical contact • ~50% transmission rate • Affects people 18 -30 preferentially and kills ~8% of this age group in the world • 100 million people in two episodes of two months each • In 24 weeks more people dead of acute illness than died in 100 years of Bubonic Plague This was the actual scenario in 1918
Fall, 1918 • Relatives won’t come to the aid of orphaned children • Churches disband • Women ignore government pleas for nurses • Called the Spanish Flu because Spain is one of the few countries to not censor influenza news • US Army refuses to curtail recruiting or reduce crowding, disregarding its own medical corps • The 28 th President • German Army is forced to cancel its major offensive to win the War • and loses it
Camp Funston, Kansas 10/12/1918
Influenza 1850 – 2000 Documentable Deaths
Influenza 1850 – 2000
Disasters Event # dead % population Smallpox/Measles (Mexico 1500 s) 27+ million? >50% of natives Black Plague (Europe 1347 -54) 25 million World War II (1938 -45) 47 million 2. 4 (3/4 civilian) (1. 8% of all humans) Influenza (worldwide, 1918 -19) 21 million 1. 2 Flood (Huang He River, China, 1931) 3. 7 million (90%? ? ) 25% of Europeans (8% of all humans) 8% of young adults 1
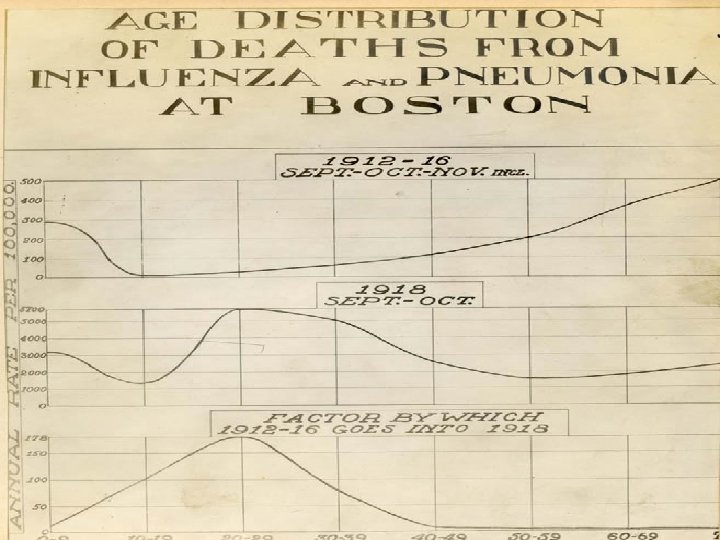
What Happened in 1918?
The Severity of Communicable Diseases is Based on the Susceptible Population Density Camp Funston, Kansas, February 1917 susceptible population density SARS Ebola before 2014 Severe influenza epidemic plague Ebola after 2014 Fall normal “common cold” mild influenza summer normal disease severity
Ways to Reduce Susceptible Population Density • Death • debility • Immunization • Cultural factors • Migration • Flight from cities
Epidemic Considerations Peak determined partly by ability of communicable individuals to be in contact with others (“wellness”) Leveling as density decreases (immunity, death, flight) Infectious agent self-attenuates Exponential increase while density remains above threshold Susceptible individuals
The New Zealand Rabbit Plague • Hunters • Rabbit control boards • Ferrets, weasels, stoats, and cats • Myxomatosis (1950) • Rabbit calcivirus (1997)
The Natural History of Disease Severity the higher the mortality rate, the more rapid the change Survival (months) Time since introduction
Wake Up!