8 Mixed Text and Image Orientation Image skewed

를 파악하여 바로잡는 것(rotation) ▷ straight line 이용 ▷")


= h(n)h(n+k) h(n)2")


- Slides: 10
8. Mixed Text and Image 인공지능연구실
Orientation • Image의 기울어진 정도(skewed angle)를 파악하여 바로잡는 것(rotation) ▷ straight line 이용 ▷ left-margin search ▷ projection profile ▷ slope histogram과 docstrum 3
Detecting straight lines using the Hough transform • Figure 8. 3, 8. 4 4
Left-margin search • Text의 left-margin을 찾아 skew angle을 구 한다 • 각 scan line의 첫 black pixel을 만날 때까 지 검색(black pixel화) • 문제점 ▷ Broken up ▷ 신뢰성 낮아 실제 사용하지 않음 5
Projection profile • 각 scan line의 black pixel의 수를 계산하 여 수평축상에 project한 histogram ▷ text line사이에 valley가 생긴다 • Skewed angle ▷ histogram에서 marked valley가 나타날 때까지 rotate(sharpest valley) ▷그림 8. 6 ▷sharpest valley에서의 angle이 document의 skew angle 6
Projection profile Autocorrelation function • Projection profile상의 valley의 sharpness 를 측정 (k)= h(n)h(n+k) h(n)2 h(n)은 n위치의 histogram의값 ▷ k 값에 따른 autocorrelation function의 결과 그림 8. 7 a, 8. 7 b • Measure of sharpness (0) + (kp) - (kp/2) 2 ▷ 높은 값을 가지는 경우 더 sharp, 그림 8. 7 a: 0. 4 , 8. 7 b: 0. 04 • 아주 많은 계산량을 요구 7
Projection profile Estimate sharpness • Autocorrelation function이용의 어려움 ▷ autocorrelation function 계산 ▷ first peak를 발견 • Projection profile sharpness 추정 ▷ R= ( ) [h(n+1) – h(n)]2 : 기울기 제곱의 합 ( ) = 1/cos( ) for 0 o≤ < 45 o, 135 o≤ <180 o 1/sin( ) for 45 o≤ <135 o ( )는 projection profile의 상대적인 길이 • R값이 클수록 image가 correct ▷ 그림 8. 6 a: 1, 500, 000 , 그림 8. 6 b: 275, 000 8
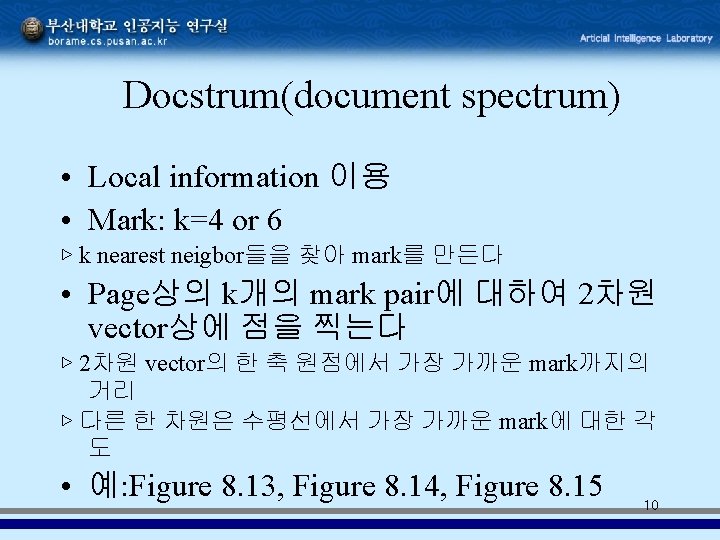
Slope histogram • Histogram-based technique ▷ image내의 mark들 사이의 관계를 이용 ▷ mark: black pixel의 connected group(character) • 방법 ▷ 모든 mark의 쌍들 사이의 slope를 계산(reference point = lower-left corner) ▷ 이 slope를 histogram으로 표현 ▷ 그림 8. 11, ▷ 0도에서 peak발생(text의 base line): correct image ▷ 2 o skew → 2 o peak 발생 • N개의 mark → n*n개의 slope (n(n-1)/2) 9