8 1 Sampling Bias Random a procedure for

8. 1 Sampling & Bias
 the selection")
§ Random: a procedure for sampling from a population in which (a) the selection of a sample unit is based on chance and (b) every element of the population has a known, non-zero probability of being selected. § Stratified: the researcher divides the population into separate groups, called strata. Then, a probability sample (often a simple random sample) is drawn from each group. § Cluster: the researcher divides the population into separate groups, called clusters. Then, a simple random sample of clusters is selected from the population. The researcher conducts his analysis on data from the sampled clusters. § Convenience: made up of people who are easy to reach. § Systematic: with systematic random sampling, we create a list of every member of the population. From the list, we randomly select the first sample element from the first k elements on the population list. Thereafter, we select every kth element on the list. § Voluntary Response: made up of people who self-select into the survey. Often, these folks have a strong interest in the main topic of the survey.
 The Ontario government randomly selects five high schools in Ontario and surveys each")
a) The Ontario government randomly selects five high schools in Ontario and surveys each teacher in those schools. b) You choose every 100 th name from a phone number directory. c) A researcher randomly selects 50 male and 50 female in his study of technology in the classroom. d) At a small community college, a student surveyed everyone in her Biology class to determine the percentage of students who own a car.

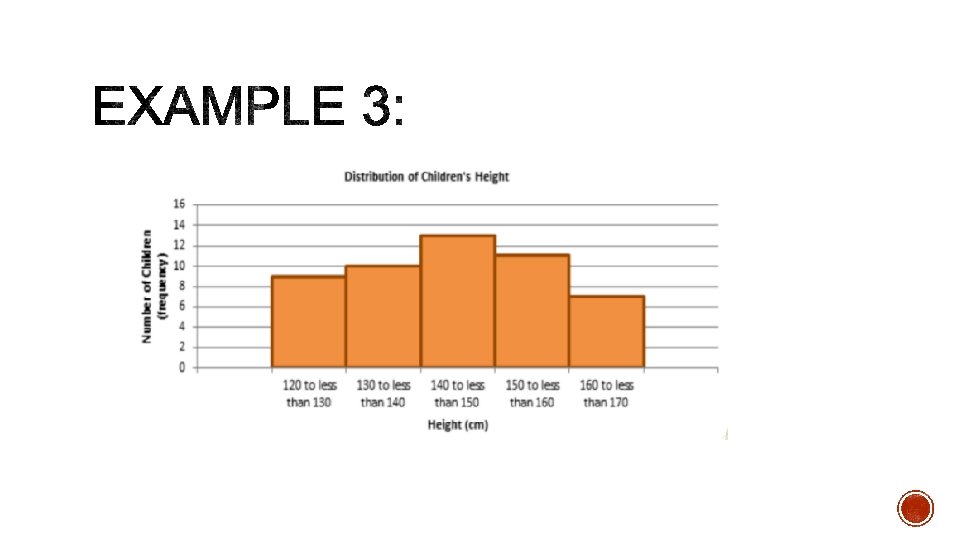
Frequency Distribution: A table that displays the frequency of various outcomes in a sample. § Each entry in the table contains the frequency, or count of the occurrences, within a particular group or interval. § The table summarizes the distribution of values in the sample. Histograms: A visual display that shows the frequency in columns on a graph. § x-axis: Variable being MEASURED (the measures or intervals) § y-axis: Frequency COUNT (how many items fall in that interval) Stem and Leaf Plot: § The STEM is the left side § The LEAF is the right side § Written in increasing numerical order

Box –and-Whisker Plot: § To create a box-and-whisker plot, you start by ordering your data. § Next, find the median of you data. The median divides your data into two halves. Mark the median above a number line at the correct spot. § Divide the data into quarters, find the medians of each of the two halves. Mark these above the number line. § Mark the highest and lowest points above the number line.
 How many children are in the 160 to less than 170 range? b)")
a) How many children are in the 160 to less than 170 range? b) In which range do most of the children fall?
")
Sampling Techniques and Graphical Representation WS: (Multiples of 3)
- Slides: 8