700 1995 Chicago heat wave 5 days above


700

1995 Chicago heat wave 5 days above 100°F apparent temperature 739 1, 072 3, 300 deaths hospitalizations ED visits 14. 6 heat-related death rate ratio for adults 65+

2006 California heat wave 11 consecutive days above 100°F 655 1, 182 16, 166 deaths hospitalizations ED visits

2003 heat wave in France Hottest summer in Europe in the last 15 500 years consecutive days over 95°F 14, 800 deaths 4. 4 relative risk of heat-related death with no AC

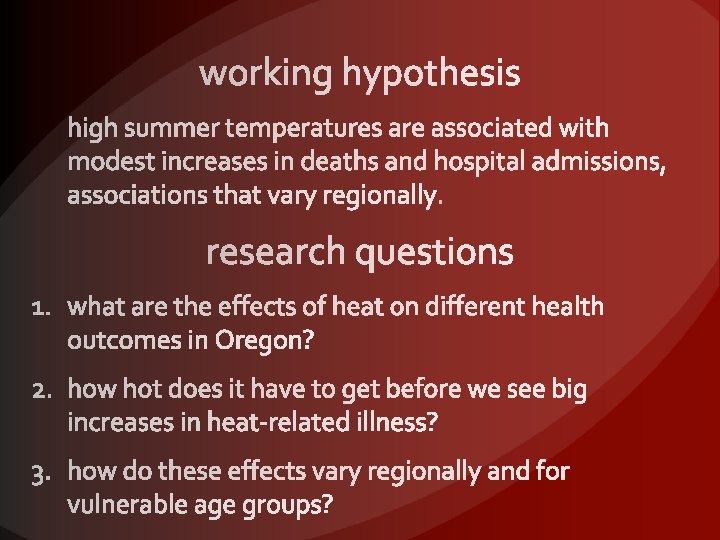
increase, deaths

oh no! are we headed for a fiery future of endless heat waves?

77°F 50°F 37. 2 1. 7 110 °F

33. 3 1. 8 111, 277 11, 300

coastal region 68°F average day time high temperature 49°F average night time low temperature 1. 1 average number of days above 85°F 0 average number of days above 100°F 96 °F normals highest average temperature Coos Bay climate

eastern region 80°F average day time high temperature 46°F average night time low temperature 56. 5 average number of days above 85°F 1. 9 average number of days above 100°F 108 °F normals highest average temperature La Grande climate

southwest region 82°F average day time high temperature 49°F average night time low temperature 69. 8 average number of days above 85°F 4. 8 average number of days above 100°F 110 °F normals highest average temperature Medford climate

Willamette valley region 77°F average day time high temperature 51°F average night time low temperature 32. 7 average number of days above 85°F 1. 3 average number of days above 100°F 108 °Fnormals highest average temperature Corvallis climate

Oregon zip codes Census dailymortality hospital zip code weather station zip code boundary admission population counts datacounts estimates population weighted d 3 weighted • daily max temp average: selected • big daily min town stations temp weather station center small town d 2 w 1 = 1 - d 1/(d 1 + d 2) geographic center d 1 w 2 = 1 - d 2/(d 1 + d 2) N 4 miles


Max temp r = 0. 49 p = <0. 0001 Min temp outcome heat-related hospitalizations age 0 -4 heat-related hospitalizations age 65+ heat-related hospitalizations predictor max temp rate ratio (95% CI) 3. 66 (3. 18, 4. 22) p-value <0. 0001 min temp max temp 1. 37 (1. 12, 1. 68) -- 0. 0019 -- min temp max temp -3. 79 (3. 15, 4. 56) -<0. 0001 min temp 1. 33 (0. 98, 1. 80) 0. 0648

coastal

eastern

southwestern

willamette

26. 0 21. 0 16. 0 11. 0 6. 0 5 10 ax ax tm tm 10 0 95 tm ax 90 85 ax tm 80 ax tm tm ax 75 1. 0 65 Heat Hosp Rate Ratio Maximum Temperature Threshold and Heat Hospitalization Rate Ratio Daily Maximum Temperature Threshold 26. 0 21. 0 16. 0 11. 0 6. 0 Daily Minimum Temperature Threshold 75 in tm 70 in tm 65 in tm 60 in tm 55 in tm 50 in tm in 45 1. 0 tm Heat Hosp Rate Ratio Minimum Temperature Threshold and Heat Hospitalization Rate Ratio

Age 65+ non-injury hospitalizations electrolyte hospitalizations predictor max temp min temp adjusted rate ratio (95% CI) 1. 009 (1. 006, 1. 011) 0. 992 (0. 987, 0. 997) 1. 012 (1. 007, 1. 018) 0. 987 (0. 979, 0. 995) 1. 056 (1. 034, 1. 077) 1. 047 (1. 002, 1. 094) p-value <0. 0001 0. 0011 <0. 0001 0. 0392 all non-injury deaths max temp 1. 009 (1. 001, 1. 017) 0. 0231 outcome all non-injury hospitalizations

all non-injury hospitalizations

electrolyte imbalance hospitalizations

all non-injury deaths

2. 9000 2. 4000 1. 9000 1. 4000 5 10 ax ax tm 10 0 95 ax tm tm tm ax 90 85 ax tm 80 ax tm tm ax 70 ax tm 75 0. 9000 65 Electrolyte Hospitalization Rate Ratio Maximum Temperature Threshold and Electrolyte Hospitalization Rate Ratio Daily Maximum Temperature Threshold 2. 9000 2. 4000 1. 9000 1. 4000 Daily Minimum Temperature Threshold 75 in tm 70 in tm 65 in tm 60 in tm 55 in tm 50 in tm in 45 0. 9000 tm Electrolyte Hospitalization Rate Ratio Minimum Temperature Threshold and Electrolyte Hospitalization Rate Ratio

- Slides: 32