7 4 Frequency dependence Dielectric constant and dielectric


 An ac field is applied to a dipolar medium. The polarization")


 r = real part of the complex dielectric")
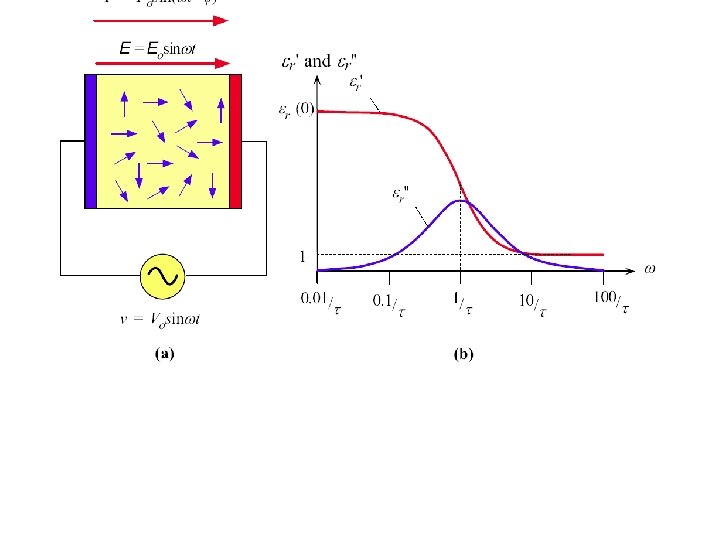


 Real and imaginary part is of the dielectric constant, r' and r''")

- Slides: 21
7. 4 Frequency dependence: Dielectric constant and dielectric loss 7. 4. 1 dielectric loss The dc field is suddenly changed from Eo to E at time t = 0. The induced dipole moment p has to decrease from d(0)Eo to a final value of ad(0)E. The decrease is achieved by random collisions of molecules in the gas.
Dipolar Relaxation Equation 上述现象的数学描述, 目的为推出极化率随 频率的变化 p = dipole moment, dp/dt = rate at which the induced dipole moment is changing, d = dipolar orientational polarizability, E = electric field, = relaxation time Orientational Polarizability and Frequency Pav=αEloc d ( ) = dipolar orientational polarizability as a function of , = angular frquency of the applied field, = relaxation time, j is (-1). d ( ) is a complex number that indicates that p and E are out of phase.
Complex Relative Permittivity r = dielectric constant r = real part of the complex dielectric constant r = imaginary part of the complex dielectric constant j = imaginary constant (-1)
r随频率变化 (a) An ac field is applied to a dipolar medium. The polarization P(P = Np) is out of phase with the ac field. (b) The relative permittivity is a complex number with real ( r') and imaginary ( r'') parts that exhibit frequency dependence.
r实虚部意义 Input power=IV=YV 2=jωCV 2+V 2/Rp The dielectric medium behaves like an ideal (lossless) capacitor of capacitance C which is in parallel with a conductance Gp.
Admittance of a Parallel Plate Capacitor Y = j C + G P Y = admittance, = angular frequency of the applied field , C = capacitance, GP = conductance C=Aε 0εr’/d Gp=ωAε 0εr’’/d Loss Tangent tan = loss tangent or loss factor, r = real part of the complex dielectric constant, r = imaginary part of the complex dielectric constant
Dielectric Loss per Unit Volume Wvol = dielectric loss per unit volume, = angular frquency of the applied field , E = electric field, o = permittivity of free space, r = real part of the complex dielectric constant, tan = loss tangent or loss factor This equation represents the power disspated per unit volume in the polarization mechanism: energy lost per unit time to random molecular collisions as heat. It is clear that dielectric loss is influenced by three factors: , E, and tan
Example 7. 5 Obtain the dielectric loss per unit capacitance in a capacitor in terms of the loss tangent. Obtain the phase difference between the current through the capacitor and that through Rp. What is the significance of
7. 4. 2 Debye Equations, cole-cole plots, and equivalent series circuit • Condider a dipolar dielectric in which there are both orientational and electronic polarizations : d, e, respectively, contributing to the overall polarizability.
r = dielectric constant (complex) r = real part of the complex dielectric constant r = imaginary part of the complex dielectric constant = angular frequency of the applied field = relaxation time
A capacitor with a dipolar dielectric and its equivalent circuit in terms of an ideal Debye relaxation.
7. 6 Dielectric strength and insulation breakdown Coaxial cable connector with traces of corona discharge; electrical treeing. 电晕 SOURCE: M. Mayer and G. H. Schröder , “Coaxial 30 k. V Connectors for the RG 220/U Cable: 20 Years of Operational Experience”IEEE Electrical Insulation Magazine , Vol. 16, March/April 2000, p 11, Figure 6. ( IEEE, 2000)
7. 7 Capacitor dielectric materials • 7. 7. 1 Typical capacitor constructions
7. 7. 2 Dielectrics: Comparison
Capacitance per unit volume Cvol = capacitance per unit volume, o = permittivity of free space, r = dielectric constant, d = separation of the capacitor plates Maximum energy per unit volume Evol = maximum energy stored per unit volume, C = capacitance, Vm = maximum voltage, A = surface area of the capacitor plates, d = separation of the capacitor plates, o = permittivity of free space, r = real part of the complex dielectric constant, = safety factor, Ebr = breakdown electric field
Dielectric loss per unit volume Wvol = dielectric loss per unit volume, Ebr = breakdown electric field, = safety factor, o = permittivity of free space, r = real part of the complex dielectric constant, tan = loss tangent or loss factor, = angular frequency of the applied field
7. 12:
例 (a) Real and imaginary part is of the dielectric constant, r' and r'' versus frequency for (a) a (b) polymer, PET, at 115 C and (b) an ionic crystal, KCl, at room temperature. (c) both exhibit relaxation peaks but for different reasons. (d) SOURCE: Data for (a) from author’s own experiments using a dielectric analyzer (DEA), (e) (b) from C. Smart, G. R. Wilkinson, A. M. Karo, and J. R. Hardy, International Conference on (f) lattice Dynamics, Copenhagen, 1963, as quoted by D. G. Martin, “The Study of the Vibration (g) of Crystal Lattices by Far Infra-Red Spectroscopy, ” Advances in Physics, 14, no. 53 -56, 196 pp. 39 -100.
Cole-Cole plots Cole-Cole plot is a plot of r vs. r as a function of frequency, . As the frequency is changed from low to high frequencies, the plot traces out a circle if Debye equations are obeyed.