7 2 GRAPHING LINEAR INEQUALITIES How are these


- Slides: 17
7. 2 GRAPHING LINEAR INEQUALITIES
How are these different from lines? �The answer is not the points that are ON the line, it’s the shaded region that lies above or below the line.
To graph a Linear Inequality: � � � Rewrite into slope-intercept form Remember that if you multiply or divide by a negative number, reverse your inequality symbol. Graph your line � Begin with B � Use slope to find 2 nd point on line � Make 2 decisions to finish (next two slides)
Decision 1: Dashed or Solid
Decision 2: Shade Above or Below BELOW ABOVE
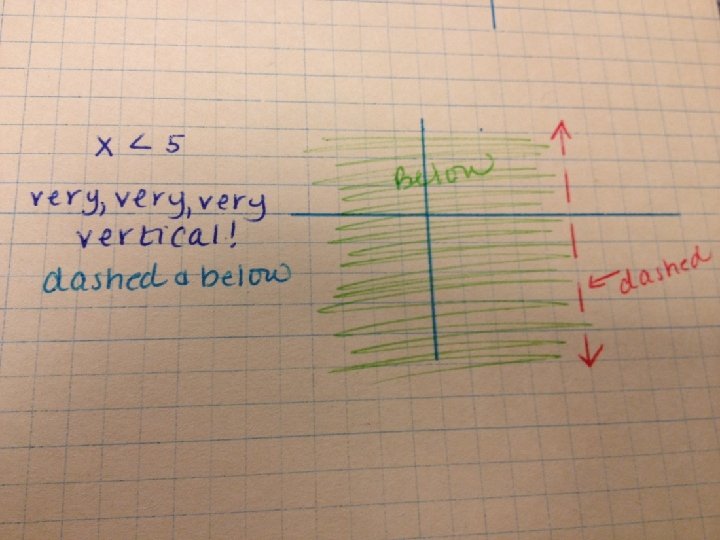
Horizontal VS. Vertical Lines ABOVE BELOW ABOVE
Example 1
Example 3: Application Ada has at most 285 beads to make jewelry. A necklace requires 40 beads, and a bracelet requires 15 beads. Write a linear inequality to describe the situation. Let x represent the number of necklaces and y the number of bracelets. Write an inequality. Use ≤ for “at most. ”
Example 3 a Continued Necklace beads 40 x plus bracelet beads is at most 285 beads. + 15 y ≤ 285 Solve the inequality for y. 40 x + 15 y ≤ 285 – 40 x 15 y ≤ – 40 x + 285 Subtract 40 x from both sides. Divide both sides by 15.
Example 3 b b. Graph the solutions. Step 1 Since Ada cannot make a negative amount of jewelry, the system is graphed only in Quadrant I. Graph the boundary line = Use a solid line for ≤.
Example 3 b Continued b. Graph the solutions. Step 2 Shade below the line. Ada can only make whole numbers of jewelry. All points on or below the line with whole number coordinates are the different combinations of bracelets and necklaces that Ada can make.
Example 3 c c. Give two combinations of necklaces and bracelets that Ada could make. Two different combinations of jewelry that Ada could make with 285 beads could be 2 necklaces and 8 bracelets or 5 necklaces and 3 bracelets. (2, 8) (5, 3)
Check It Out! Example 3 What if…? Dirk is going to bring two types of olives to the Honor Society induction and can spend no more than $6. Green olives cost $2 per pound and black olives cost $2. 50 per pound. a. Write a linear inequality to describe the situation. b. Graph the solutions. c. Give two combinations of olives that Dirk could buy.
Check It Out! Example 3 Continued Let x represent the number of pounds of green olives and let y represent the number of pounds of black olives. Write an inequality. Use ≤ for “no more than. ” Green olives plus black olives 2 x + 2. 50 y Solve the inequality for y. 2 x + 2. 50 y ≤ 6 – 2 x 2. 50 y ≤ – 2 x + 6 2. 50 is no more than ≤ total cost. 6 Subtract 2 x from both sides. Divide both sides by 2. 50.
Check It Out! Example 3 Continued y ≤ – 0. 80 x + 2. 4 Step 1 Since Dirk cannot buy negative amounts of olive, the system is graphed only in Quadrant I. Graph the boundary line for y = – 0. 80 x + 2. 4. Use a solid line for≤. Black Olives b. Graph the solutions. Green Olives
Check It Out! Example 3 Continued Two different combinations of olives that Dirk could purchase with $6 could be 1 pound of green olives and 1 pound of black olives or 0. 5 pound of green olives and 2 pounds of black olives. Black Olives c. Give two combinations of olives that Dirk could buy. (0. 5, 2) (1, 1) Green Olives