
6 The Open Economy MACROECONOMICS N Gregory Mankiw




- Slides: 61
6 The Open Economy MACROECONOMICS N. Gregory Mankiw ® Power. Point Slides by Ron Cronovich © 2015 Worth Publishers, all rights reserved Fall 2014 update
IN THIS CHAPTER, YOU WILL LEARN: § accounting identities for the open economy § the small open economy model § what makes it “small” § how the trade balance and exchange rate are § determined how policies affect trade balance & exchange rate 1
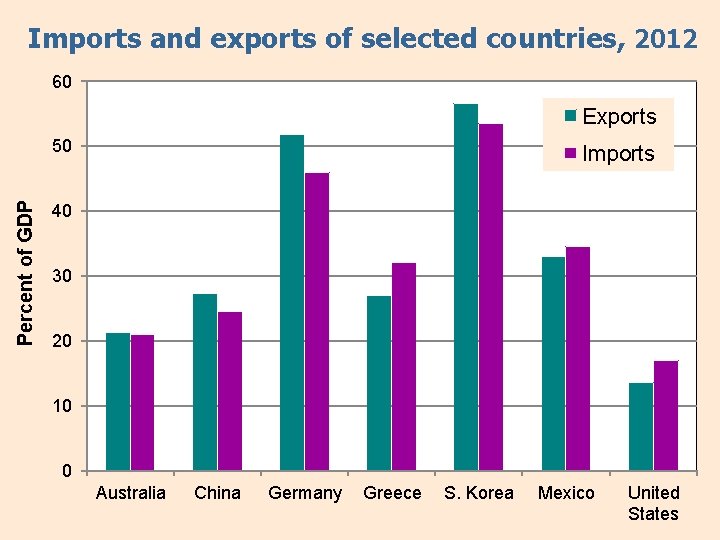
Imports and exports of selected countries, 2012 60 Exports Percent of GDP 50 Imports 40 30 20 10 0 Australia China Germany Greece S. Korea Mexico United States
In an open economy, § spending need not equal output § saving need not equal investment CHAPTER 6 The Open Economy 3
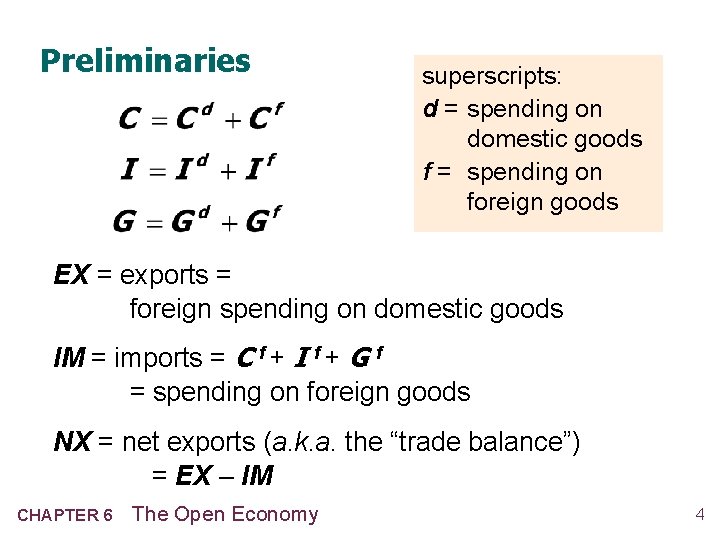
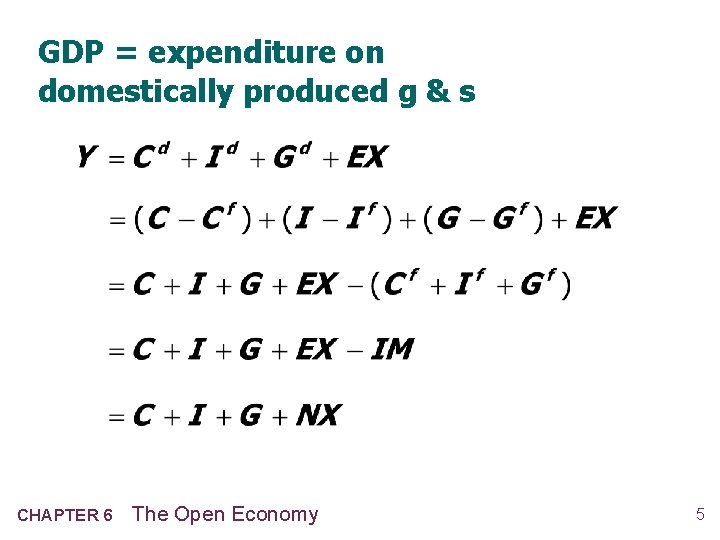
Preliminaries superscripts: d = spending on domestic goods f = spending on foreign goods EX = exports = foreign spending on domestic goods IM = imports = C f + I f + G f = spending on foreign goods NX = net exports (a. k. a. the “trade balance”) = EX – IM CHAPTER 6 The Open Economy 4
GDP = expenditure on domestically produced g & s CHAPTER 6 The Open Economy 5
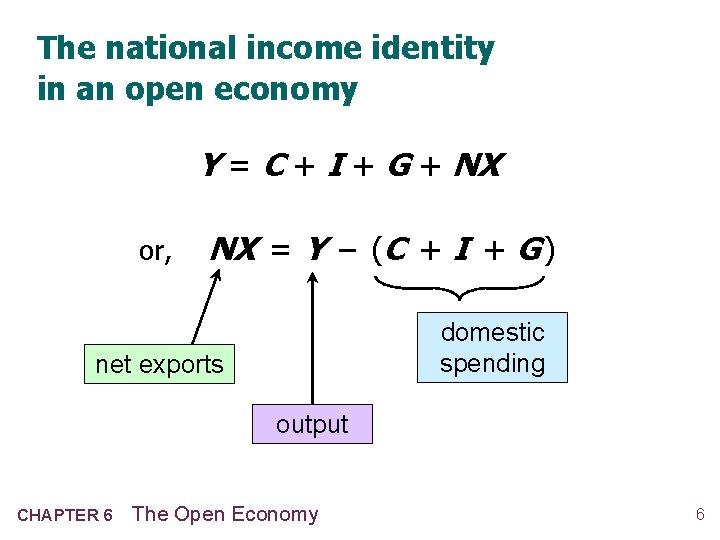
The national income identity in an open economy Y = C + I + G + NX or, NX = Y – (C + I + G ) domestic spending net exports output CHAPTER 6 The Open Economy 6
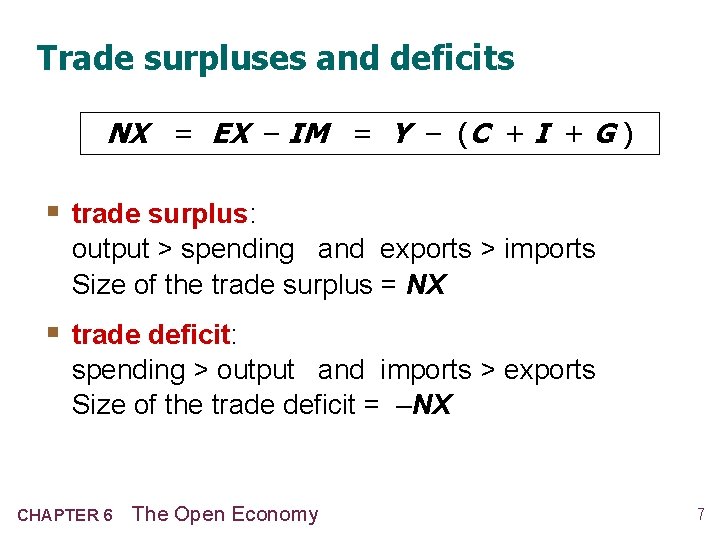
Trade surpluses and deficits NX = EX – IM = Y – (C + I + G ) § trade surplus: output > spending and exports > imports Size of the trade surplus = NX § trade deficit: spending > output and imports > exports Size of the trade deficit = –NX CHAPTER 6 The Open Economy 7
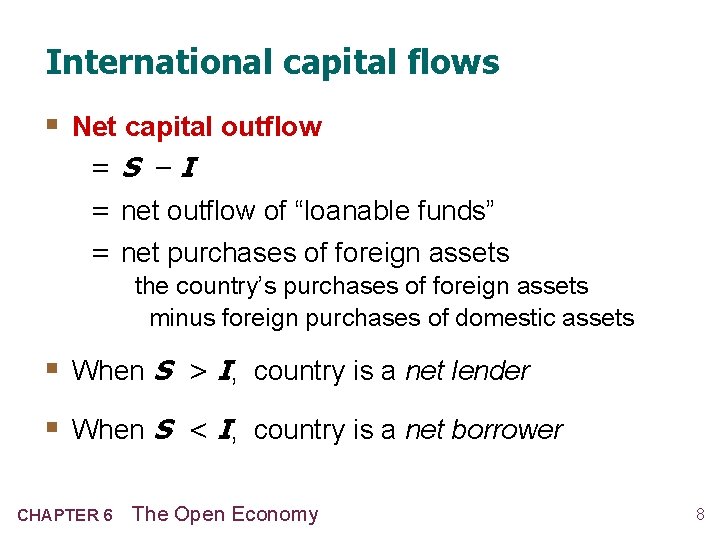
International capital flows § Net capital outflow =S –I = net outflow of “loanable funds” = net purchases of foreign assets the country’s purchases of foreign assets minus foreign purchases of domestic assets § When S > I, country is a net lender § When S < I, country is a net borrower CHAPTER 6 The Open Economy 8
The link between trade & cap. flows NX = Y – (C + I + G ) implies NX = (Y – C – G ) – I = S – I trade balance = net capital outflow Thus, a country with a trade deficit (NX < 0) is a net borrower (S < I ). CHAPTER 6 The Open Economy 9
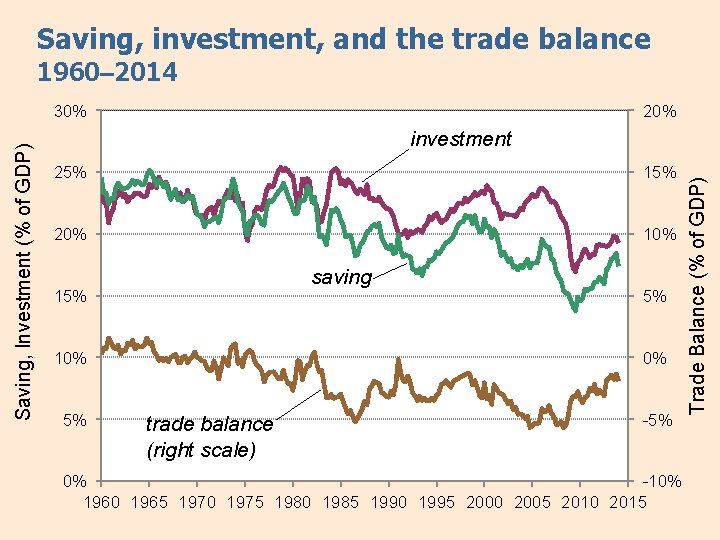
Saving, investment, and the trade balance 1960– 2014 20% investment 25% 15% 20% 10% saving 15% 10% 5% 5% 0% trade balance (right scale) -5% 0% -10% 1960 1965 1970 1975 1980 1985 1990 1995 2000 2005 2010 2015 Trade Balance (% of GDP) Saving, Investment (% of GDP) 30%
U. S. : The world’s largest debtor nation § Every year since 1980 s: huge trade deficits and net capital inflows, i. e. net borrowing from abroad § As of 3/30/2014: § U. S. residents owned $23. 6 trillion worth of foreign assets § Foreigners owned $29. 1 trillion worth of U. S. assets § U. S. net indebtedness to rest of the world: $5. 5 trillion—higher than any other country, hence U. S. is the “world’s largest debtor nation” CHAPTER 6 The Open Economy 11
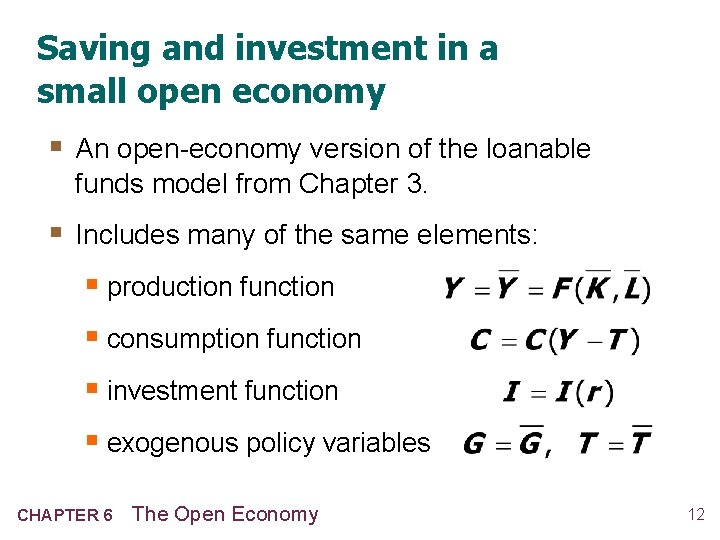
Saving and investment in a small open economy § An open-economy version of the loanable funds model from Chapter 3. § Includes many of the same elements: § production function § consumption function § investment function § exogenous policy variables CHAPTER 6 The Open Economy 12
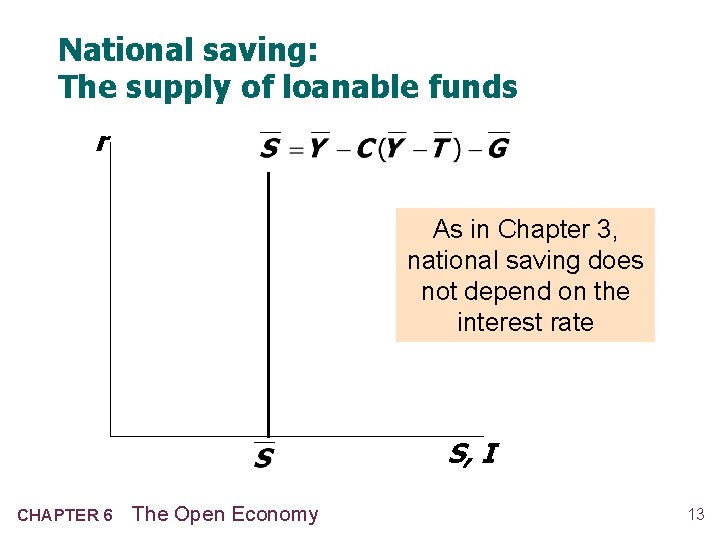
National saving: The supply of loanable funds r As in Chapter 3, national saving does not depend on the interest rate S, I CHAPTER 6 The Open Economy 13
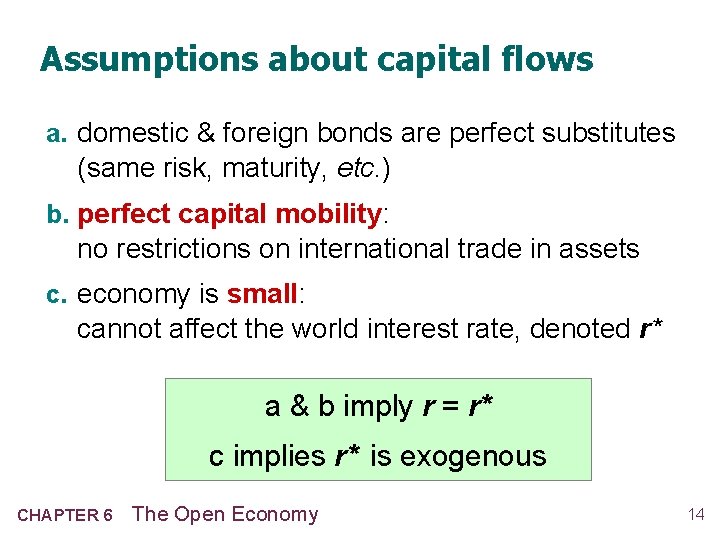
Assumptions about capital flows a. domestic & foreign bonds are perfect substitutes (same risk, maturity, etc. ) b. perfect capital mobility: no restrictions on international trade in assets c. economy is small: cannot affect the world interest rate, denoted r* a & b imply r = r* c implies r* is exogenous CHAPTER 6 The Open Economy 14
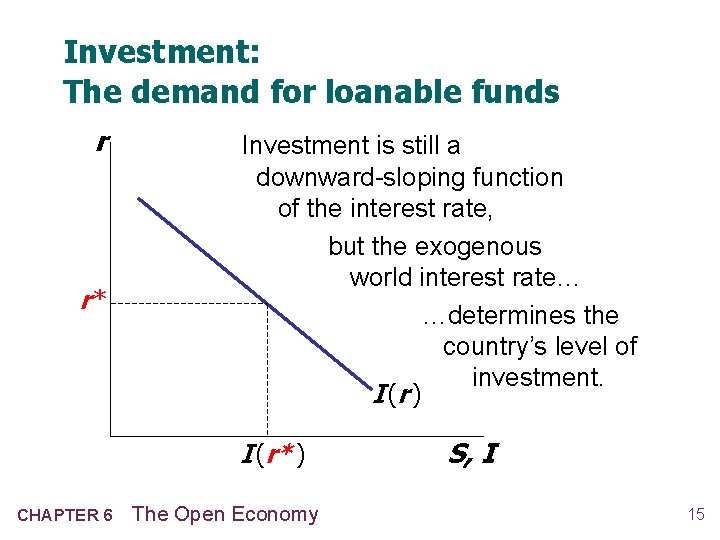
Investment: The demand for loanable funds r r* Investment is still a downward-sloping function of the interest rate, but the exogenous world interest rate… …determines the country’s level of investment. I (r ) I (r* ) CHAPTER 6 The Open Economy S, I 15
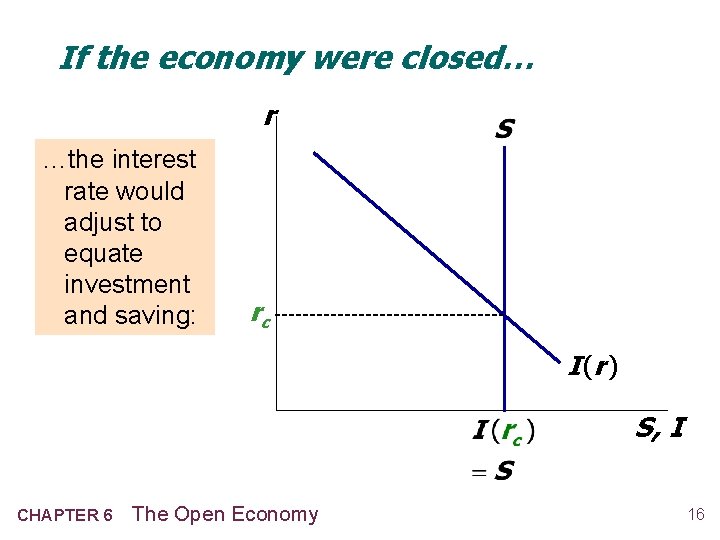
If the economy were closed… r …the interest rate would adjust to equate investment and saving: rc I (r ) S, I CHAPTER 6 The Open Economy 16
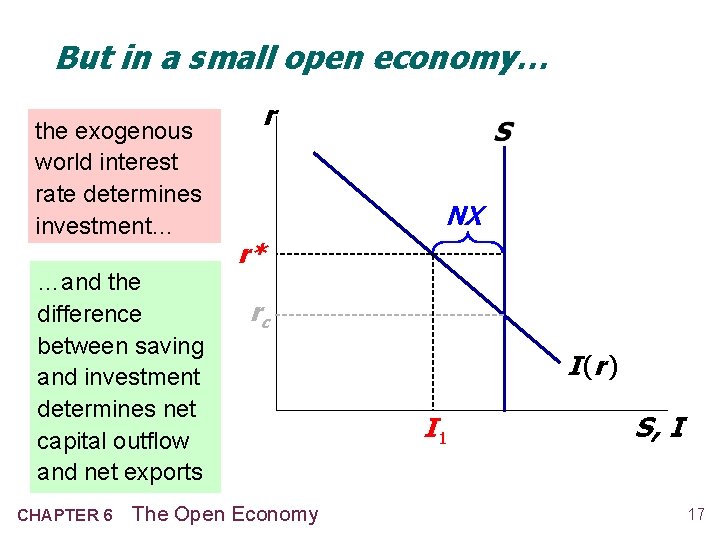
But in a small open economy… the exogenous world interest rate determines investment… …and the difference between saving and investment determines net capital outflow and net exports CHAPTER 6 r NX r* rc The Open Economy I (r ) I 1 S, I 17
Next, three experiments: 1. Fiscal policy at home 2. Fiscal policy abroad 3. An increase in investment demand (exercise) CHAPTER 6 The Open Economy 18
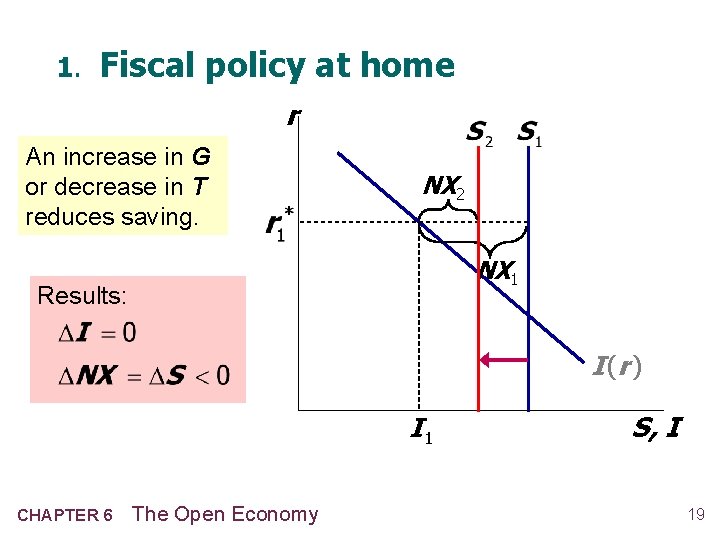
1. Fiscal policy at home r An increase in G or decrease in T reduces saving. NX 2 NX 1 Results: I (r ) I 1 CHAPTER 6 The Open Economy S, I 19
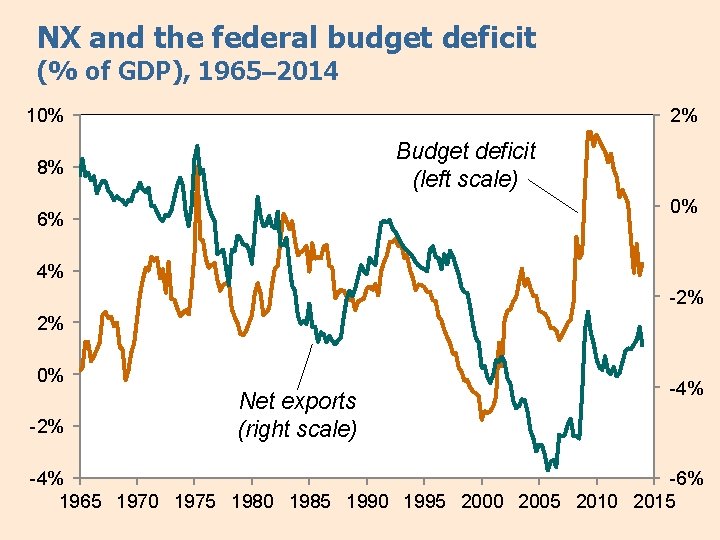
NX and the federal budget deficit (% of GDP), 1965– 2014 10% 2% Budget deficit (left scale) 8% 0% 6% 4% -2% 2% 0% -2% Net exports (right scale) -4% -6% 1965 1970 1975 1980 1985 1990 1995 2000 2005 2010 2015
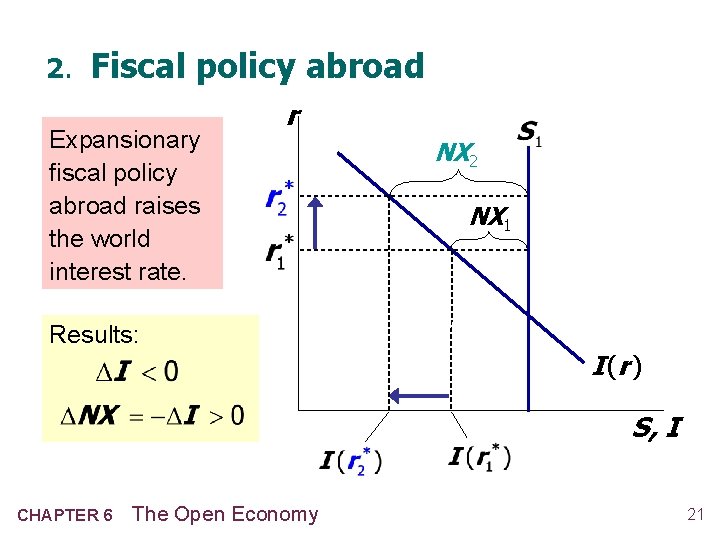
2. Fiscal policy abroad Expansionary fiscal policy abroad raises the world interest rate. r Results: NX 2 NX 1 I (r ) S, I CHAPTER 6 The Open Economy 21
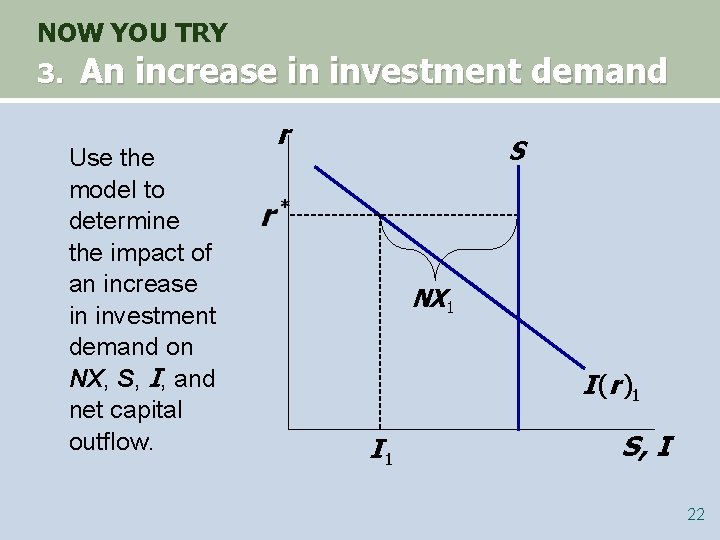
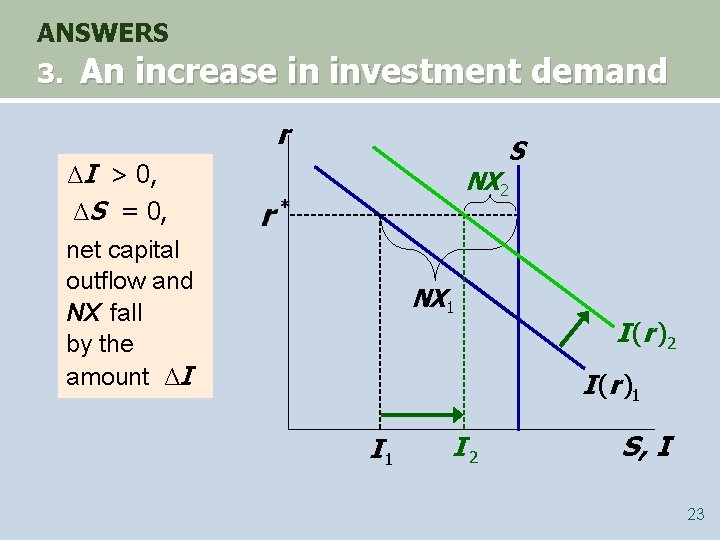
NOW YOU TRY 3. An increase in investment demand Use the model to determine the impact of an increase in investment demand on NX, S, I, and net capital outflow. r S NX 1 I (r )1 I 1 S, I 22
ANSWERS 3. An increase in investment demand r S ΔI > 0, ΔS = 0, net capital outflow and NX fall by the amount ΔI NX 2 NX 1 I (r )2 I (r )1 I 2 S, I 23
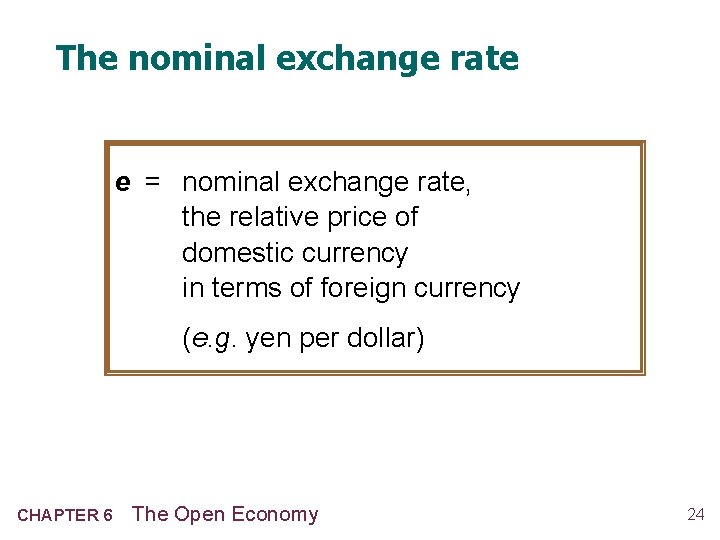
The nominal exchange rate e = nominal exchange rate, the relative price of domestic currency in terms of foreign currency (e. g. yen per dollar) CHAPTER 6 The Open Economy 24
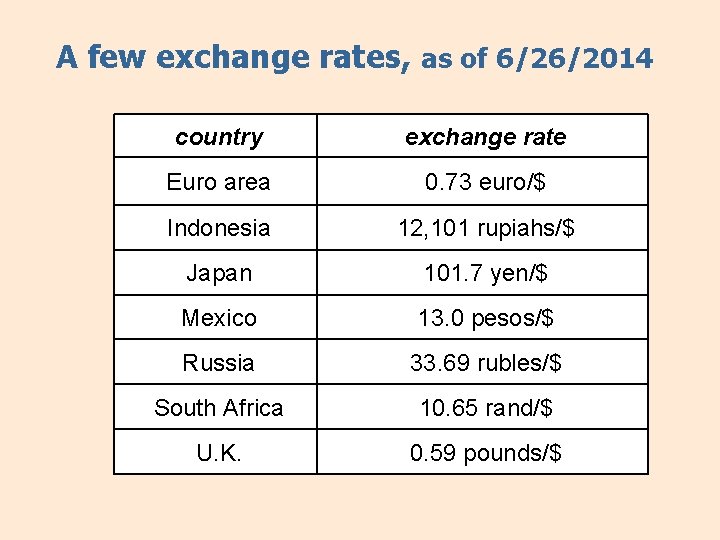
A few exchange rates, as of 6/26/2014 country exchange rate Euro area 0. 73 euro/$ Indonesia 12, 101 rupiahs/$ Japan 101. 7 yen/$ Mexico 13. 0 pesos/$ Russia 33. 69 rubles/$ South Africa 10. 65 rand/$ U. K. 0. 59 pounds/$
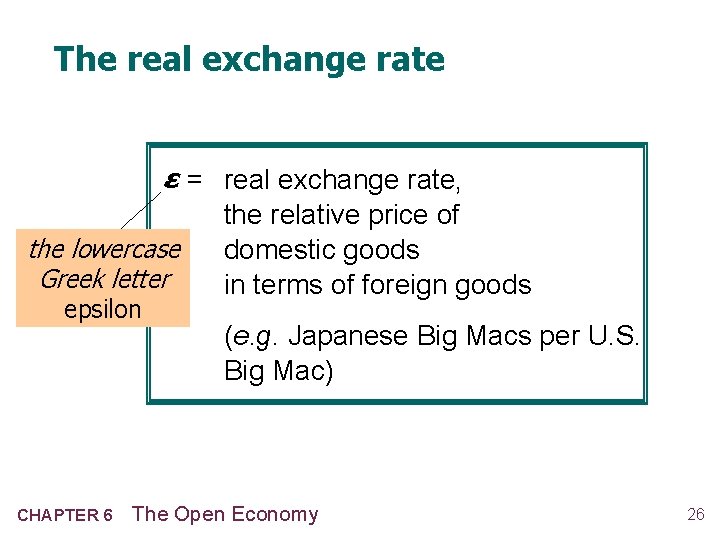
The real exchange rate ε = real exchange rate, the lowercase Greek letter epsilon CHAPTER 6 the relative price of domestic goods in terms of foreign goods (e. g. Japanese Big Macs per U. S. Big Mac) The Open Economy 26
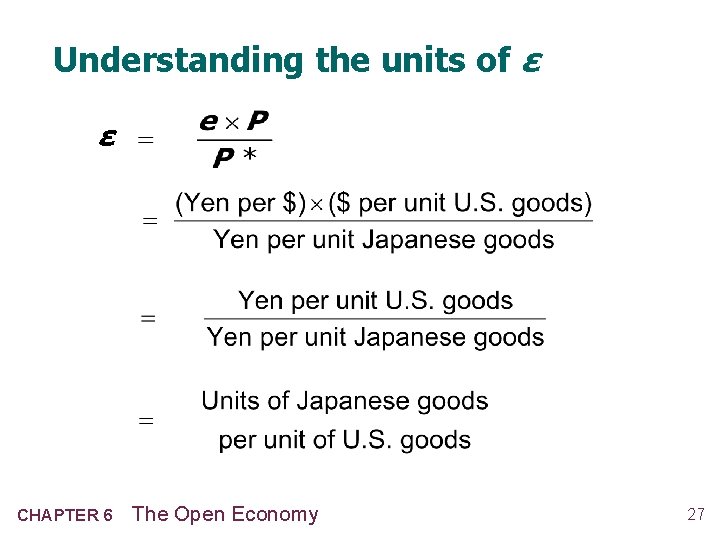
Understanding the units of ε ε CHAPTER 6 The Open Economy 27
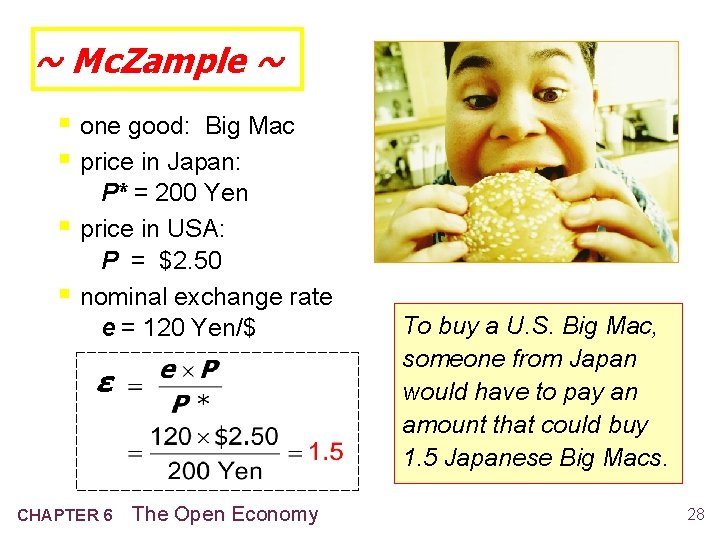
~ Mc. Zample ~ § one good: Big Mac § price in Japan: § § P* = 200 Yen price in USA: P = $2. 50 nominal exchange rate e = 120 Yen/$ ε CHAPTER 6 The Open Economy To buy a U. S. Big Mac, someone from Japan would have to pay an amount that could buy 1. 5 Japanese Big Macs. 28
ε in the real world & our model § In the real world: We can think of ε as the relative price of a basket of domestic goods in terms of a basket of foreign goods § In our macro model: There’s just one good, “output. ” So ε is the relative price of one country’s output in terms of the other country’s output CHAPTER 6 The Open Economy 29
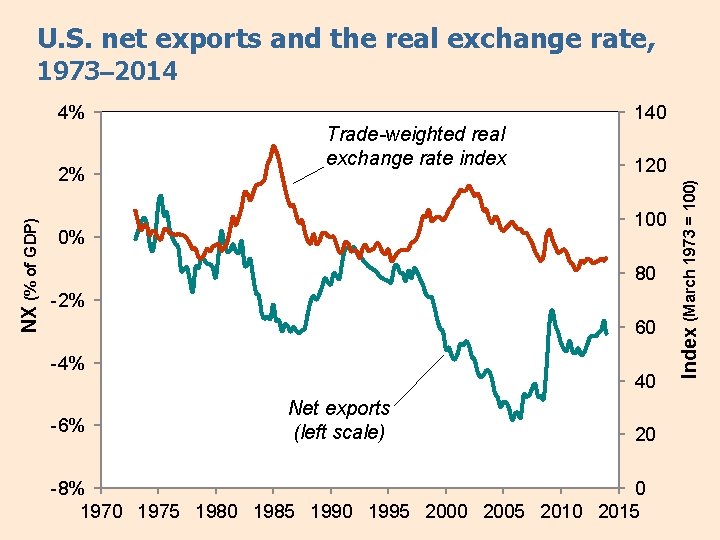
How NX depends on ε If ε rises: § U. S. goods become more expensive relative to foreign goods § exports fall, imports rise § net exports fall CHAPTER 6 The Open Economy 30
U. S. net exports and the real exchange rate, 1973– 2014 NX (% of GDP) 2% 140 Trade-weighted real exchange rate index 120 100 0% 80 -2% 60 -4% -6% 40 Net exports (left scale) 20 -8% 0 1975 1980 1985 1990 1995 2000 2005 2010 2015 Index (March 1973 = 100) 4%
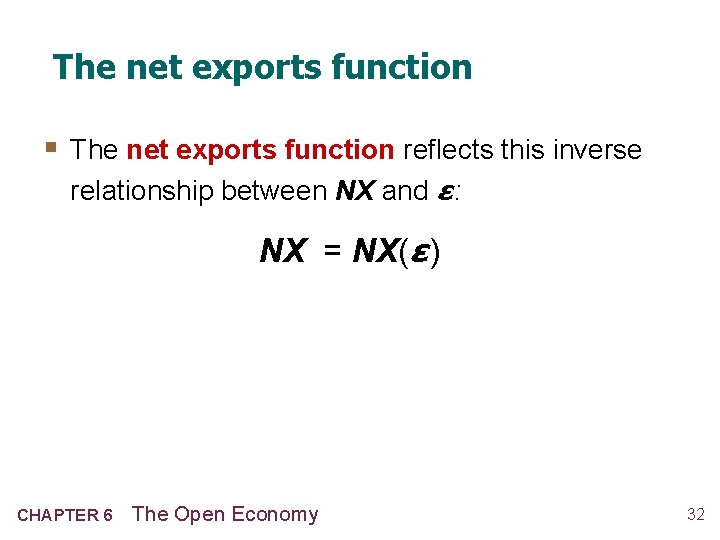
The net exports function § The net exports function reflects this inverse relationship between NX and ε : NX = NX(ε ) CHAPTER 6 The Open Economy 32
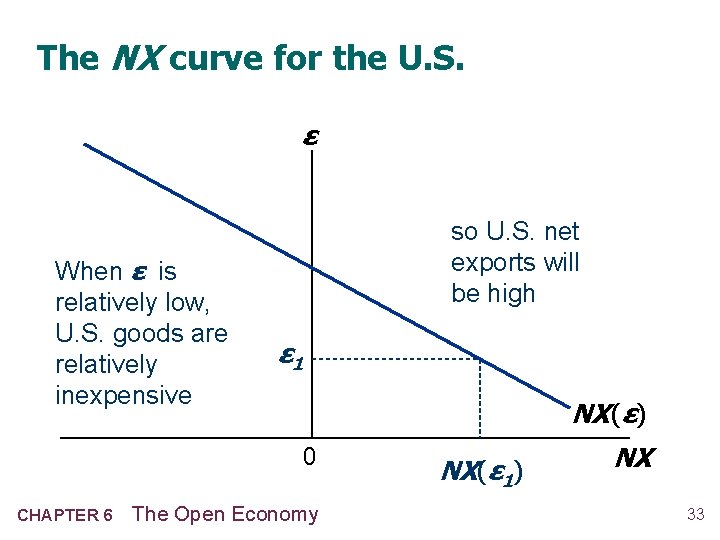
The NX curve for the U. S. ε When ε is relatively low, U. S. goods are relatively inexpensive so U. S. net exports will be high ε 1 NX (ε) 0 CHAPTER 6 The Open Economy NX(ε 1) NX 33
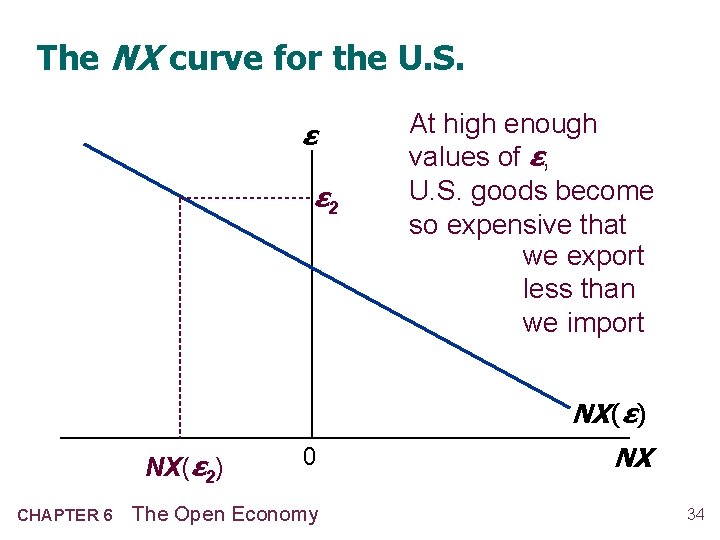
The NX curve for the U. S. ε ε 2 At high enough values of ε, U. S. goods become so expensive that we export less than we import NX (ε) NX(ε 2) CHAPTER 6 0 The Open Economy NX 34
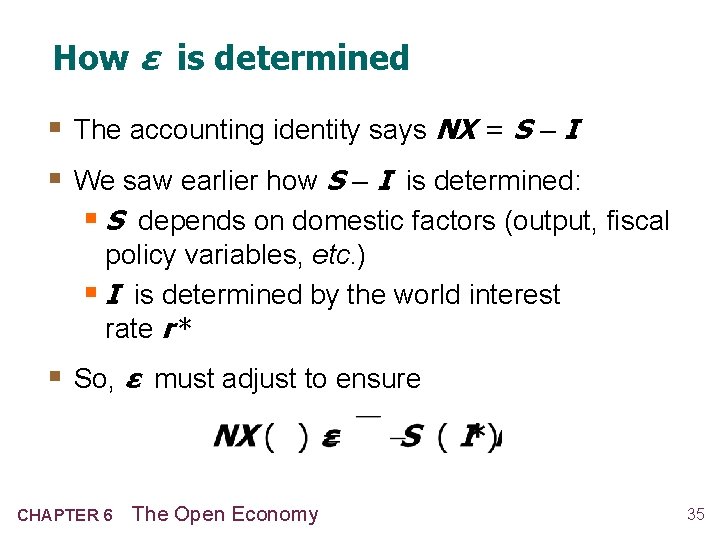
How ε is determined § The accounting identity says NX = S – I § We saw earlier how S – I is determined: § S depends on domestic factors (output, fiscal policy variables, etc. ) § I is determined by the world interest rate r * § So, ε must adjust to ensure CHAPTER 6 The Open Economy 35
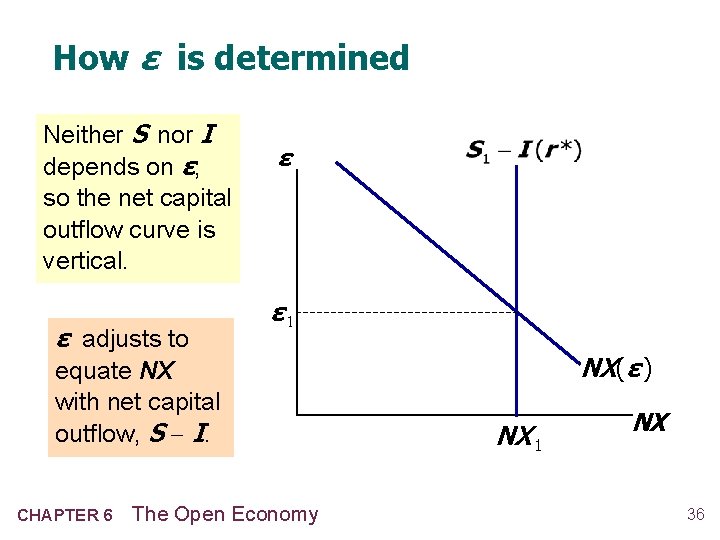
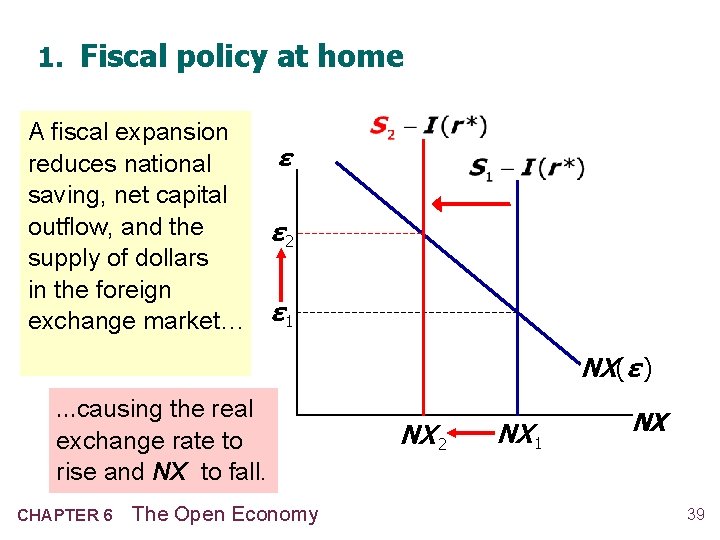
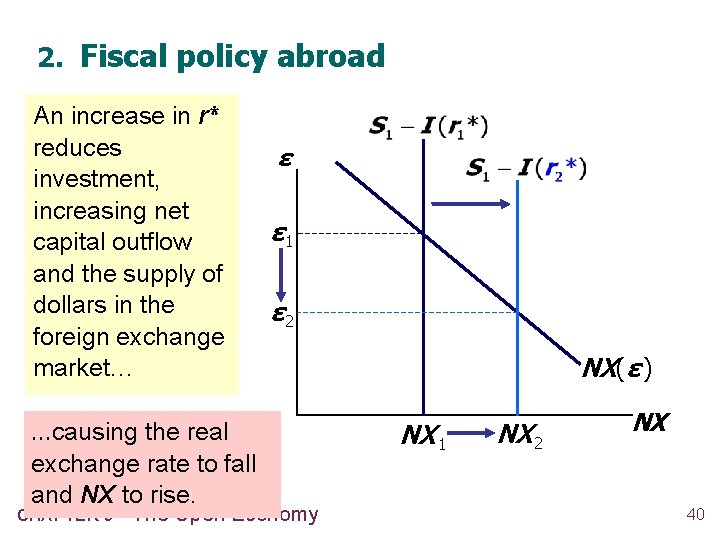
How ε is determined Neither S nor I depends on ε, so the net capital outflow curve is vertical. ε adjusts to ε ε 1 equate NX with net capital outflow, S - I. CHAPTER 6 The Open Economy NX(ε ) NX 1 NX 36
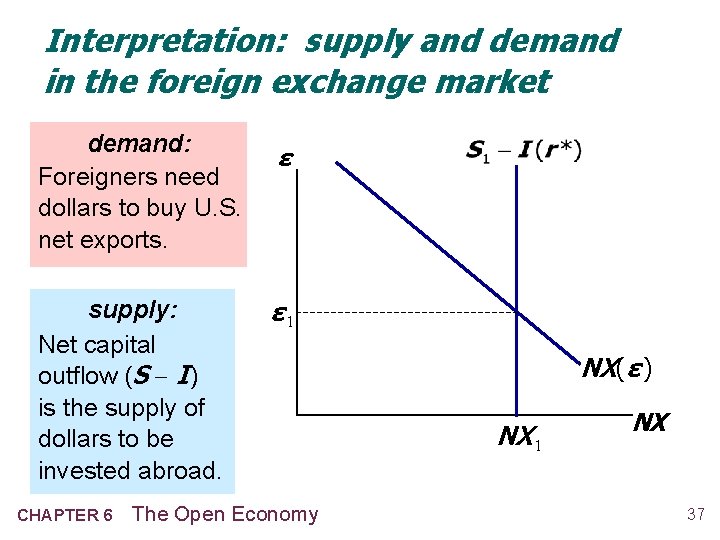
Interpretation: supply and demand in the foreign exchange market demand: Foreigners need dollars to buy U. S. net exports. ε supply: Net capital outflow (S - I ) is the supply of dollars to be invested abroad. ε 1 CHAPTER 6 The Open Economy NX(ε ) NX 1 NX 37
Next, four experiments: 1. Fiscal policy at home 2. Fiscal policy abroad 3. An increase in investment demand (exercise) 4. Trade policy to restrict imports CHAPTER 6 The Open Economy 38
1. Fiscal policy at home A fiscal expansion reduces national saving, net capital outflow, and the supply of dollars in the foreign exchange market… ε ε 2 ε 1 NX(ε ) …causing the real exchange rate to rise and NX to fall. CHAPTER 6 The Open Economy NX 2 NX 1 NX 39
2. Fiscal policy abroad An increase in r* reduces investment, increasing net capital outflow and the supply of dollars in the foreign exchange market… …causing the real exchange rate to fall and NX to rise. CHAPTER 6 ε ε 1 ε 2 The Open Economy NX(ε ) NX 1 NX 2 NX 40
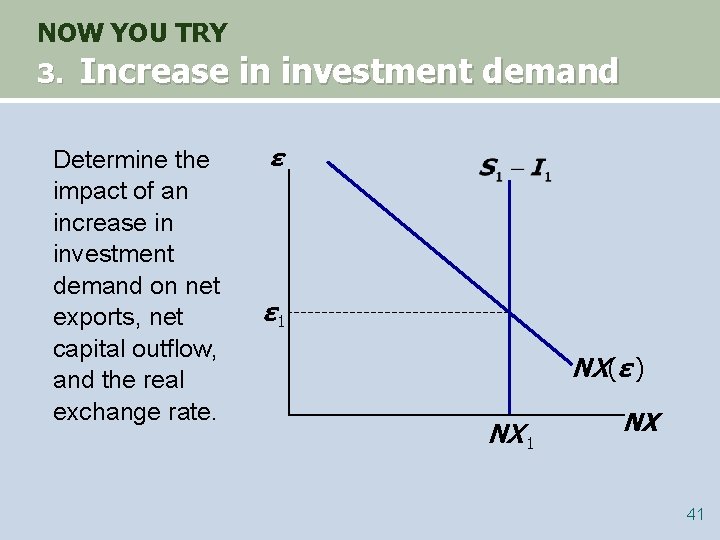
NOW YOU TRY 3. Increase in investment demand Determine the impact of an increase in investment demand on net exports, net capital outflow, and the real exchange rate. ε ε 1 NX(ε ) NX 1 NX 41
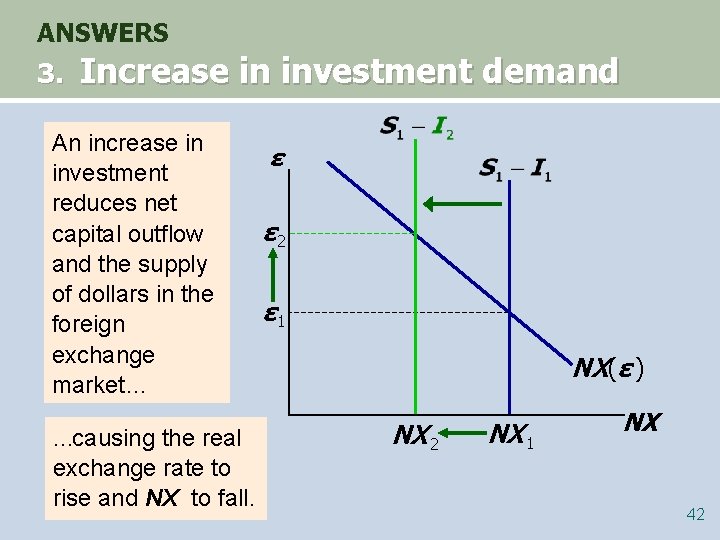
ANSWERS 3. Increase in investment demand An increase in investment reduces net capital outflow and the supply of dollars in the foreign exchange market… …causing the real exchange rate to rise and NX to fall. ε ε 2 ε 1 NX(ε ) NX 2 NX 1 NX 42
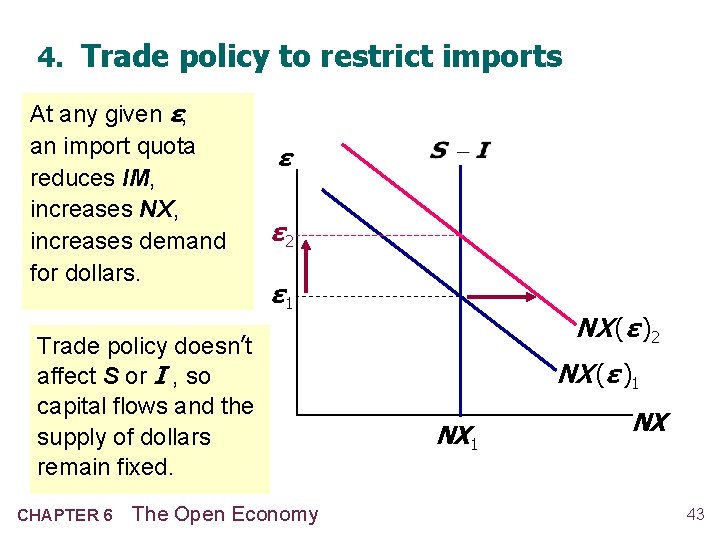
4. Trade policy to restrict imports At any given ε, an import quota reduces IM, increases NX, increases demand for dollars. ε ε 2 ε 1 Trade policy doesn’t affect S or I , so capital flows and the supply of dollars remain fixed. CHAPTER 6 The Open Economy NX (ε )2 NX (ε )1 NX 43
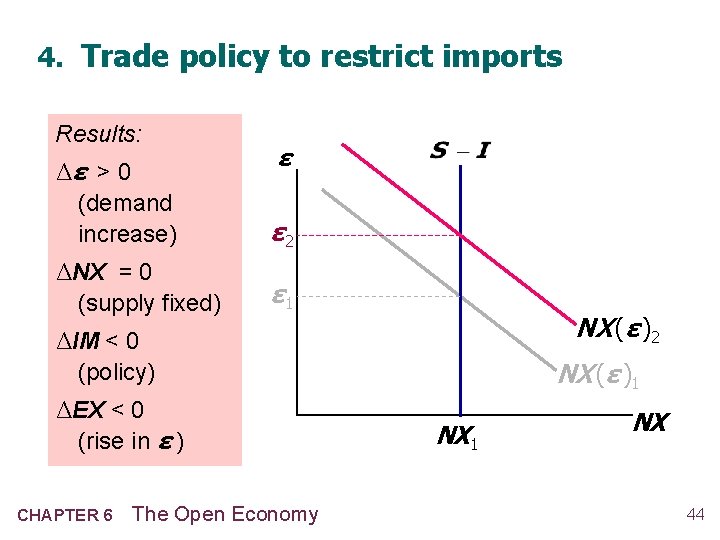
4. Trade policy to restrict imports Results: Δε > 0 (demand increase) ΔNX = 0 (supply fixed) ε ε 2 ε 1 NX (ε )2 ΔIM < 0 NX (ε )1 (policy) ΔEX < 0 (rise in ε ) CHAPTER 6 The Open Economy NX 1 NX 44
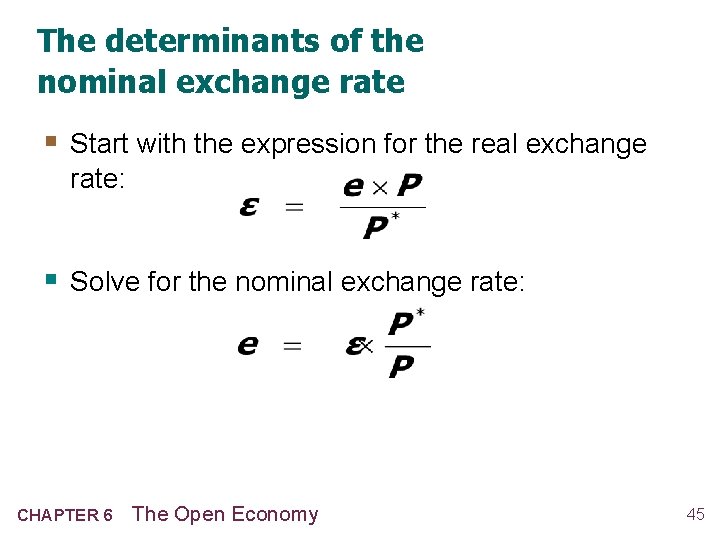
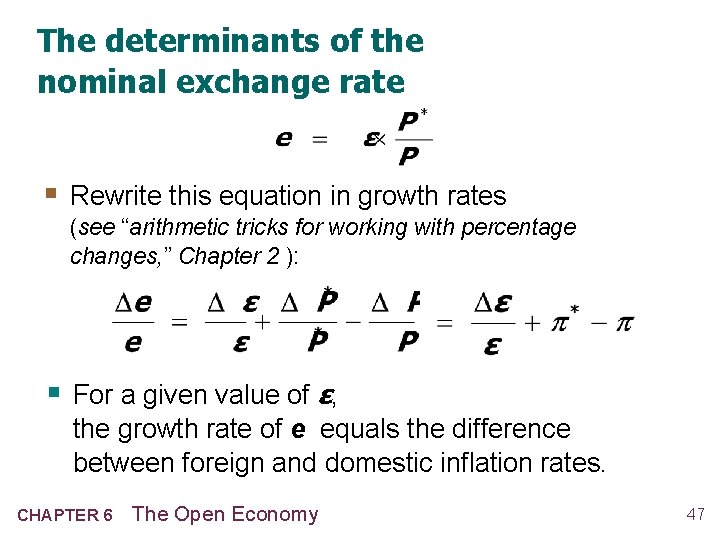
The determinants of the nominal exchange rate § Start with the expression for the real exchange rate: § Solve for the nominal exchange rate: CHAPTER 6 The Open Economy 45
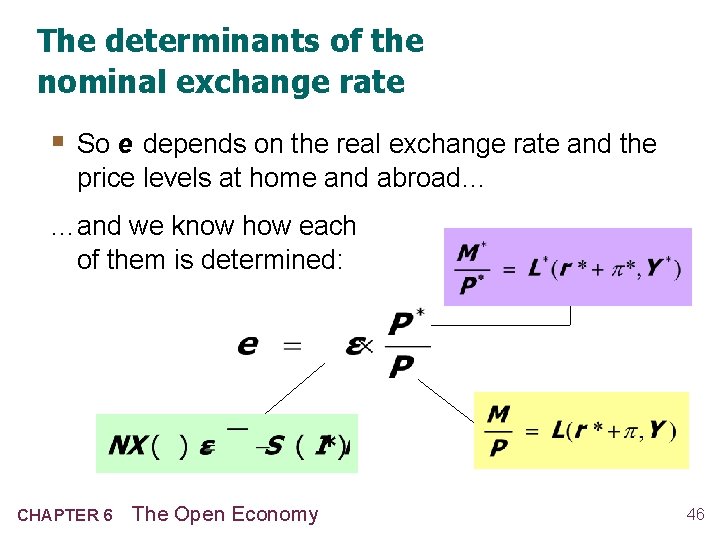
The determinants of the nominal exchange rate § So e depends on the real exchange rate and the price levels at home and abroad… …and we know how each of them is determined: CHAPTER 6 The Open Economy 46
The determinants of the nominal exchange rate § Rewrite this equation in growth rates (see “arithmetic tricks for working with percentage changes, ” Chapter 2 ): § For a given value of ε, the growth rate of e equals the difference between foreign and domestic inflation rates. CHAPTER 6 The Open Economy 47
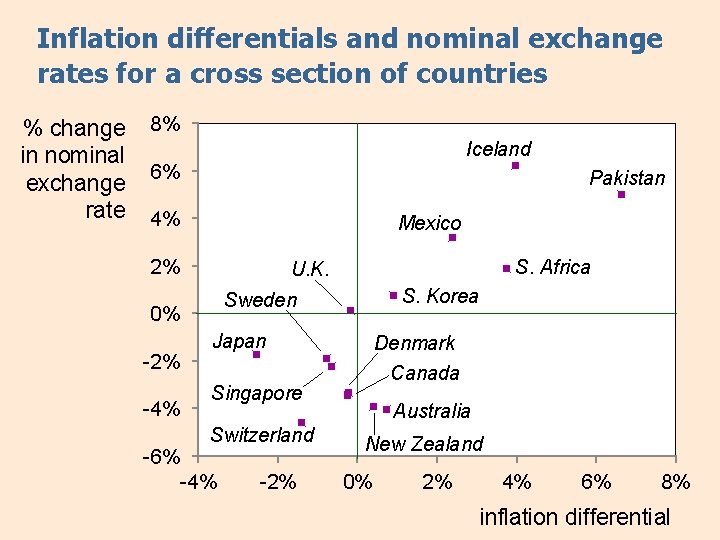
Inflation differentials and nominal exchange rates for a cross section of countries % change in nominal exchange rate 8% Iceland 6% Pakistan 4% Mexico 2% -4% S. Korea Sweden 0% -2% S. Africa U. K. Japan Denmark Canada Singapore Switzerland -6% -4% -2% Australia New Zealand 0% 2% 4% 6% 8% inflation differential
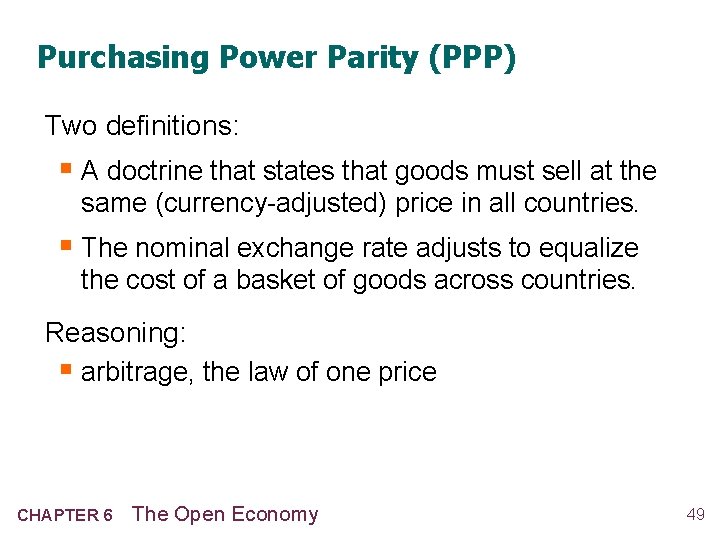
Purchasing Power Parity (PPP) Two definitions: § A doctrine that states that goods must sell at the same (currency-adjusted) price in all countries. § The nominal exchange rate adjusts to equalize the cost of a basket of goods across countries. Reasoning: § arbitrage, the law of one price CHAPTER 6 The Open Economy 49
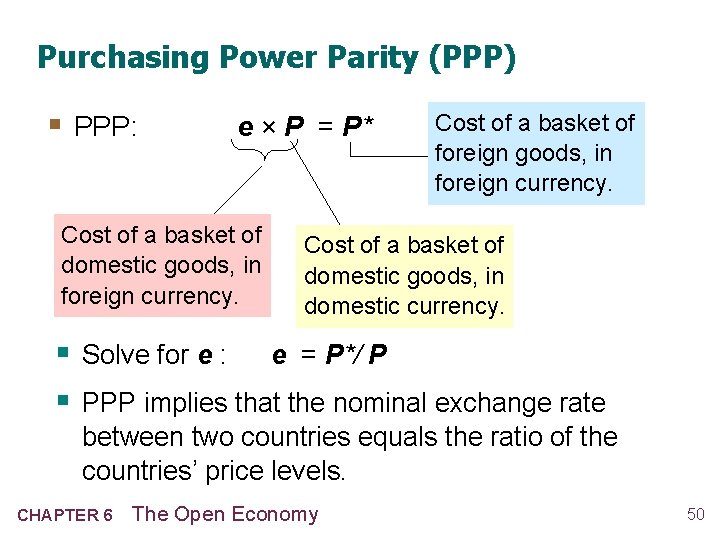
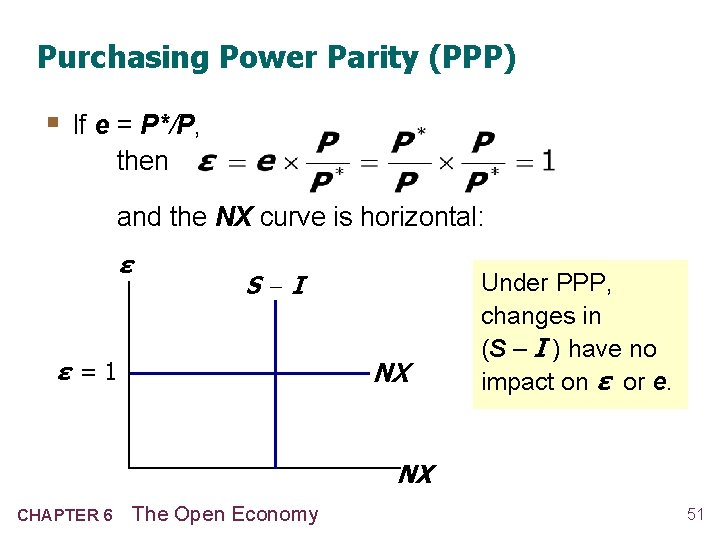
Purchasing Power Parity (PPP) § PPP: e × P = P* Cost of a basket of domestic goods, in foreign currency. Cost of a basket of foreign goods, in foreign currency. Cost of a basket of domestic goods, in domestic currency. § Solve for e : e = P*/ P § PPP implies that the nominal exchange rate between two countries equals the ratio of the countries’ price levels. CHAPTER 6 The Open Economy 50
Purchasing Power Parity (PPP) § If e = P*/P, then and the NX curve is horizontal: ε S -I ε =1 NX Under PPP, changes in (S – I ) have no impact on ε or e. NX CHAPTER 6 The Open Economy 51
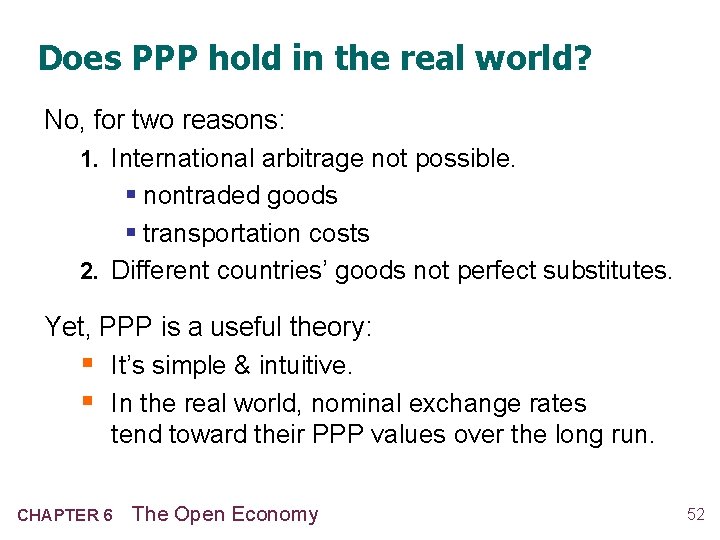
Does PPP hold in the real world? No, for two reasons: 1. International arbitrage not possible. § nontraded goods § transportation costs 2. Different countries’ goods not perfect substitutes. Yet, PPP is a useful theory: § It’s simple & intuitive. § In the real world, nominal exchange rates tend toward their PPP values over the long run. CHAPTER 6 The Open Economy 52
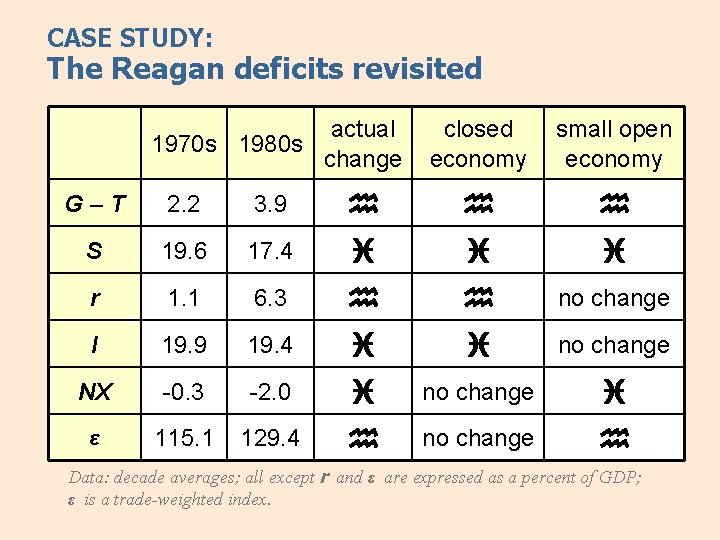
CASE STUDY: The Reagan deficits revisited actual 1970 s 1980 s change closed economy small open economy G–T 2. 2 3. 9 h h h S 19. 6 17. 4 i i i r 1. 1 6. 3 h h no change I 19. 9 19. 4 i i no change NX -0. 3 -2. 0 i no change i ε 115. 1 129. 4 h no change h Data: decade averages; all except r and ε are expressed as a percent of GDP; ε is a trade-weighted index.
The U. S. as a large open economy § So far, we’ve learned long-run models for two extreme cases: § closed economy (chap. 3) § small open economy (chap. 5) § A large open economy – like the U. S. – falls between these two extremes. § The results from large open economy analysis are a mixture of the results for the closed & small open economy cases. § For example… CHAPTER 6 The Open Economy 54
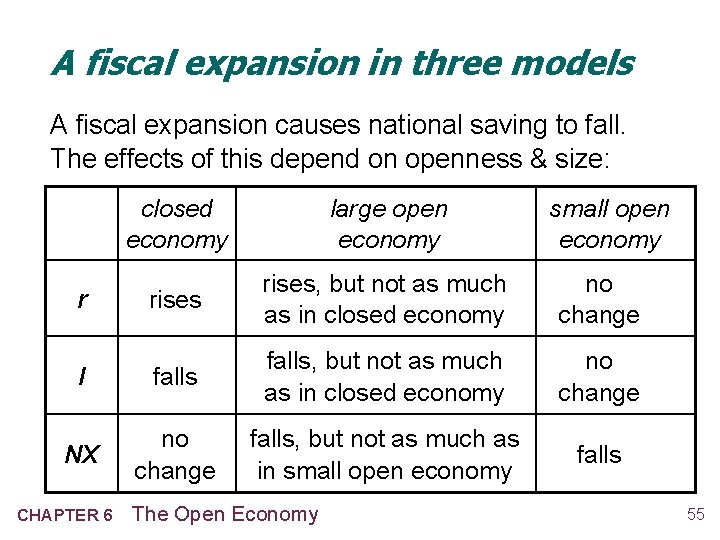
A fiscal expansion in three models A fiscal expansion causes national saving to fall. The effects of this depend on openness & size: closed economy large open economy rises, but not as much as in closed economy no change I falls, but not as much as in closed economy no change NX no change falls, but not as much as in small open economy falls r CHAPTER 6 The Open Economy small open economy 55
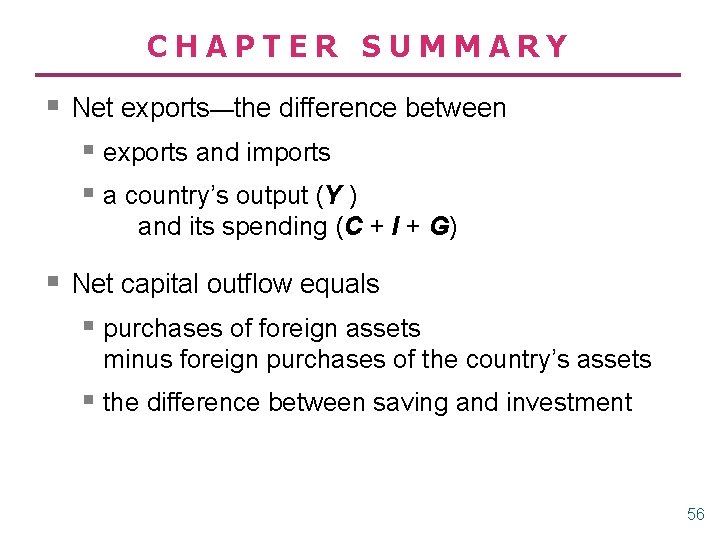
CHAPTER SUMMARY § Net exports—the difference between § exports and imports § a country’s output (Y ) and its spending (C + I + G) § Net capital outflow equals § purchases of foreign assets minus foreign purchases of the country’s assets § the difference between saving and investment 56
CHAPTER SUMMARY § National income accounts identities § Y = C + I + G + NX § trade balance NX = S – I net capital outflow § Impact of policies on NX § NX increases if policy causes S § to rise or I to fall NX does not change if policy affects neither S nor I. Example: trade policy 57
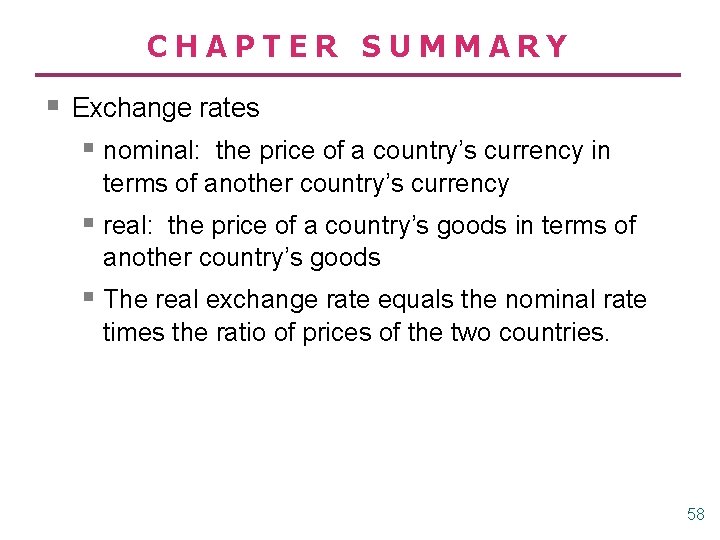
CHAPTER SUMMARY § Exchange rates § nominal: the price of a country’s currency in terms of another country’s currency § real: the price of a country’s goods in terms of another country’s goods § The real exchange rate equals the nominal rate times the ratio of prices of the two countries. 58
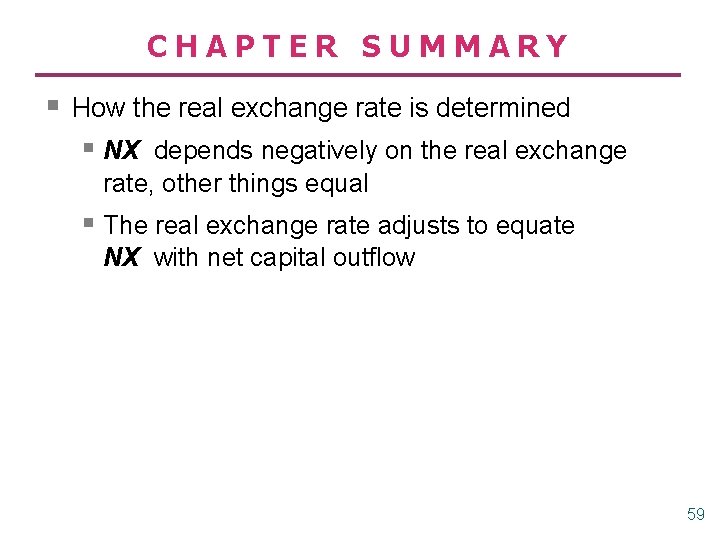
CHAPTER SUMMARY § How the real exchange rate is determined § NX depends negatively on the real exchange rate, other things equal § The real exchange rate adjusts to equate NX with net capital outflow 59
CHAPTER SUMMARY § How the nominal exchange rate is determined § e equals the real exchange rate times the country’s price level relative to the foreign price level. § For a given value of the real exchange rate, the percentage change in the nominal exchange rate equals the difference between the foreign & domestic inflation rates. 60