6 Nov 8 Nov 2019 BRASILIA Daniel Pimienta

6 Nov. - 8 Nov. , 2019 BRASILIA

Daniel Pimienta pimienta@funredes. org Observatory of languages & cultures in the Internet http: //funredes. org/lc Executive Committee Member

The measure of linguistic diversity in cyberspace: aytte The state of the art but watch the biases!

LINGUISTIC DIVERSITY MEASUREMENT PARADOX INTEREST VOID TODAY HISTORY LOP…………… FUNREDES/UL/MAAYA. . . . ………. . W 3 TECH…… IDESCAT……… GLOBALREACH………………. . ALIS/ISOC………. . OCLC FUNREDES…………………. . XEROX…………. . 1997 98 99 IWS……………… 2000 01 02 03 04 05 06 07 08 09 2010 11 12 13 14 15 16 17 18 19 CAPACITY

LINGUISTIC DIVERSITY MEASUREMENT HISTORY If you are interested with the subject consult this 2009 publication : https: //unesdoc. unesco. org/ark: /48223/pf 0000187016 (also available in French)

LINGUISTIC DIVERSITY MEASUREMENT HISTORY Very few players. A history marked by a steady trend on exaggerated overestimation of the space of English in the Net supported by strongly biased studies. Some well marketed studies estimated the percentage of English Webpages at a steady 80% between 1998 and 2007… While other studies showed a decline from 80% to 45% in the same period. The last figures were confirmed in the following years.

LINGUISTIC DIVERSITY MEASUREMENT VOID After 2007 most players faded away and left a terrible void: ØThe most promising Language Observatory Project rooted in Nagaoka University of Technology leading a large University partnership did not survive the 2011 tsunami. ØFUNREDES/UL/MAAYA observatory method got obsolete in 2007 due to the evolution of search engines. The Observatory tried to launch, with the support of Union Latine, UNESCO and OIF, a strong European Union Research project with a partnership composed of prestigious research organizations but failed twice to be funded (see DILINET project http: //funredes. org/lc/dilinet/fr/). . ØGlobal Reach (http: //global-reach. biz/globstats/index. php 3) ceased to exist in 2008.

THE TODAY STATE OF THE ART THE VOID WAS PROGRESSIVELY FILLED BY: ØINTERNETWORLDSTATS (10 languages with the higher number of Internauts) since 2004 ØW 3 TECHS (contents by language) since 2010 and recently by the return of: ØFUN/LC Observatory (large set of indicators for languages over 5 millions L 1 speakers) since 2017

THE 3 EXISTING OPTIONS 1. Presentation of the 3 options 2. Comparison of the 3 options 3. Analysis of respective biases

• Exist since 2004 • Belongs to Mini. Watts Marketing Group • Lead by an independant Colombian professional (Enrique de Argaez) • Offers stats about the Internet in the world by country and region, in terms of Internet users & Facebook users • Impressive compilation and add-on job

• As for language, offers its computation of the 10 top languages in terms of Internet users. • Updated once a year since 2004 • Based on ITU data plus demographic data for L 1 and L 2. • Methodology relatively transparent

internetworldstats. com/stats 7. htm

internetworldstats. com/stats 7. htm World Internet TOP TEN Population Internet Users Penetration LANGUAGES for this Users Growth % of World by Language (% IN THE INTERNET Language (2000 - 2019) (Participatio Population) (2019 Estimate) n) English 1, 485, 300, 217 1, 105, 919, 154 74. 5 % 685. 7 % 25. 2 % Chinese 1, 457, 821, 239 863, 230, 794 59. 2 % 2, 572. 3 % 19. 3 % Spanish 520, 777, 464 344, 448, 932 66. 1 % 1, 425. 8 % 7. 9 % Arabic 444, 016, 517 226, 595, 470 51. 0 % 8, 917. 3 % 5. 2 % Portuguese 289, 923, 583 171, 583, 004 59. 2 % 2, 164. 8 % 3. 9 % Indonesian / Malaysian 302, 430, 273 169, 685, 798 56. 1 % 2, 861. 4 % 3. 9 % French 422, 308, 112 144, 695, 288 34. 3 % 1, 106. 0 % 3. 3 % Japanese 126, 854, 745 118, 626, 672 93. 5 % 152. 0 % 2. 7 % Russian 143, 895, 551 109, 552, 842 76. 1 % 3, 434. 0 % 2. 5 % German 97, 025, 201 92, 304, 792 95. 1 % 235. 4 % 2. 1 % 5, 193, 327, 701 3, 346, 642, 747 64. 4 % 1, 123. 0 % 76. 3 % 2, 522, 895, 508 1, 039, 842, 794 41. 2 % 1, 090. 4 % 23. 7 % 7, 716, 223, 209 4, 386, 485, 541 56. 8 % 1, 115. 1 % 100. 0 % TOP 10 LANGUAGES Rest of the Languages WORLD TOTAL

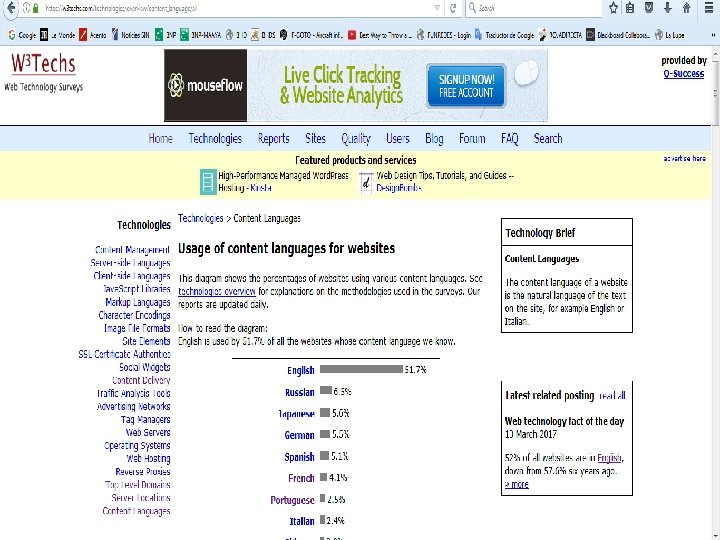
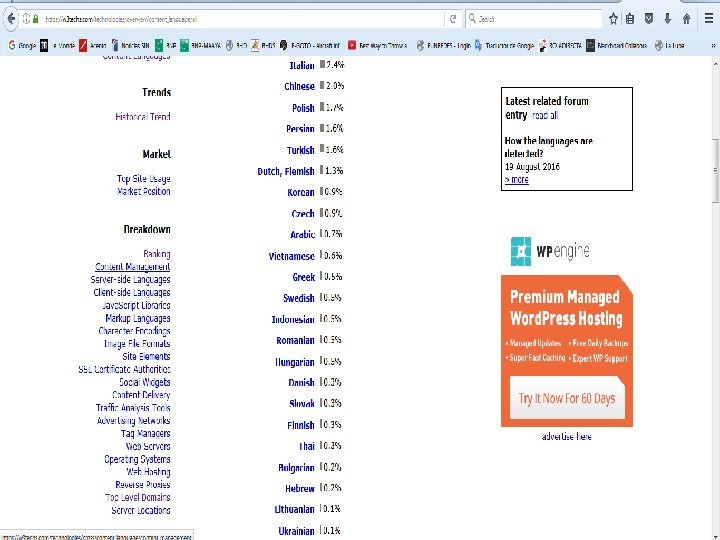
• Exist since 2009 • Belongs to Q-Success Software Quality Management Consulting • W 3 Techs provides information about the usage of various types of technologies on the web (CMS, languages in different contexts, OS, traffic tools, TLD…) – 23 indicators. • Extremely useful service with daily update

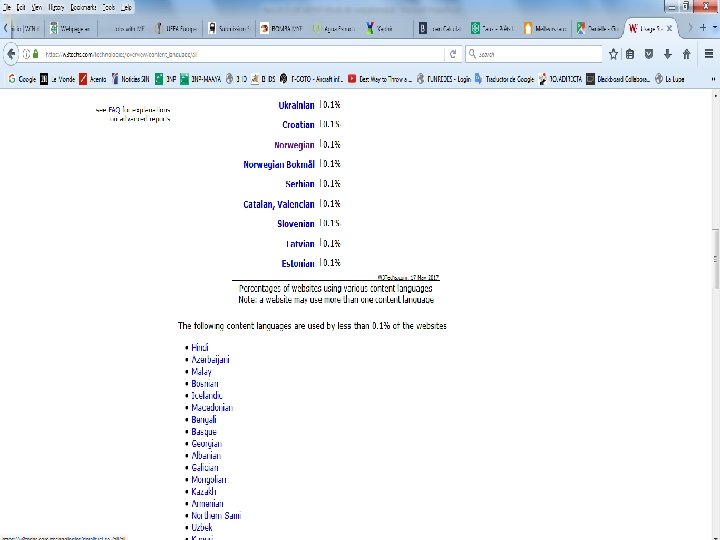
• The set of indicators includes “Usage of content languages for websites” • Updated daily • Based on the application of a language recognition algorithm on the home page of the 10 millions websites listed by Alexa. com as the most visited. • Relatively transparent with its methodology (but not so Alexa. com!).
 Lead")
• • • Exist since 1988 Belonged to FUNREDES (NGO now terminated) Lead and now maintained by Daniel Pimienta Partnered with Union Latine and later MAAYA Received support from OIF, Union Latine, UNESCO, DGLFF

• Between 1988 and 2007 offered a series of measurements of the place on the Web of Latin languages, English and German. • Between 2007 and 2015, realized specific studies for French and Spanish and tried to launch an ambitious research project (DILINET). • A historical player in the field of language measurement which retakes its measurement with new methodology in 2017.

THE FUN/LC NEW CONCEPT Ø Use as much and as varied as possible data figures from the Internet to approximate the space of languages. Ø Try to reach a large scope of applications and spaces of the Internet. Credit to Daniel Prado for the idea

THE FUN/LC NEW CONCEPT Ø Complete scarce linguistic figures by more easy to find country figures. Ø Transform country figures into languages figures. Credit to Daniel Prado for the idea

THE FUN/LC NEW CONCEPT Ø Use simple statistics tricks to derive meaningful indicators. Ø Pay careful attention to all possible biases.

RESULTS STAND ON TRIPOD DATA RESULTS STATS GRINDER • Internet data per language or country • Heavy work • Permanent watch • Time consuming LARGE SET OF MICRO-INDICATORS I T U • % of persons connected per country • Updated each year • Quite reliable • Most sensitive data • Free • Relatively fast changes • L 1 Language speakers per country • Ethnologue or Yoshua • Expensive • Generally slow changes DEMOLINGUISTIC DATA

THE FUN/LC PRODUCTS • Set of indicators for the 140 languages of more than 5 millions L 1 speakers. • Sorting by macro-indicator

6 indicators 369 micro-indicators 4 MACRO-INDICATORS 1 % Internauts 13 % CAPACITY Contents 11 % % Usages 316 % POWER Trafic 23 GRADIENT % Interfaces 5 % Indexes PRODUCTIVITY
 GRADIENT (of connected speakers) CAPACITY (of")
MACRO-INDICATORS RELATION POWER (of language in the Net) GRADIENT (of connected speakers) CAPACITY (of speakers)
 = capacity of this language")
MACRO-INDICATORS RELATION • Power of a given language (%) = capacity of this language in the Internet x % world population of speakers • Power of a given language (%) = gradient of this language in the Internet x % world connected population of speakers

WHAT IS MEASURED BY MACRO-INDICATORS? CAPACITY measures the vitality in the Internet of the language speakers. independently of their numbers. CAPACITY % POWER measures the percentage of global presence of the Language in the Internet, directly linked to its number of speakers. GRADIENT measures the vitality in the Internet of the connected speakers of each language, independently of their numbers. PRODUCTIVITY is related to content production and is also independent of the number of speakers. POWER GRADIENT PRODUCTIVITY

TOP LANGUAGES IN THE INTERNET: FUN/LC BIAS CORRECTED FIGURE 2017 LANGUAGE English TOP 2 Chinese Spanish CHALLENGERS French German SOLID Russian Portuguese Japanese IMPORTANT Arabic Hindi Malay Polish Korean NOTABLE Bengali Italian Urdu REMAINING TOTAL INTERNAUTS CONTENTS PROD. 22. 2% 30. 0% 1. 35 20. 5% 18. 0% 0. 88 9. 1% 8. 0% 0. 88 5. 6% 6. 5% 1. 17 3. 1% 3. 8% 1. 21 5. 0% 3. 5% 0. 71 4. 0% 3. 5% 0. 88 3. 4% 3. 5% 1. 04 4. 2% 3. 0% 0. 72 3. 9% 3. 0% 0. 77 2. 6% 2. 5% 0. 96 1. 7% 1. 8% 1. 09 1. 4% 1. 01 1. 5% 1. 3% 0. 86 0. 9% 1. 1% 1. 22 0. 8% 0. 7% 0. 84 35. 3% 125. 0% 33. 4% 125. 0% 0. 95 C O N T E N T
 English Chinese Spanish French Russian German Portuguese Japanese Arabic Hindi Malay Italian")
TRENDS (POWER) English Chinese Spanish French Russian German Portuguese Japanese Arabic Hindi Malay Italian Korean Polish Urdu Remaining 2017 38. 98% 14. 10% 9. 07% 7. 47% 4. 71% 4. 55% 3. 80% 3. 48% 3. 22% 2. 60% 2. 06% 1. 56% 1. 21% 1. 18% 1. 14% 2019 38. 01% 13. 99% 9. 18% 7. 10% 4. 69% 4. 33% 3. 88% 3. 29% 3. 47% 2. 98% 2. 26% 1. 48% 1. 19% 1. 25% 25. 86% 26. 72% CHANGE -2, 50% -0, 75% 1, 16% -4, 95% -0, 47% -4, 96% 2, 16% -5, 43% 7, 62% 14, 57% 9, 95% -4, 74% -2. 63% 0, 45% 9, 60% STRENGTH 3, 33% ** *** ** ***** ****

THE TOP 15 IN CAPACITY Hebrew Finnish Dutch Swedish English German Danish Italian Czech French Hungarian Serbo-Croatian Polish Japanese Greek 2017 2019 5, 40 5, 39 4, 81 4, 45 3, 72 3, 40 3, 30 3, 16 3, 13 2, 96 2, 83 2, 64 2, 53 2, 40 5, 35 5, 14 4, 67 4, 39 3, 63 3, 23 3, 15 3, 01 2, 96 2, 81 2, 78 2, 76 2, 65 2, 40 2, 30 Minor changes Most always negative Due to the lack of update of the 2 other legs of micro-indicators

THE TOP 15 IN GRADIENT Hebrew Finnish Dutch Italian Swedish English Serbo-Croatian German Czech Hungarian French Polish Greek Danish Armenian 2017 2019 2, 62 2, 72 2, 16 2, 40 1, 93 2, 06 1, 73 1, 91 1, 82 1, 87 1, 76 1, 86 1, 54 1, 59 1, 45 1, 57 1, 42 1, 53 1, 47 1, 50 1, 35 1, 44 1, 42 1, 30 1, 36 1, 27 1, 33 1, 21 Minor changes Most always positive Due to the lack of update of the 2 other legs of micro-indicators

RAW COMPARISON OF THE 3 OPTIONS SCOPE UPDATE TYPE OF ORG. 10 TOP USER’s LANGUAGE % DAILY SMALL 2004 MKTING MEDIUM LOW TO INDIRECT LOW W 3 T WEB CONTENT YEARLY LARGE 2010 MKTING LIGHT MEDIUM LOW FUN LC SMALL NGO VERY HEAVY TOTAL IWS % % WEB CONTENT % USERS 150 top L 1 language TRYING YEARLY (*) ACT. SIZE OF SINCE WORK 1998 METH. TRANSP. (*) External budget extremely dependant for a heavy/costly effort BIAS ANALYSIS HIGH

WATCH THE BIASES!!!! the data nicely provided by those sources is used by many people without a careful look at the BIASES !!!!

and the BIASES need to be understood if you plan to derive serious conclusions from the data…

And, by the way, most of those BIASES ARE NOT NEUTRAL they provoke an overestimation of the place of in the Net.

ONE OF THE GOAL OF THIS PRESENTATION Ø IS TO WARN YOU ABOUT THOSE SERIOUS BIASES

ARE BIASES DEEPLY ROOTED ON THE SUBJECT OF LANGUAGES ON THE INTERNET? But why so then? ? ? ? ? ? ?

LANGUAGES Demo-linguistic data No consensus Fuzzy boundaries Huge domain L 1? L 2? Li? THE INTERNET Marketing took over Infiniteness of the web Search engine vs. Ad engine CHOC OF BIASES

BIASES TAXONOMY ØSources bias ØMethodological bias ØStatistical bias ØHypothesis bias

SOURCE BIAS: “good practice” example ITU provides the most important data on Internet penetration : the percentage of individuals using the Internet per country. ITU provides with the data a precise definition of the collecting process and the associated assumptions. http: //www. itu. int/en/ITU-D/Statistics/Documents/statistics/2016/Individuals_Internet_2000 -2015. xls

ITU DATA • Method: country survey • Definition: individuals from 16 to 75 years old having connected to the Internet from any type of device on fixed or mobile network at least once in the last 3 months. • Analysis: 60% of data is given by ITU. 15% given by Eurostat with same criteria. the rest given by country authorities often with different criteria (on age especially).

ITU DATA • Best practice indeed yet bias-free data does not exist. • Careful screening shows that figures do not correspond to the same year (no big deal!) • Some data from countries willing to promote there “digital divide efficient policies” are probably exaggerated… • Careful with country definitions!
 steady")
STATISTICAL BIAS: extremely influent… and terrible example From 1999 to 2007, the (wrong) steady figure of 80% of webpage's in English was propagated in media from an OCLC study with 2 publications, in 1999 and 2003, using the same methodology than a pioneer study from ALIS Technology, a Canadian company. with ISOC support in 1997. The fact that it was anyway totally flawed did not prevent to make it the truth for medias during 10 years!!!

OCLC WEB CHARACTERIZATION METHODOLOGY: • Random selection of 3000 IP numbers leading to webpages. • Application of language recognition algorithm • Publication of results. • Where was the major flaw?

ONE SHOT VS. STATISTICAL DISTRIBUTION
 published in 2000 its study,")
STATISTICAL BIAS: gross example INKTOMI (a former search engine) published in 2000 its study, with absolutely no methodology revealed… but strong marketing, with a figure of 86. 5% of Webpages in English.
 GROSS FLAW LANGUAGE PROPORTION (%) English 86. 54 German 5.")
STATISTICAL BIAS: INKTOMI (2000) GROSS FLAW LANGUAGE PROPORTION (%) English 86. 54 German 5. 83 French 2. 36 Italian 1. 55 Spanish 1. 23 Portuguese 0. 75 Dutch 0. 54 Finnish 0. 50 Swedish 0. 36 Japanese 0. 34 100%

W 3 TECHS: WHERE ARE THE BIASES? METHODOLOGY: On a daily basis W 3 Techs applies an algorithm of language recognition on the home page of the 10 millions of sites classified by ALEXA as the most visited in the world and compute results by language.

W 3 TECHS BIASES? BIAS TYPE COMMENTS STRENGTH SELECTION Hypothesis Qualitative bias towards more visited sites HIGH for some languages NUMBER OF SITES Statistical Quantitative bias 10/500 = 2% High HOME PAGE Method Many home pages include English parts English overestimation > 30% MULTILINGUALISM Method Not paying attention to multilingualism Favor English > 25% DATA Statistical Figures are given with only Low… but invalid one digit after coma computations ALGORITHM Method Detection error 10% in favor of English ALEXA BIAS Source Bias against most Asian languages Huge
= % content (L)")
W 3 TECHS: A COHERENCE CONTROL The content productivity indicator P(L)= % content (L) / % internauts (L) Experience has shown that this indicator hardly gets out of the windows 0. 5 – 1. 5 showing some understandable statistical law between the number of internauts and the amount of contents.

W 3 TECHS: A COHERENCE CONTROL Data from previous FUNREDES/UNION LATINE studies (2005 & 2008) and data from W 3 Techs (2017) combined from internauts data derived from ITU French English 2005 1. 14 2008 0. 87 2017 0. 71 Spanish Portuguese German 1. 57 1. 42 2. 34 Hardly credible… 0. 66 0. 43 0. 55 0. 34 0. 62 1. 06 1. 16 1. 72 Italian Rumanian Catalan 0. 81 0. 98 2. 41 0. 70 0. 66 0. 92 0. 74 0. 44
 combined from")
W 3 TECHS: A COHERENCE CONTROL Data from W 3 Techs (2017) combined from country internauts data derived from ITU and transformed into language’s data by simple arithmetic weighting. Russian 2017 1. 27 Too high Too low Japanese Polish Hebrew 1. 60 2. 0 1. 65 Hungarian Swedish 1. 59 2. 2 Turkish Ukrainian Czech 1. 58 0. 17 3. 22
")
W 3 TECHS: A COHERENCE CONTROL FROM DATA Data from W 3 Techs (2017) combined from country internauts data derived from ITU and transformed into language’s data by simple arithmetic weighting. Chinese 2017 Hindi Arabic Malay Urdu 0. 09 0. 02 0. 19 0. 23 0. 05 Way too low!!! Too low Bengali 0. 07 Korean 0. 57 Vietnamese 0. 45 Thai 0. 36

China + India represent together more than 1 billion persons connected to the Internet in 2016, says close to 1 over 3 Internauts… Would you believe they have less than 7% of the world content? ? For some reason W 3 Tech is incapable to reflect the reality of Asian languages in the Internet… Is that related to Alexa? ?

AS FOR CHINA ONE REASON HAS TO DO WITH THE FACT THAT ONLY 20% OF CHINESE DOMAINS ARE IN ICANN DNS ROOT!!!! THIS MEANS AN UNDERESTIMATION BY W 3 TECH IN A FACTOR 5!!!

ALEXA: WHERE IS THE BIAS? AND HOW IT AFFECTS W 3 Techs ALEXA OFFERS MARKETING DATA TO WEBSITE OWNERS. ALEXA. COM measure traffic to websites thanks to a banner Non transparent about the proceeding of the banner per country or per language. They only claim to have “millions of banners installed”. Wikipedia reported 10 millions in 2005.

ALEXA SUSPECTED BIAS • TELL ME THE BANNER REPARTITION BY COUNTRY I’LL TELL YOU WHERE IS THE BIAS • A PRIORI ONE CAN EXPECT A PROOCCIDENTAL BIAS AND PROBABLY ALSO PROENGLISH HOW TO CONTROL IT IN A CONTEXT OF ZERO TRANSPARENCY?

ALEXA BIAS Comparison of Alexa traffic data with subscribers data for: Facebook, Twitter and Linkedin. The data is transformed from a per country based into a per language based using weighting with language repartition in countries.

RATIO WORLD % OF TRAFFIC / WORLD % OF SUBSCRIBERS French English Thai Catalan Japanese Norwegian Swedish Danish Greek German Polish Hungarian Russian Czech Dutch Italian FACEBOOK TWITTER LINKEDIN AVERAGE 2, 81 4, 40 2, 49 3, 23 3, 11 2, 65 1, 63 2, 46 2, 35 1, 23 2, 38 1, 99 1, 69 1, 82 2, 25 1, 92 1, 41 1, 65 2, 33 1, 79 3, 57 1, 46 0, 22 1, 75 2, 36 2, 07 0, 74 1, 72 3, 18 0, 34 1, 22 1, 58 2, 42 1, 48 0, 45 1, 19 1, 57 1, 33 1, 36 2, 14 0, 75 0, 85 1, 25 1, 59 0, 35 0, 97 0, 68 0, 48 1, 33 0, 83 1, 76 0, 32 0, 39 0, 82 1, 54 0, 34 0, 59 0, 82 0, 85 1, 17 0, 41 0, 81

RATIO WORLD % OF TRAFFIC / WORLD % OF SUBSCRIBERS FACEBOOK TWITTER LINKEDIN AVERAGE Korean 0, 63 0, 81 0, 95 0, 80 Urdu 0, 41 0, 44 1, 46 0, 77 Rumanian 1, 21 0, 43 0, 51 0, 72 Spanish 0, 80 0, 72 0, 62 0, 71 Turkish 0, 28 0, 88 0, 52 0, 56 Arabic 0, 51 0, 48 0, 57 0, 52 Lahnda 0, 52 0, 28 0, 67 0, 49 Tamil 0, 20 0, 18 0, 99 0, 46 Marathi 0, 16 0, 14 1, 00 0, 43 Kannada 0, 15 0, 13 0, 96 0, 41 Chinese 0, 55 0, 23 0, 44 0, 41 Bengali 0, 27 0, 25 0, 68 0, 40 Hindi 0, 21 0, 19 0, 74 0, 38 Portuguese 0, 33 0, 19 0, 27 0, 26 Cebuano 0, 10 0, 12 0, 57 0, 26 Javanese 0, 07 0, 05 0, 30 0, 14 Sudanese 0, 07 0, 05 0, 29 0, 14

ALEXA BIAS The pro-occidental bias appears clearly in the test although with some exceptions (Portuguese? ) which call for further studies…

COMPARING W 3 Techs vs. FUN/LC LANGUAGE FUN/LC W 3 Techs GAP English Chinese Spanish French German Rusian Portuguese Japanese Arabic Hindi Malay Polish Korean Bengali Italian Urdu REMAINING TOTAL 30. 0% 18. 0% 6. 5% 3. 8% 3. 5% 3. 0% 2. 5% 1. 8% 1. 4% 1. 3% 1. 1% 0. 7% 33. 4% 125. 0% 52. 8% 1. 9% 4. 0% 5. 5% 6. 4% 2. 5% 5. 5% 0. 08% < 0. 01% 0. 5% 1. 7% 0. 08% < 0. 01% 2. 2% < 0. 01% 10. 5% 100% 1. 8 9. 5 1. 6 1, 5 1, 8 1. 4 1. 6 38 > 300 5 1. 1 17. 5 > 130 2 > 70 3. 2 FUN/LC > W 3 Techs FUN/LC < W 3 Techs

FUN/LC BIASES • FIGURES ON : Ø% INTERNET CONNECTED PEOPLE PER LANGUAGE Ø% WEBPAGES IN THE WEB PER LANGUAGE • KEY METHOD TRICKS : ØTRANSFORM COUNTRY FIGURES INTO LANGUAGE FIGURES BY WEIGHTING WITH ITU INTERNET PENETRATION BY COUNTRY ØEXTRAPOLE L 2 RESULTS FROM THE L 1+L 2/L 1 RATIO

FUN/LC BIASES • IMPLICIT HYPOTHESIS : ØTHE INTERNET CONNECTION RATE IN EACH COUNTRY IN THE SAME FOR ALL LANGUAGES SPOKEN IN THE COUNTRY. ØTHE COMPUTED GLOBAL INTERNET CONNECTION RATE FOR L 1 SPEAKERS IS THE SAME FOR L 2 SPEAKERS FOR EACH LANGUAGE

FUN/LC BIASES • EXPLICIT HYPOTHESIS : ØUSE OF ALEXA IN A SELECTION OF SITES TO MEASURE TRAFFIC (WITH TRUNCATED MEAN TO TRY TO REDUCE BIAS) ØEXTRAPOLATE MISSING DATA IN SOURCES BY WEIGHTING WITH ITU DATA or BY QUARTILE METHOD

FUN/LC BIASES • MAIN SOURCES : Ø 1 st KEY SOURCE ITU DATA. Ø 2 nd KEY SOURCE YOSHUA DATA (vs. Ethnologue) Ø ALEXA FOR TRAFFIC DATA Ø WIKIMEDIA FOR CONTENT DATA

WEIGHTING LANGUAGES WITHIN COUNTRY If Russia has, following ITU, 70% of residents connected to the Internet, then we will apply this value to all speakers in Russia whatever their languages. If there are Russian speakers in other countries they will be computed with the corresponding country’s percentage. Then there is: 78. 7 M Internauts Russian speakers as L 1 in Russia (112 , 3 M x 70%) + 81530 in Brazil (138000 x 53, 08%) + 0. 65 M in the USA (867000 x 74. 5%) + and so on… = 89. 2 M in the world. In other word: the number of Internauts with Russian as L 1 is the sum of Russian L 1 speakers by country weighted by there respective country Internaut’s rate…
 = ∑ SP (i, j) x PC(j) j=1")
The equation is: j=P SC (i) = ∑ SP (i, j) x PC(j) j=1 Where: SC(i) = % of speakers of language i connected SP(i, j) = Number of speakers of i in country j PC (j) = % of persons connected in country j P = Number of countries processed

For whoever hates mathematics… relax with weighting!! The same as when you were a student and computed your notes!!! Coefficient Mathematics 4 English 2 Biology 1 History 3 TOTAL 10 Note /10 3 8 5 6 Weighted note 12 16 5 18 51 5. 1/10

BIASES 1: WEIGHTING LANGUAGES WITHIN COUNTRY Is there a methodological bias? Yes indeed! It is in the assumption that the % of connected persons within a country is independent of the mother tongue. This is probably wrong: social, economic and cultural elements will, depending on the language, trigger variation above or below the average country %. But it is an acceptable bias for the purpose of the computation if: 1) We do not pretend comparing languages within the country 2) Select a set of languages with millions of speakers…

BIASES 2: PROCESSING L 1+L 2 the common bias You noticed my previous totals with 125% and wondered: what is all that about? ? ? Time to explain!!! In my opinion, a strong and common bias in our theme is the way L 1+L 2 is processed in percentage. If L 1+L 2 represents the sum of people having in addition of a mother tongue one (or more) second language then if you compute the percentage of people speaking a given language as L 1 or L 2, logically the sum of all those percentages for all languages of the world will go beyond 100%!!! The difference (in my figures 25%) represents the global rate of multilingualism in the world.

BIASES 2: PROCESSING L 1+L 2 the common bias And you know what? This applies also to contents as websites may be in several languages… The lack of attention to this simple fact explain many drawbacks in language figures which are hidden by the fact that only few languages are treated and the “remaining” figure are not paid careful attention. If attention were given you would discover strange negative figures for “the remaining!!!

BIASES 2: PROCESSING L 1+L 2 The assumption hidden behind the computation of % of speakers of a given language connected to the Internet by FUN/LC method is that this % is the same for L 2 as for L 1. This is obviously wrong and induce a strong bias if the L 2 for a given language are in majority in countries with low % while the majority fort L 1 are in countries with high percentage (French is a perfect example). There are simple techniques which would allow to overcome that bias but they require having some idea for the repartition of L 2 between the 2 categories…

BIAS 3: USING ALEXA FOR TRAFFIC BIAS REDUCTION : - Use of truncated mean instead of mean. - Careful selection of sites respecting diversity. yet FUN/LC raw traffic data favor occidental languages and sub estimate Asian languages…

BIAS 4: USING WIKIMEDIA FOR CONTENTS As universal as its vocation could be and as language sensitive as Wikimedia has demonstrated to be, Asian languages are in general, with some exceptions, quite under represented in those spaces. We prefer to use the average of all indicators to figure out content data rather than directly our content indicator. We definitively need to incorporate some bias reduction mechanism to correct data.

BIASES 5: OTHER MARGINAL BIASES -Are source completion methods by extrapolation or quartile unbiased? -Do we have the right figure of speakers per country? -Do we have the right number of inhabitants per country? -Does the ITU figure of this country is reliable? -Are all figures from today? In general the answer is no but This is part of normal indicator business…

IWS BIASES ØThe main bias is the concept of zero-sum to manage L 1+L 2 figures which leads to maintain a total of 100% and provoke the shrinking of the figure for remaining languages (out of the 10 top). ØL 1 and L 2 source/methods are not transparent. ØThere is a serious mistake at least for French processing.

COMPARING IWS vs. FUN/LC LANGUAGE English Chinese Spanish French German Rusian Portuguese Japanese Arabic Hindi Malay Polish Korean Bengali Italian Urdu REMAINING TOTAL FUN/LC 30. 0% 18. 0% 6. 5% 3. 8% 3. 5% 3. 0% 2. 5% 1. 8% 1. 4% 1. 3% 1. 1% 0. 7% 24. 6% 125. 0% IWS 26. 3% 20. 8% 7. 7% 2. 8% 2. 3% 2. 9% 4. 3% 3. 2% 4. 7% GAP 3. 0% 1. 20 22% 100% 1. 14 1. 16 1. 40 2. 32 1. 65 1. 21 1. 23 1. 09 1. 57 FUN/LC > IWS FUN/LC < IWS

COMPARING IWS vs. FUN/LC We are supposed to rely on the same ITU source. So L 1+ L 2 shall explain all differences However simulating FUN/LC with IWS L 1+L 2 figures and 100% reasoning (instead of 125%) still show a sub-estimation between 50% and 20% for French, Russian, German and Spanish… Why so? Multilingualism management. The simulation comparison drive a negative figure for the remaining of languages…

COMPARING IWS vs. FUN/LC In the case of French there is a clear error in IWS figures. IWS (2016) figures for French says : Total speaker population (L 1+L 2) = 394 M Percentage of Internet share for French speaking : 26% Knowing that France, Belgium, Switzerland Canada have respective figures for connection rate of 83%, 85%, 87% & 88% for a total of 115 M speakers. Then to obtain a 26% final average connection rate for 394 M speakers you will need to have the 394 -115 = 289 M of other speakers with a connection rate less than 2%: 115 x 0, 85 + 289 x CR = 394 x 0. 26 CR = ((394 x 0. 26)– (115 x 0. 85)) / 289 CR = 1. 6% which is absurd. Some Francophone African countries connection rate (2017) are : CAF: 4%, Tchad: 6%, Mali: 13%, Senegal 30%, Ivory Cost: 44%, Morocco: 62%

GENERAL CONCLUSION ON DATA Ø Not reading the data facts before taking the data pill may be harmful for your scientific health and can produce undesirable side effects (or just useless placebo effect). Ø If there is no data facts, be cautious when you treat yourself to conclusions… + =

CONCLUSION FOR FUN/LC FUTURE We badly need: Ø Promotion of results (seems UNESCO is not interested to report on it) Ø Funding (to buy Ethnologue data and to support heavy work)

OBRIGADO
- Slides: 85