6 2 Transforming and Combining Random Variables HW

6. 2 Transforming and Combining Random Variables HW: P. 378 (37, 39 -41, 43, 45, 49, 51, 57 -59, 63, 61, 65, 66)

Linear Transformations In chapter 2, we learned how linear transformations affect the shape, center, and spread of distributions of quantitative data. Similar rules apply to random variables. We look for effects on… ◦ Shape: skew, symmetrical, uniform ◦ Center: mean, median, percentiles, quartiles ◦ Spread: standard deviation, range, IQR

Linear Transformations

Example: Carnival Game Value: Probability: 0 1 2 3 0. 4 0. 2 0. 1

Example: Carnival Game

Combining Random Variables Many situations we’ll encounter in later chapters involve two or more random variables. Understanding how to describe the center and spread of the probability distribution for the sum or difference of two random variables is an important skill to have. When given two independent random variables, we can describe the mean and standard deviation of the sum or difference of the random variables using the formulas in this section.

Random Variables: Combining Means

Example: Allowances

Random Variables: Standard Deviations & Variances

Example: Allowances

Example: Homework Check Students in Mr. Costello’s classes are expected to check their homework in groups of 4 at the beginning of class each day. Students must check it as quickly as possible, one at a time. The means and standard deviations of the time it takes to check homework for the 4 students in one group are noted below Assume their times are independent. Student Hint: Add a variance column! Mean Standard deviation

Example: Homework Check Mean Standard deviation Variance

Mean Standard deviation Variance

Check your understanding p. 370 0 1 2 3 0 1 2 0. 3 0. 4 0. 2 0. 1 0. 4 0. 5 0. 1

Answers

Check your understanding p. 373 0 1 2 0. 3 0. 4 0. 2 0. 1 0. 4 0. 5 0. 1

Answers *Use bonus calculations from above.

Combining Normal Random Variables Any linear combination of independent Normal random variables is also going to be Normally distributed. We can calculate the probability of observing particular outcomes in these normal distributions using skills we learned in Chapter 2.

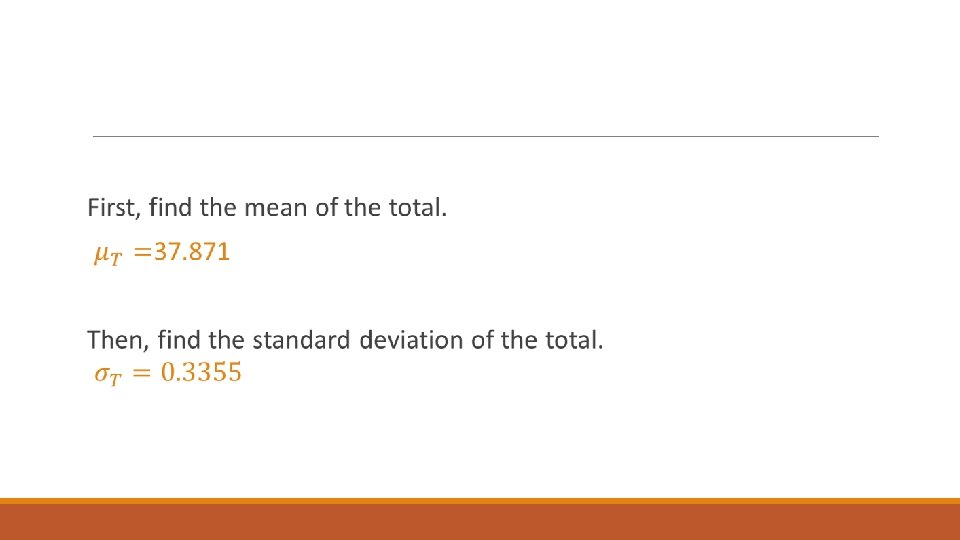
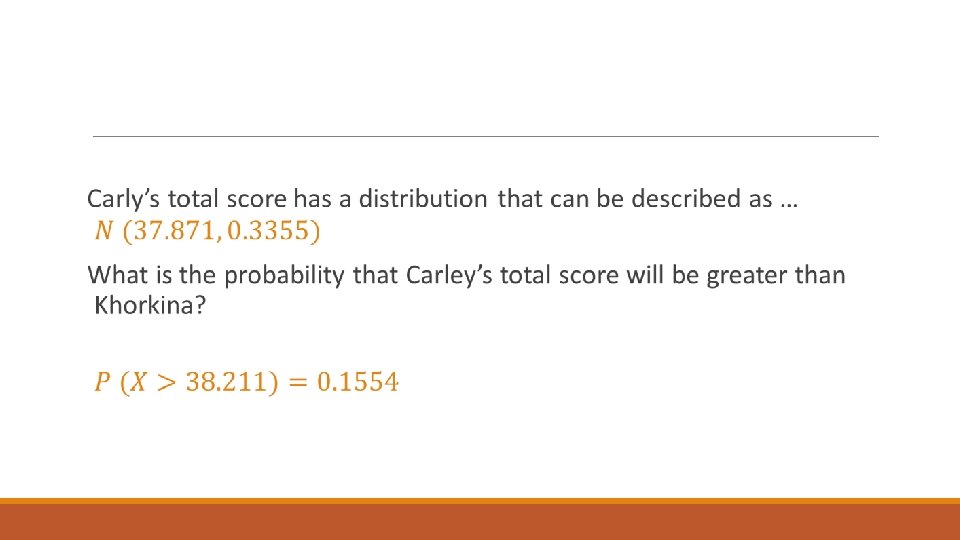
Gold Medalist Carly Patterson won the gold medal in gymnastics at the 2004 Olympics in Athens, Greece. A competitor's total score is determined by adding the scores for four events: vault, parallel bars, balance beam, and floor exercise. Suppose we know that the eventual silver medalist, Russia's Svetlana Khorkina, earned a total score of 38. 211 (her actual total in Athens). Suppose also that Carly's scores in 100 previous meets leading up to the Olympics have been approximately Normally distributed.

Gold Medalist Carly Patterson We will further assume that Carly's perfomance at the Olympics will follow the same pattern as her pre-Olympic meets. This is a reasonable assumption for world-class athletes like Carly. We want to know Carly's chances of beating the total score of the current leader, Khorkina.

Speed Dating… To save time and money, many single people have decided to try speed dating. At a speed dating event, women sit in a circle and men spend about 10 minutes getting to know a woman before moving on to the next one. Suppose that the height M of male speed daters follows a Normal distribution with a mean of 69. 5 inches and a standard deviation of 4 inches, and that the height F of female speed daters follows a Normal distribution with a mean of 65 inches and a standard deviation of 3 inches. What is the probability that a randomly selected male speed dater is taller than the randomly selected female speed dater with whom he is paired?

Speed dating…
- Slides: 24