
5 th Edition Chapter 6 FINANCIAL STRATEGY Mc


- Slides: 47
5 th Edition
Chapter 6 FINANCIAL STRATEGY Mc. Graw-Hill/Irwin Levy/Weitz: Retailing Management, 5/e Copyright © 2004 by The Mc. Graw-Hill Companies, Inc. All rights reserved.
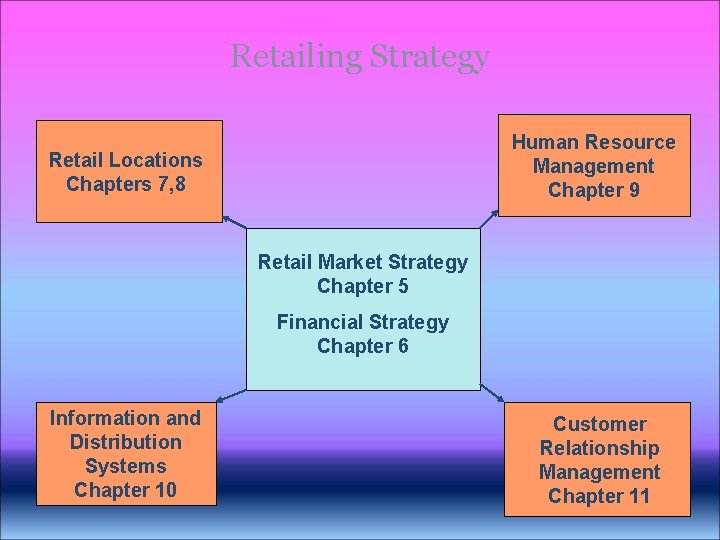
Retailing Strategy Human Resource Management Chapter 9 Retail Locations Chapters 7, 8 Retail Market Strategy Chapter 5 Financial Strategy Chapter 6 Information and Distribution Systems Chapter 10 Customer Relationship Management Chapter 11
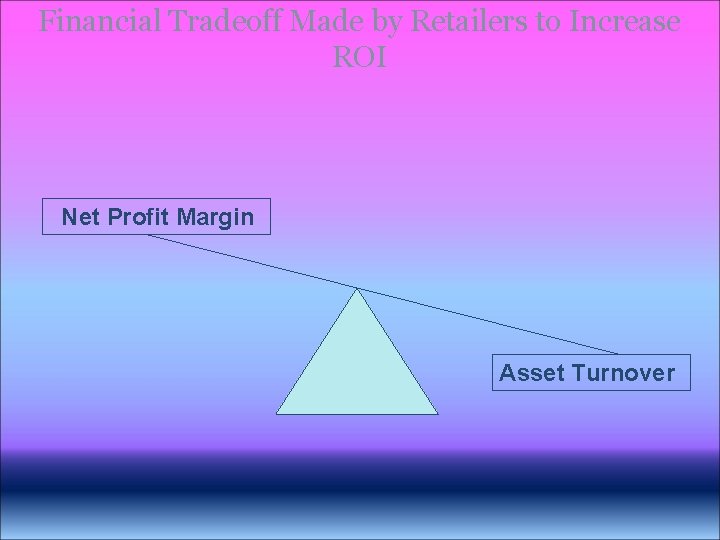
Financial Tradeoff Made by Retailers to Increase ROI Net Profit Margin Asset Turnover
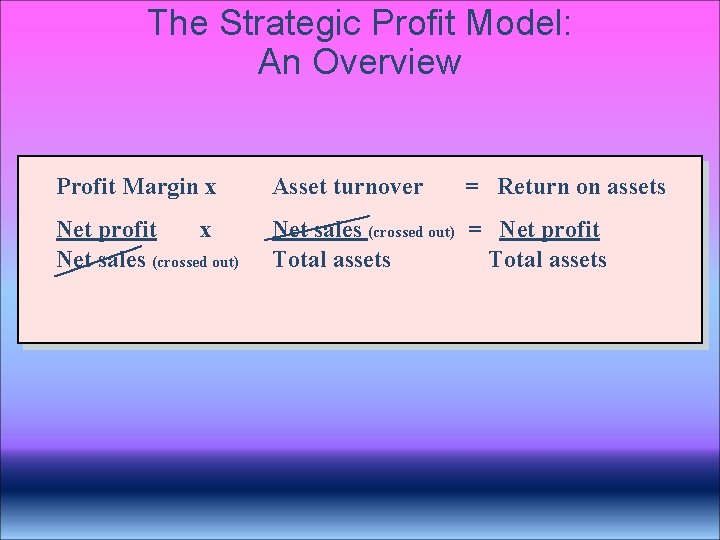
The Strategic Profit Model: An Overview Profit Margin x Asset turnover = Return on assets Net profit x Net sales (crossed out) = Net profit Total assets
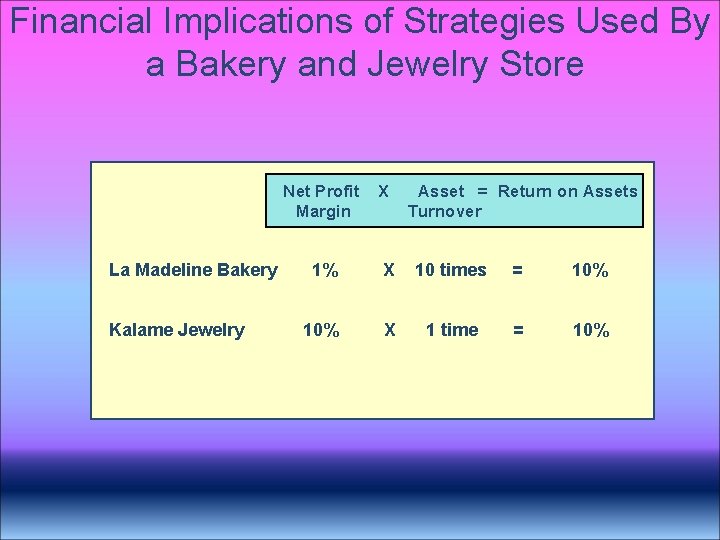
Financial Implications of Strategies Used By a Bakery and Jewelry Store La Madeline Bakery Kalame Jewelry Net Profit Margin X Asset = Return on Assets Turnover 1% X 10 times = 10% X 1 time = 10%
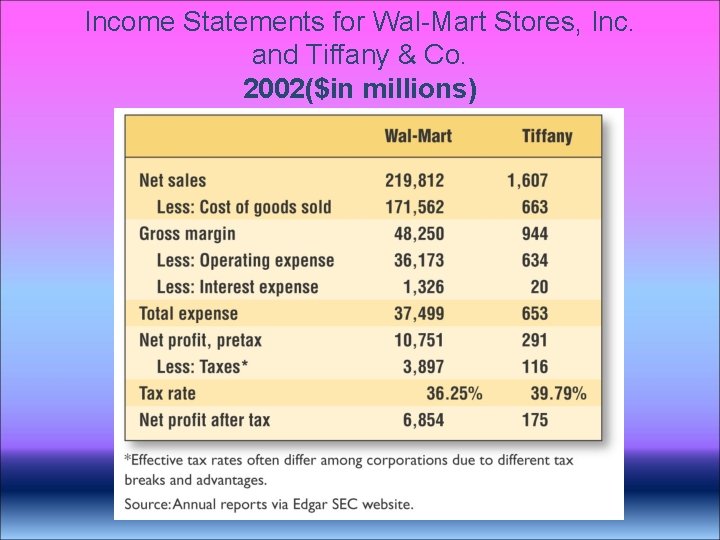
Income Statements for Wal-Mart Stores, Inc. and Tiffany & Co. 2002($in millions)
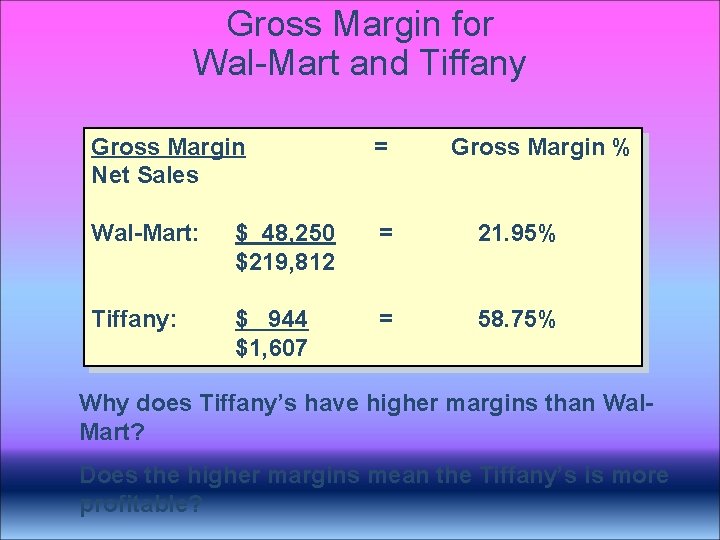
Gross Margin for Wal-Mart and Tiffany Gross Margin Net Sales = Gross Margin % Wal-Mart: $ 48, 250 $219, 812 = 21. 95% Tiffany: $ 944 $1, 607 = 58. 75% Why does Tiffany’s have higher margins than Wal. Mart? Does the higher margins mean the Tiffany’s is more profitable?
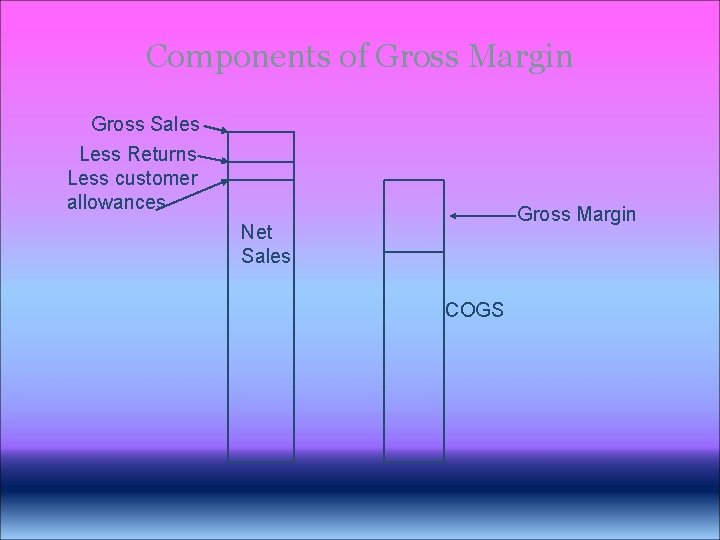
Components of Gross Margin Gross Sales Less Returns Less customer allowances Gross Margin Net Sales COGS
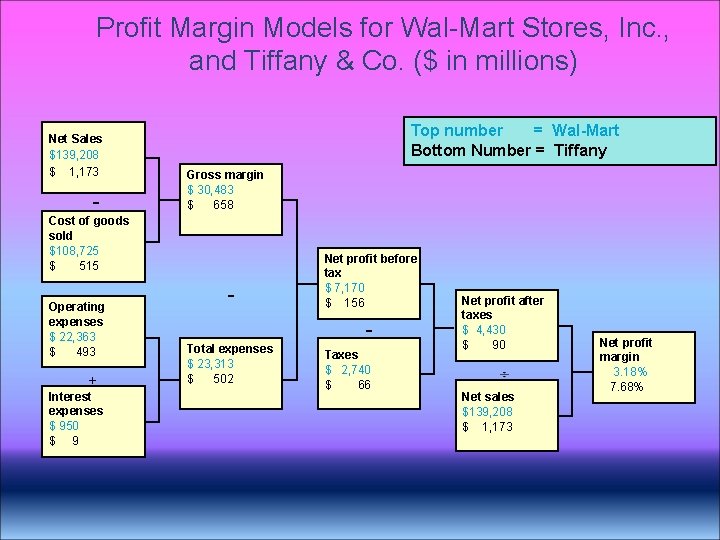
Profit Margin Models for Wal-Mart Stores, Inc. , and Tiffany & Co. ($ in millions) Net Sales $139, 208 $ 1, 173 - Top number = Wal-Mart Bottom Number = Tiffany Gross margin $ 30, 483 $ 658 Cost of goods sold $108, 725 $ 515 Operating expenses $ 22, 363 $ 493 + Interest expenses $ 950 $ 9 - Net profit before tax $ 7, 170 $ 156 Total expenses $ 23, 313 $ 502 Taxes $ 2, 740 $ 66 Net profit after taxes $ 4, 430 $ 90 Net sales $139, 208 $ 1, 173 Net profit margin 3. 18% 7. 68%
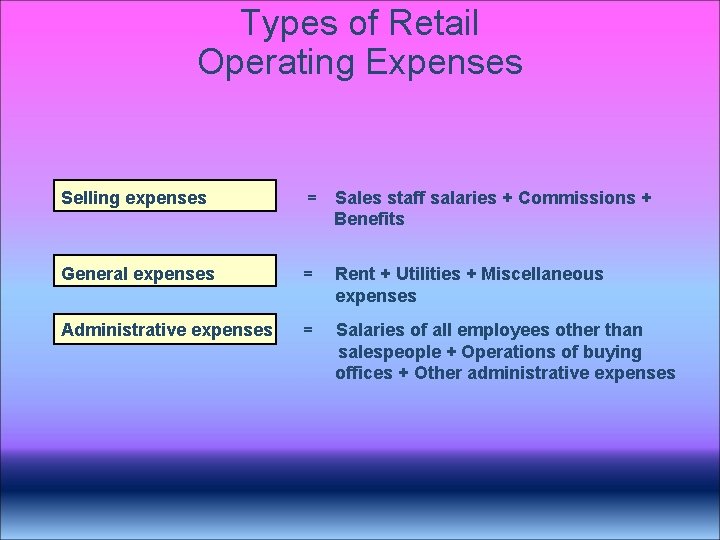
Types of Retail Operating Expenses Selling expenses = Sales staff salaries + Commissions + Benefits General expenses = Rent + Utilities + Miscellaneous expenses Administrative expenses = Salaries of all employees other than salespeople + Operations of buying offices + Other administrative expenses
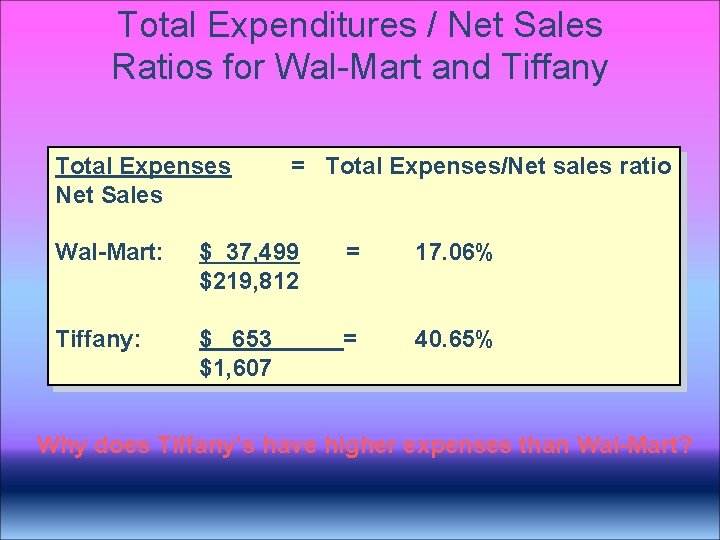
Total Expenditures / Net Sales Ratios for Wal-Mart and Tiffany Total Expenses Net Sales = Total Expenses/Net sales ratio Wal-Mart: $ 37, 499 $219, 812 = 17. 06% Tiffany: $ 653 $1, 607 = 40. 65% Why does Tiffany’s have higher expenses than Wal-Mart?
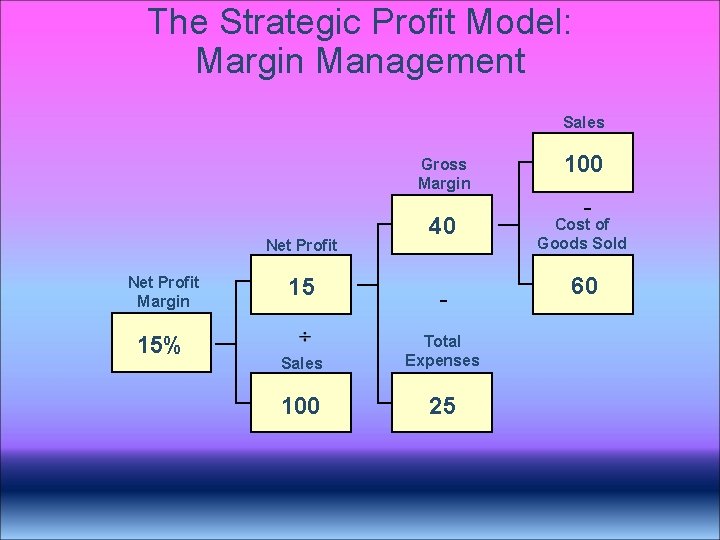
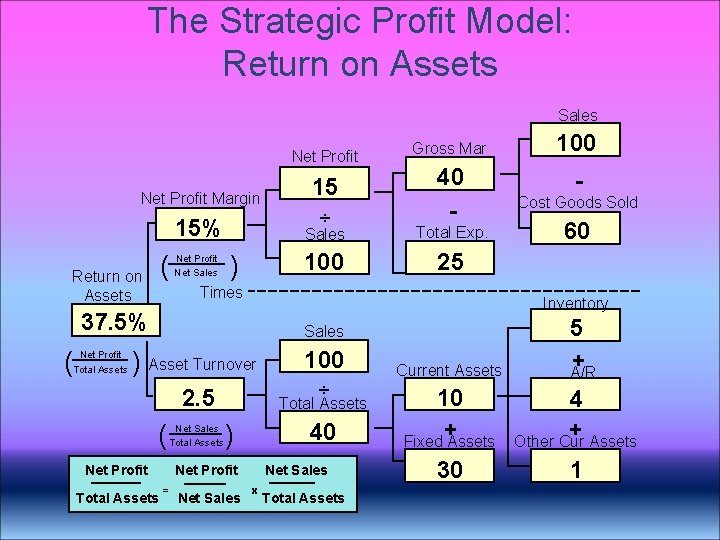
The Strategic Profit Model: Margin Management Sales Gross Margin Net Profit Margin 15% 15 40 - Sales Total Expenses 100 25 100 - Cost of Goods Sold 60
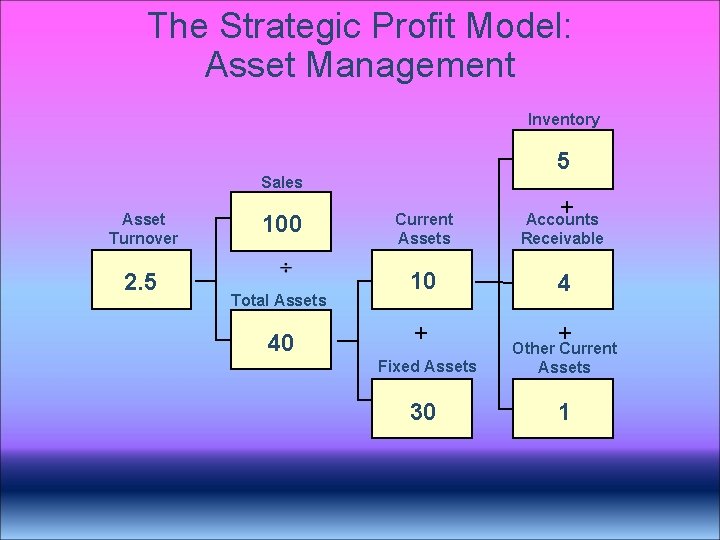
The Strategic Profit Model: Asset Management Inventory 5 Sales Asset Turnover 2. 5 100 Total Assets 40 + Current Assets Accounts Receivable 10 4 + + Fixed Assets Other Current Assets 30 1
The Strategic Profit Model: Return on Assets Sales Net Profit Margin 15% Sales Total Exp. 100 25 ( Net Profit Net Sales ) ÷ Times Sales ) Asset Turnover 100 2. 5 Total Assets ( Net Sales Total Assets Net Profit Total Assets ÷ 40 ) Net Profit = Net Sales 100 - Cost Goods Sold 60 Inventory 37. 5% Net Profit Total Assets 40 - 15 Return on Assets ( Gross Mar Net Sales x Total Assets Current Assets 5 + A/R 10 + Fixed Assets 4 + Other Cur Assets 30 1
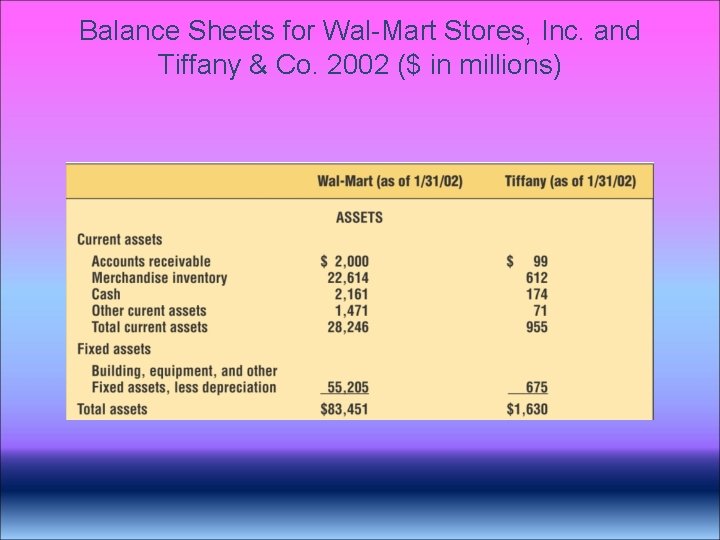
Balance Sheets for Wal-Mart Stores, Inc. and Tiffany & Co. 2002 ($ in millions)
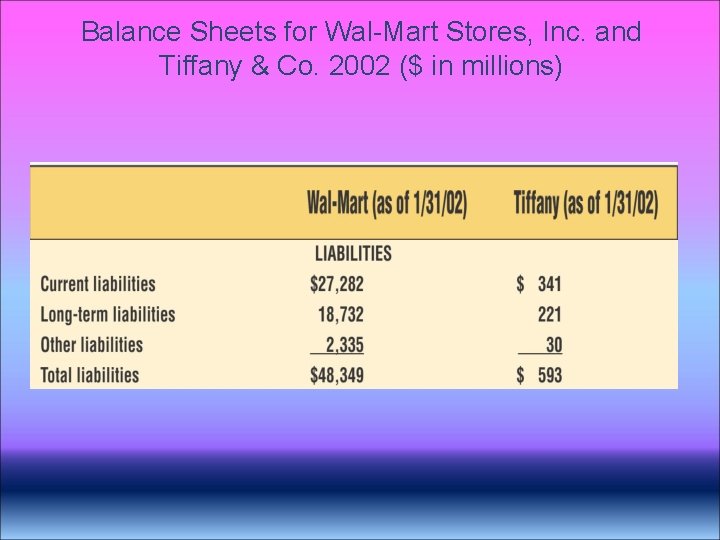
Balance Sheets for Wal-Mart Stores, Inc. and Tiffany & Co. 2002 ($ in millions)
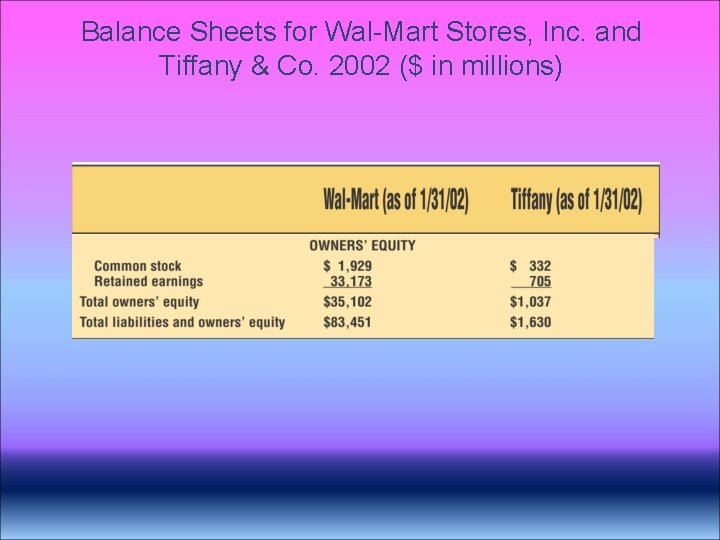
Balance Sheets for Wal-Mart Stores, Inc. and Tiffany & Co. 2002 ($ in millions)
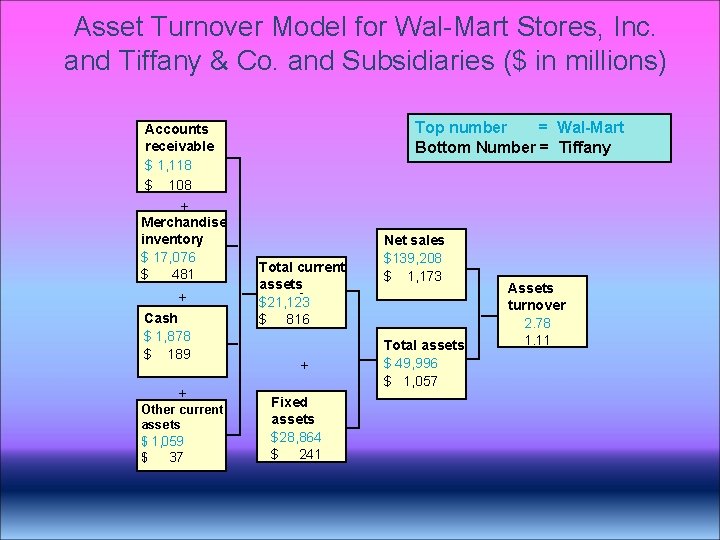
Asset Turnover Model for Wal-Mart Stores, Inc. and Tiffany & Co. and Subsidiaries ($ in millions) Top number = Wal-Mart Bottom Number = Tiffany Accounts receivable $ 1, 118 $ 108 + Merchandise inventory $ 17, 076 $ 481 + Cash $ 1, 878 $ 189 + Other current assets $ 1, 059 $ 37 Total current assets $21, 123 $ 816 + Fixed assets $28, 864 $ 241 Net sales $139, 208 $ 1, 173 Total assets $ 49, 996 $ 1, 057 Assets turnover 2. 78 1. 11
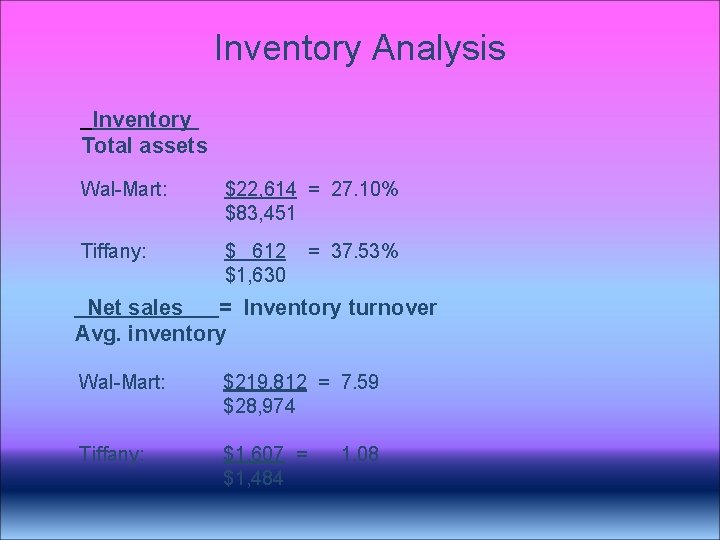
Inventory Analysis Inventory Total assets Wal-Mart: $22, 614 = 27. 10% $83, 451 Tiffany: $ 612 $1, 630 = 37. 53% Net sales = Inventory turnover Avg. inventory Wal-Mart: $219, 812 = 7. 59 $28, 974 Tiffany: $1, 607 = $1, 484 1. 08
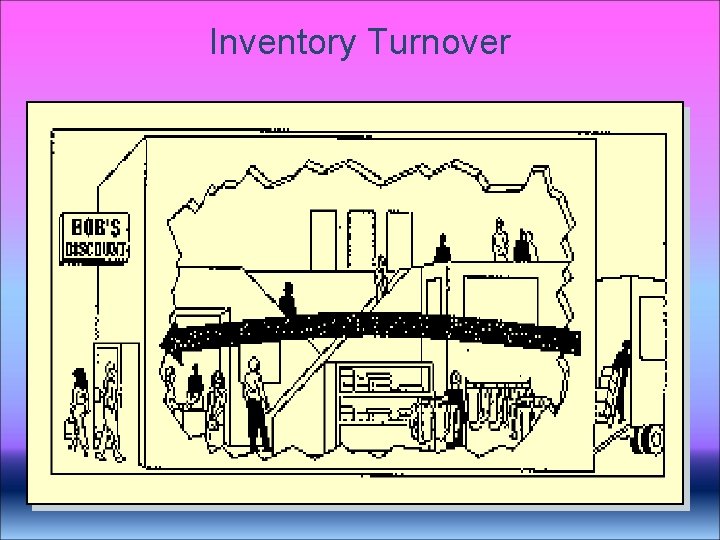
Inventory Turnover
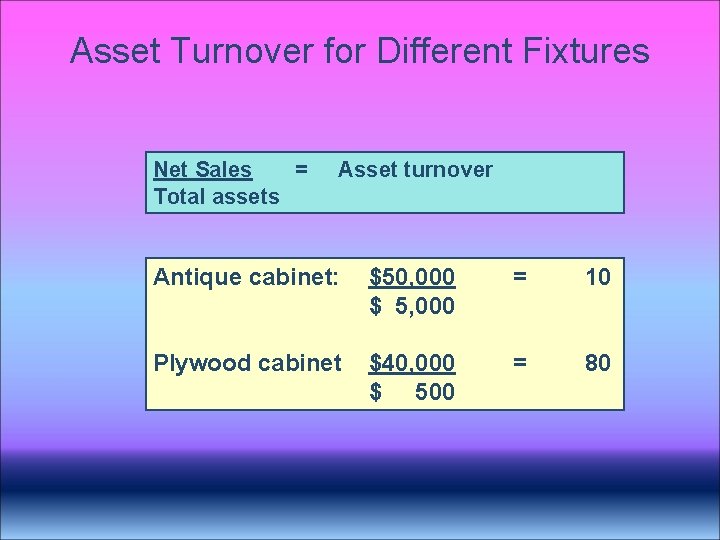
Asset Turnover for Different Fixtures Net Sales = Total assets Asset turnover Antique cabinet: $50, 000 $ 5, 000 = 10 Plywood cabinet $40, 000 $ 500 = 80
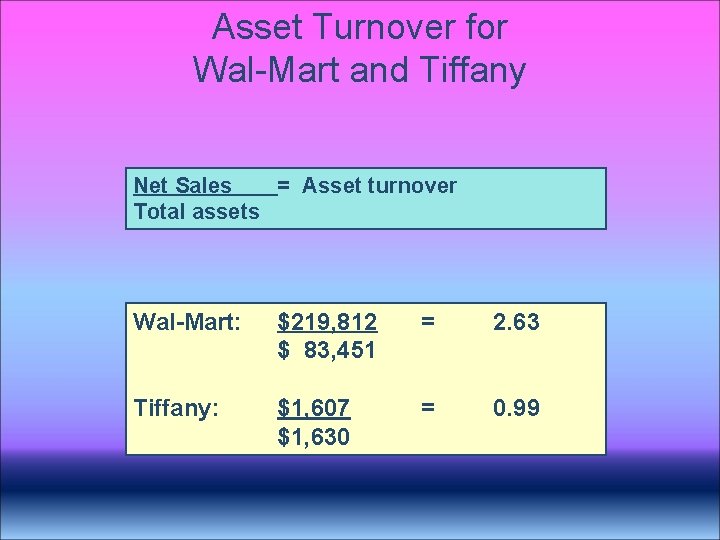
Asset Turnover for Wal-Mart and Tiffany Net Sales = Asset turnover Total assets Wal-Mart: $219, 812 $ 83, 451 = 2. 63 Tiffany: $1, 607 $1, 630 = 0. 99
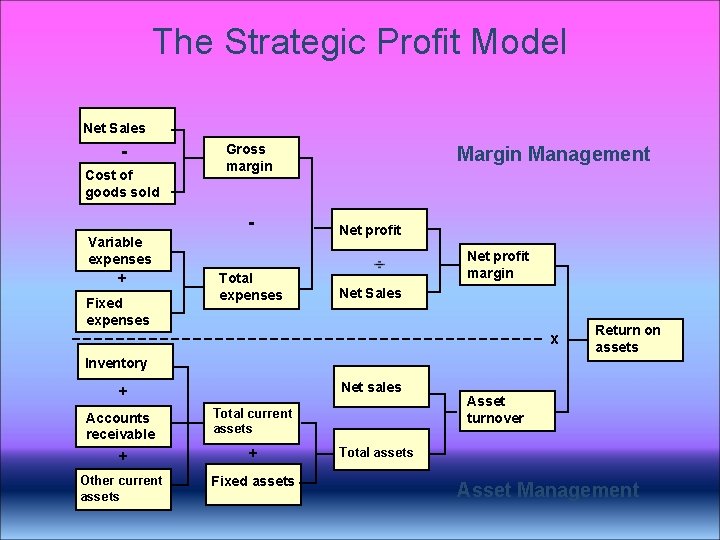
The Strategic Profit Model Net Sales Cost of goods sold Gross margin Variable expenses + Fixed expenses Total expenses Margin Management Net profit margin Net Sales x Inventory Net sales + Accounts receivable Total current assets + + Other current assets Fixed assets Return on assets Asset turnover Total assets Asset Management
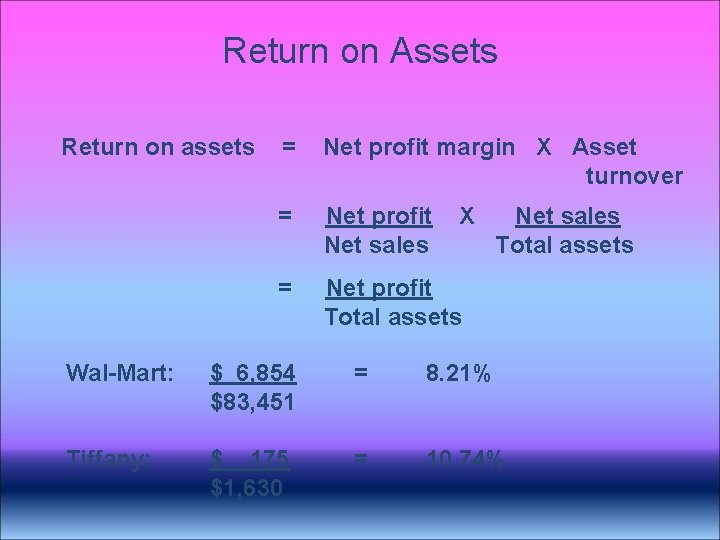
Return on Assets Return on assets = Net profit margin X Asset turnover = Net profit Net sales = Net profit Total assets X Net sales Total assets Wal-Mart: $ 6, 854 $83, 451 = 8. 21% Tiffany: $ 175 $1, 630 = 10. 74%
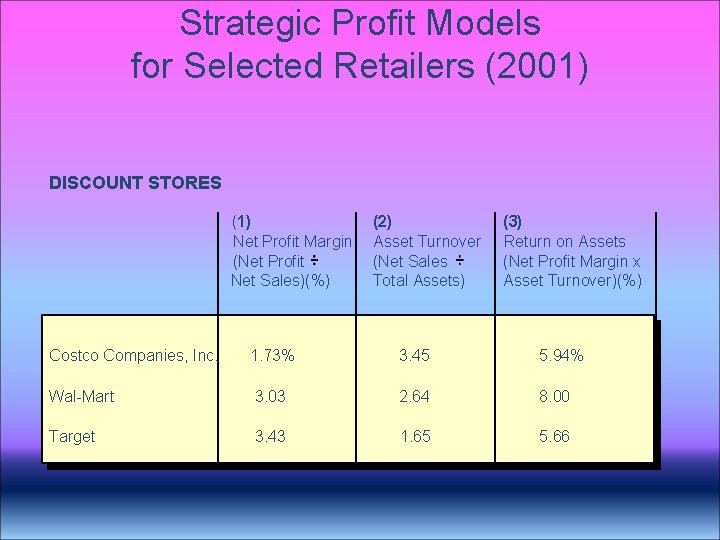
Strategic Profit Models for Selected Retailers (2001) DISCOUNT STORES (1) Net Profit Margin (Net Profit Net Sales)(%) Costco Companies, Inc. (2) Asset Turnover (Net Sales Total Assets) (3) Return on Assets (Net Profit Margin x Asset Turnover)(%) 1. 73% 3. 45 5. 94% Wal-Mart 3. 03 2. 64 8. 00 Target 3. 43 1. 65 5. 66
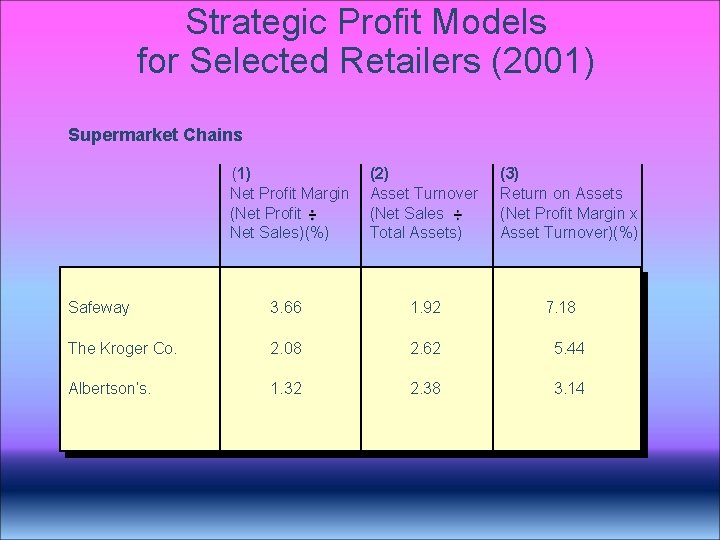
Strategic Profit Models for Selected Retailers (2001) Supermarket Chains (1) Net Profit Margin (Net Profit Net Sales)(%) (2) Asset Turnover (Net Sales Total Assets) (3) Return on Assets (Net Profit Margin x Asset Turnover)(%) Safeway 3. 66 1. 92 The Kroger Co. 2. 08 2. 62 5. 44 Albertson’s. 1. 32 2. 38 3. 14 7. 18
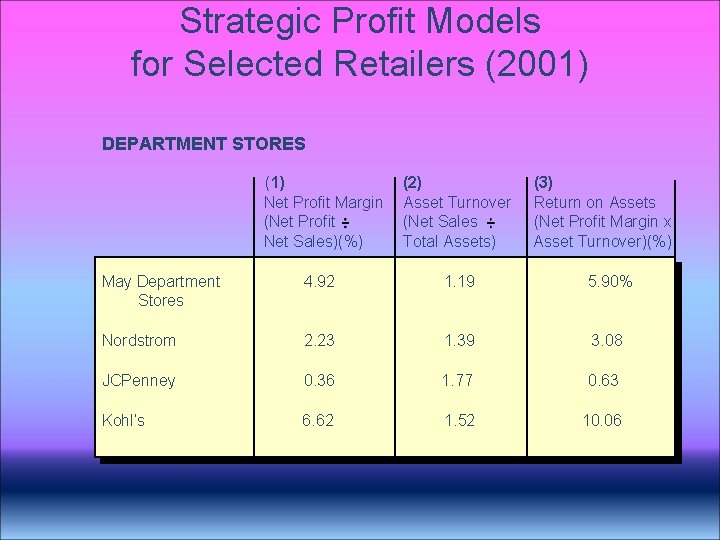
Strategic Profit Models for Selected Retailers (2001) DEPARTMENT STORES (1) Net Profit Margin (Net Profit Net Sales)(%) (2) Asset Turnover (Net Sales Total Assets) May Department Stores 4. 92 1. 19 5. 90% Nordstrom 2. 23 1. 39 3. 08 JCPenney 0. 36 1. 77 0. 63 Kohl’s 6. 62 1. 52 10. 06 . (3) Return on Assets (Net Profit Margin x Asset Turnover)(%)
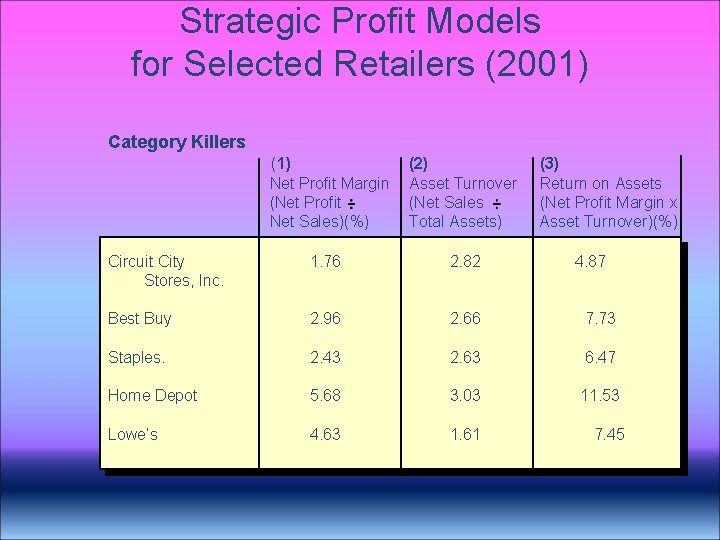
Strategic Profit Models for Selected Retailers (2001) Category Killers (1) Net Profit Margin (Net Profit Net Sales)(%) (2) Asset Turnover (Net Sales Total Assets) (3) Return on Assets (Net Profit Margin x Asset Turnover)(%) Circuit City Stores, Inc. 1. 76 2. 82 Best Buy 2. 96 2. 66 7. 73 Staples. 2. 43 2. 63 6. 47 Home Depot 5. 68 3. 03 11. 53 Lowe’s 4. 63 1. 61 4. 87 7. 45
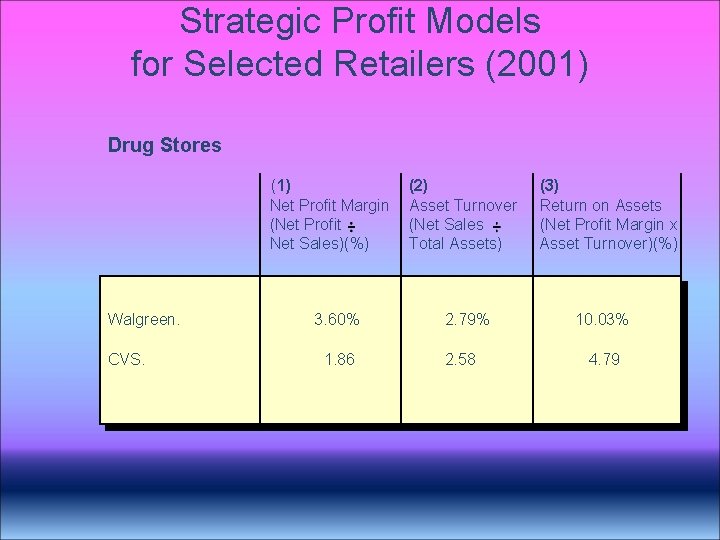
Strategic Profit Models for Selected Retailers (2001) Drug Stores (1) Net Profit Margin (Net Profit Net Sales)(%) Walgreen. CVS. 3. 60% 1. 86 (2) Asset Turnover (Net Sales Total Assets) 2. 79% 2. 58 (3) Return on Assets (Net Profit Margin x Asset Turnover)(%) 10. 03% 4. 79
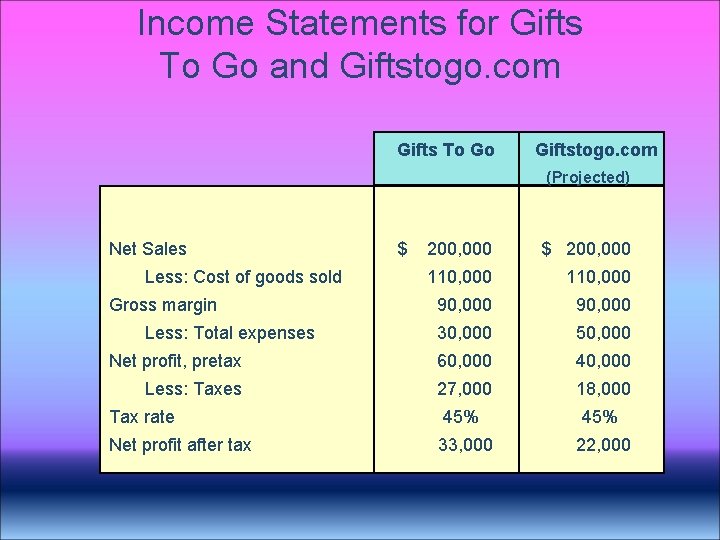
Income Statements for Gifts To Go and Giftstogo. com Gifts To Go Giftstogo. com (Projected) Net Sales 200, 000 $ 200, 000 110, 000 90, 000 30, 000 50, 000 Net profit, pretax 60, 000 40, 000 Less: Taxes 27, 000 18, 000 Tax rate 45% Net profit after tax 33, 000 22, 000 Less: Cost of goods sold Gross margin Less: Total expenses $
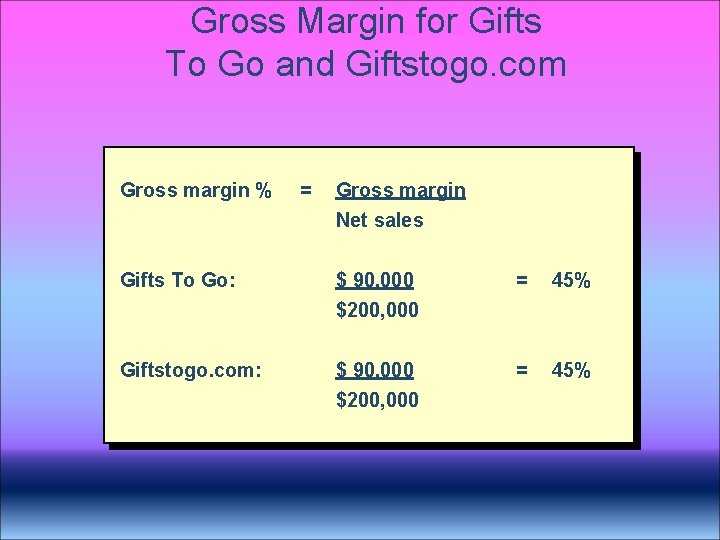
Gross Margin for Gifts To Go and Giftstogo. com Gross margin % = Gross margin Net sales Gifts To Go: $ 90, 000 $200, 000 = 45% Giftstogo. com: $ 90, 000 $200, 000 = 45%
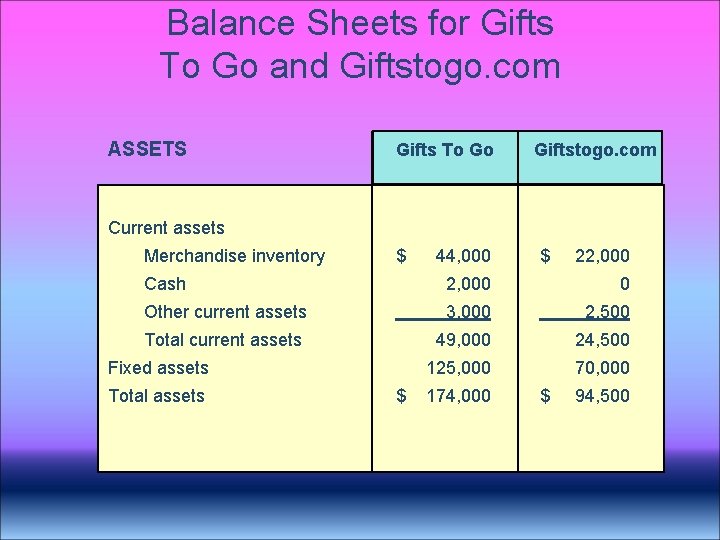
Balance Sheets for Gifts To Go and Giftstogo. com ASSETS Gifts To Go Giftstogo. com Current assets Merchandise inventory $ 44, 000 $ 22, 000 Cash 2, 000 0 Other current assets 3, 000 2, 500 Total current assets 49, 000 24, 500 125, 000 70, 000 Fixed assets Total assets $ 174, 000 $ 94, 500
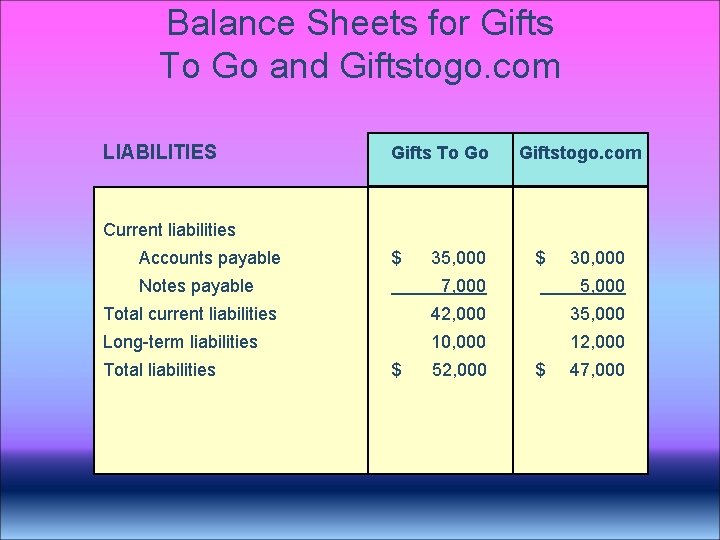
Balance Sheets for Gifts To Go and Giftstogo. com LIABILITIES Gifts To Go Giftstogo. com Current liabilities Accounts payable $ Notes payable 35, 000 $ 30, 000 7, 000 5, 000 Total current liabilities 42, 000 35, 000 Long-term liabilities 10, 000 12, 000 Total liabilities $ 52, 000 $ 47, 000
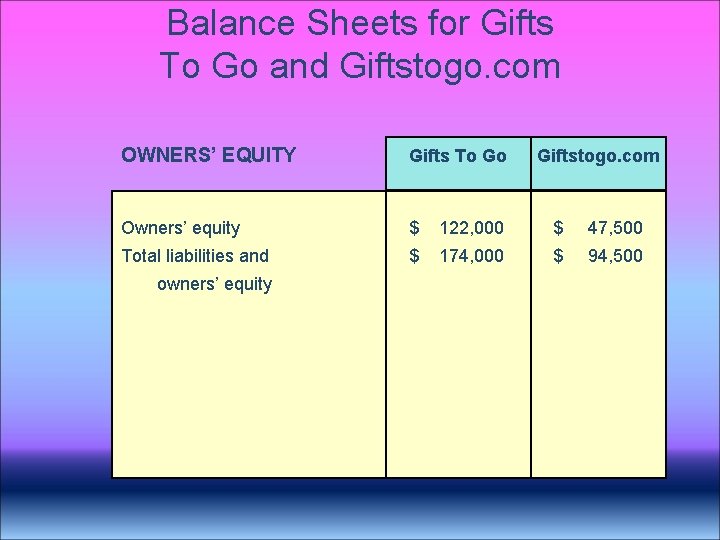
Balance Sheets for Gifts To Go and Giftstogo. com OWNERS’ EQUITY Gifts To Go Owners’ equity $ 122, 000 $ 47, 500 Total liabilities and $ 174, 000 $ 94, 500 owners’ equity Giftstogo. com
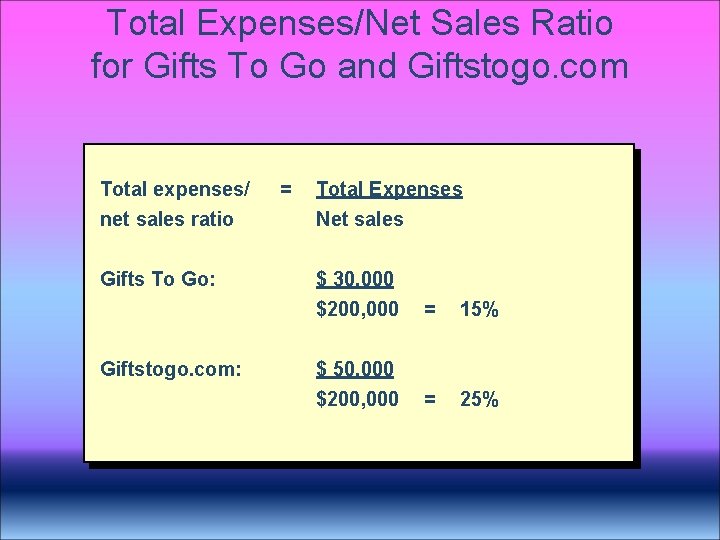
Total Expenses/Net Sales Ratio for Gifts To Go and Giftstogo. com Total expenses/ net sales ratio Gifts To Go: Giftstogo. com: = Total Expenses Net sales $ 30, 000 $200, 000 = 15% $ 50, 000 $200, 000 = 25%
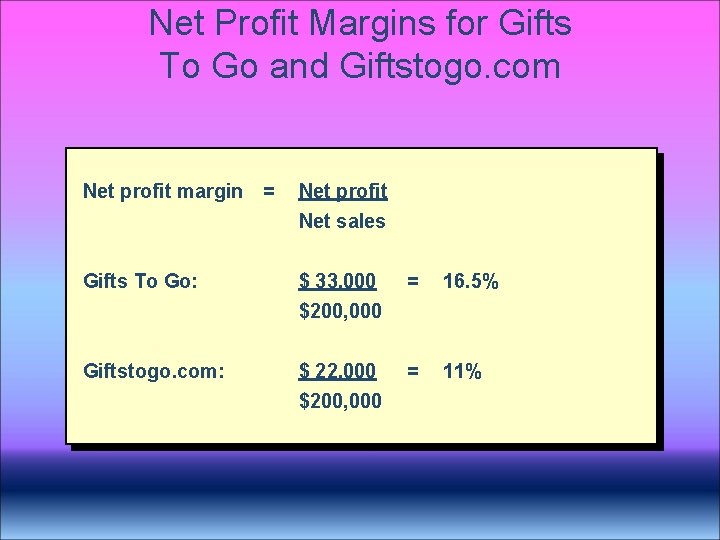
Net Profit Margins for Gifts To Go and Giftstogo. com Net profit margin = Net profit Net sales Gifts To Go: $ 33, 000 $200, 000 = 16. 5% Giftstogo. com: $ 22, 000 $200, 000 = 11%
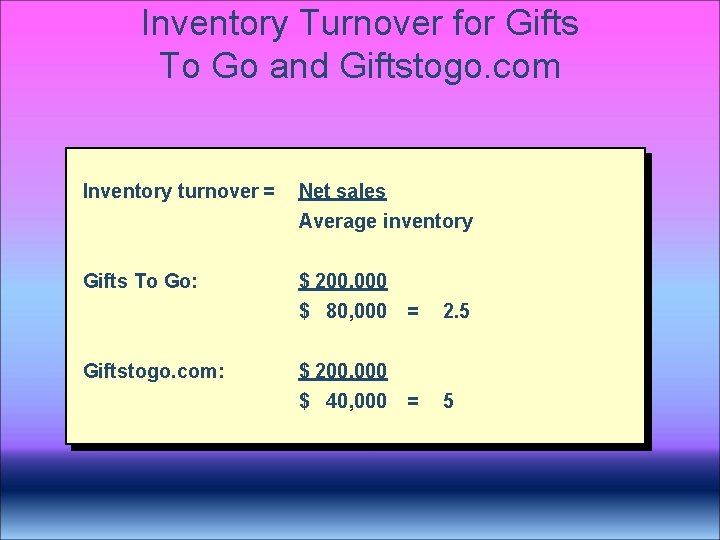
Inventory Turnover for Gifts To Go and Giftstogo. com Inventory turnover = Net sales Average inventory Gifts To Go: $ 200, 000 $ 80, 000 = 2. 5 $ 200, 000 $ 40, 000 = 5 Giftstogo. com:
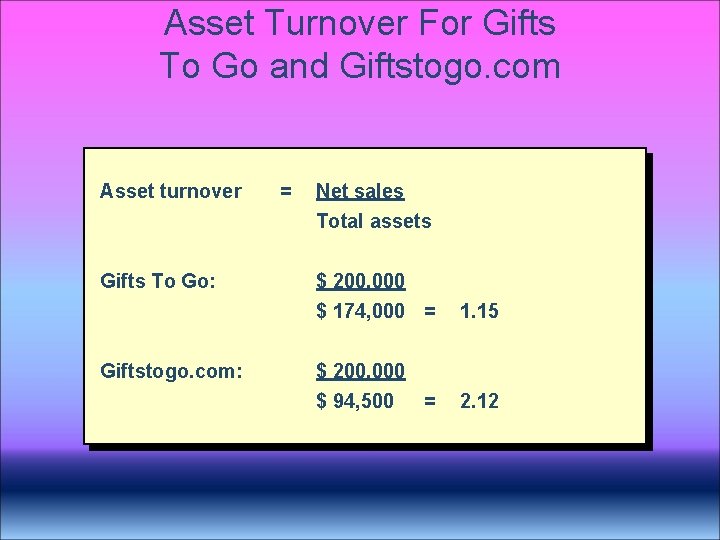
Asset Turnover For Gifts To Go and Giftstogo. com Asset turnover Gifts To Go: Giftstogo. com: = Net sales Total assets $ 200, 000 $ 174, 000 = 1. 15 $ 200, 000 $ 94, 500 = 2. 12
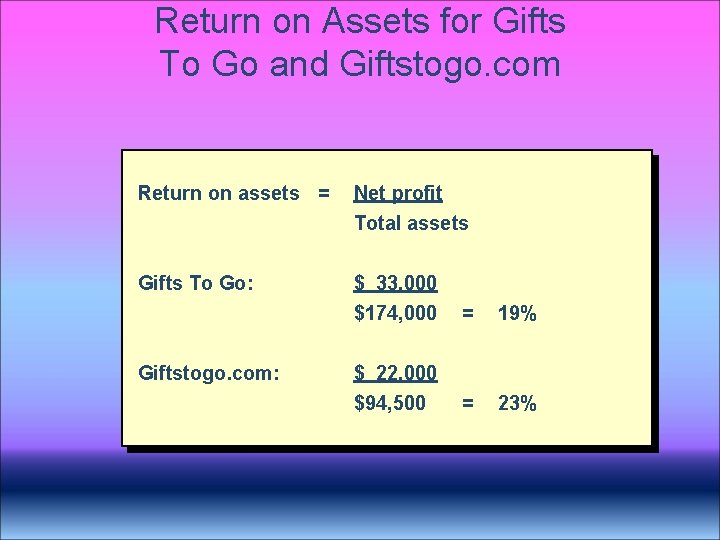
Return on Assets for Gifts To Go and Giftstogo. com Return on assets = Net profit Total assets Gifts To Go: $ 33, 000 $174, 000 = 19% $ 22, 000 $94, 500 = 23% Giftstogo. com:
Productivity Measures Returns on Investments vs. Absolute Profits
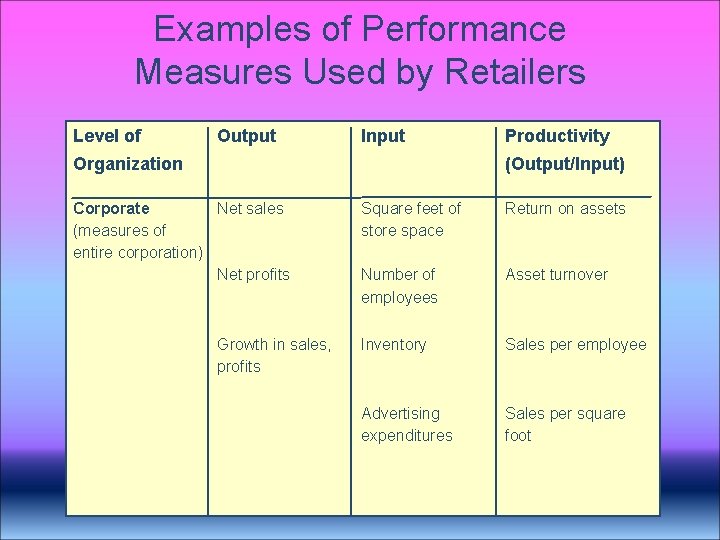
Examples of Performance Measures Used by Retailers Level of Output Input Organization Productivity (Output/Input) Corporate Net sales (measures of entire corporation) Net profits Growth in sales, profits Square feet of store space Return on assets Number of employees Asset turnover Inventory Sales per employee Advertising expenditures Sales per square foot
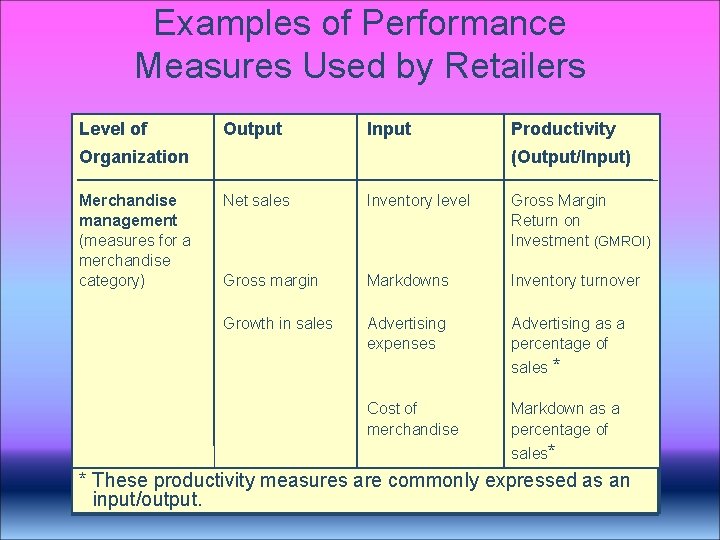
Examples of Performance Measures Used by Retailers Level of Output Input Organization Merchandise management (measures for a merchandise category) Productivity (Output/Input) Net sales Inventory level Gross Margin Return on Investment (GMROI) Gross margin Markdowns Inventory turnover Growth in sales Advertising expenses Advertising as a percentage of sales * Cost of merchandise Markdown as a percentage of sales* * These productivity measures are commonly expressed as an input/output.
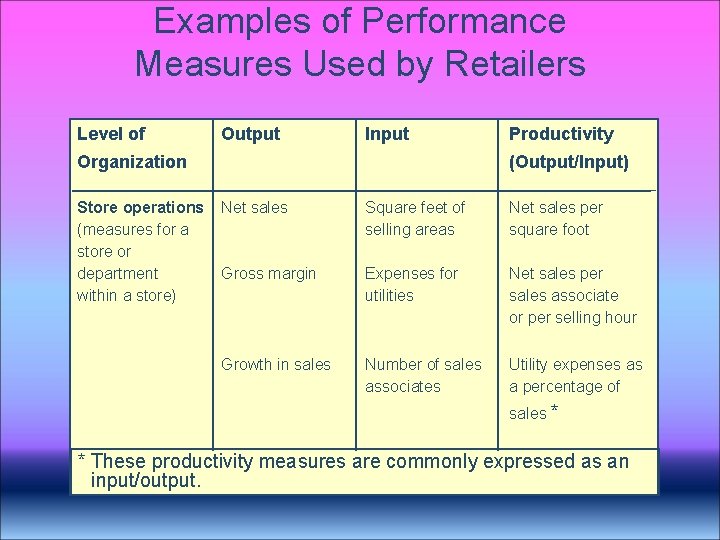
Examples of Performance Measures Used by Retailers Level of Output Input Organization Store operations (measures for a store or department within a store) Productivity (Output/Input) Net sales Square feet of selling areas Net sales per square foot Gross margin Expenses for utilities Net sales per sales associate or per selling hour Growth in sales Number of sales associates Utility expenses as a percentage of sales * * These productivity measures are commonly expressed as an input/output.
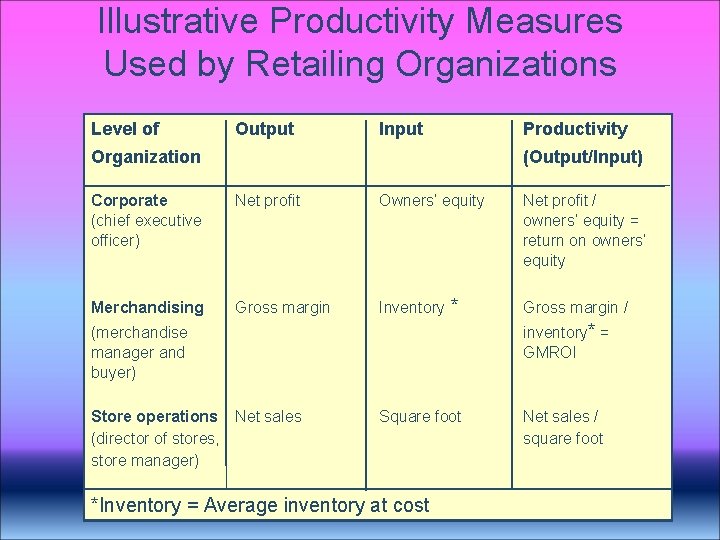
Illustrative Productivity Measures Used by Retailing Organizations Level of Output Input Productivity Organization (Output/Input) Corporate (chief executive officer) Net profit Owners’ equity Merchandising Gross margin Inventory * Gross margin / inventory* = GMROI (merchandise manager and buyer) Store operations Net sales (director of stores, store manager) Net profit / owners’ equity = return on owners’ equity Square foot *Inventory = Average inventory at cost Net sales / square foot
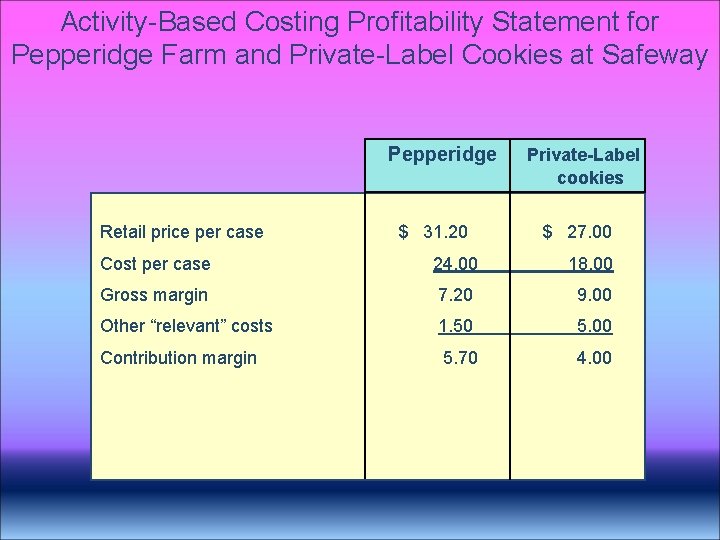
Activity-Based Costing Profitability Statement for Pepperidge Farm and Private-Label Cookies at Safeway Pepperidge Retail price per case $ 31. 20 Private-Label cookies $ 27. 00 Cost per case 24. 00 18. 00 Gross margin 7. 20 9. 00 Other “relevant” costs 1. 50 5. 00 Contribution margin 5. 70 4. 00
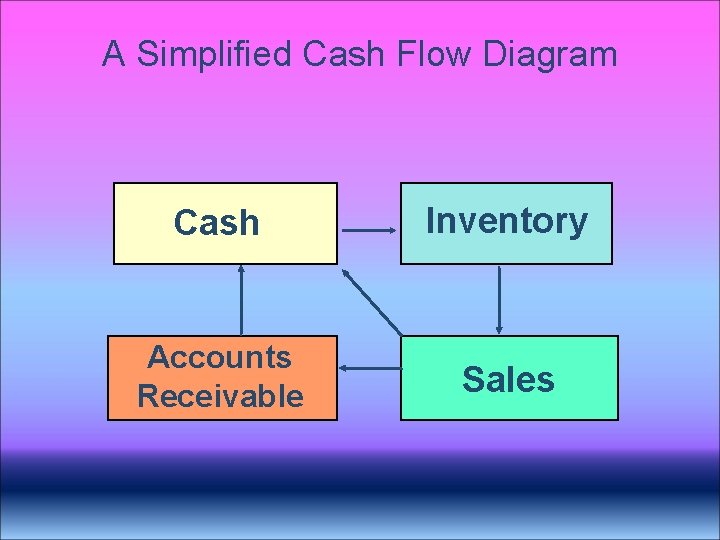
A Simplified Cash Flow Diagram Cash Inventory Accounts Receivable Sales