5 Productivity Work Standard Ratios Objectives Productivity index


5 มตของการวด Productivity Work Standard Ratios: Objectives: Productivity index Overall indexes: Cost Ratios: Time Standard Ratios: �. �������


Staffing and Productivity Goals to understand some of the key terms in workload management Know the relationship between staffing and scheduling Understand the meaning of productivity in health care organizations Develop and describe commonly used productivity ratios

Workload Management Staffing Scheduling Reallocation Patient Satisfaction Staff Utilization Productivity Costs Staff Satisfaction

Workload Management Staffing Decide on the appropriate number of full time employees to be hired in each skill class Longer term– tactical Scheduling Establishes when each staff will be on or off duty and on which shifts they will work Often per pay period Reallocation Fine tunes the previous decisions. Shift-by-shift decisions.

Determination of FTEs for Nurse Staffing • Minutes of required care Minutes of care = (average census) * (average required minutes per patient) • Unadjusted FTEs = (Total minutes of care)/ (Minutes available to work per nurse per day) • Core Level FTEs = (Total Minutes of Care)/(utilization standard)*Available work minutes) See example on Excel Spreadsheet

Daily Productivity Trend Hours • Worked Hours: Hours expended to carry on operations Worked / Productive Hours = Regular + Overtime + Contract • Paid Hours: All hours expended in a department Paid Hours = Regular + Overtime + Contract + Orientation + Education + PTO + Holiday • Contract: Per Diem or Contract Agency • Overtime: Hours paid at time and a half • Orientation: Hours used for orientation
 • Productive Hours = Worked hours or hours expended that contribute")
Hours (cont. ) • Productive Hours = Worked hours or hours expended that contribute to operations • Non-Productive Hours = Hours expended that do not contribute to operations Non-Productive = Orientation + Education + PTO + Holiday • Paid Hours = All hours previously described
 Worked Hrs Paid Hrs Salary Cost Per")
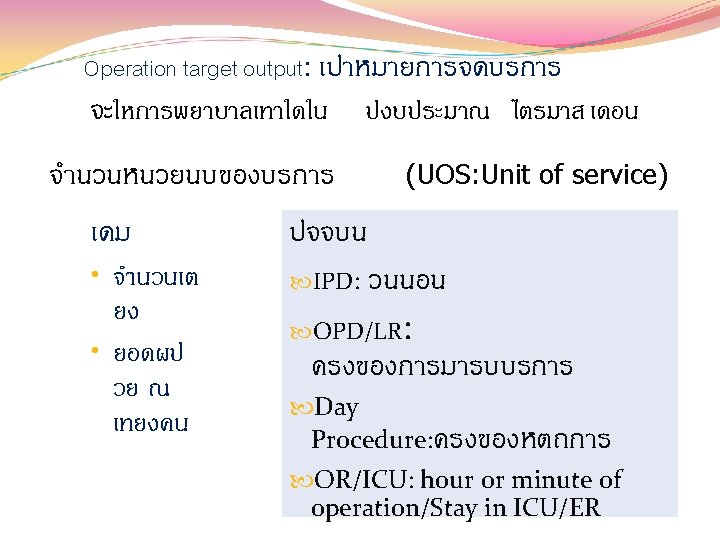
Daily Productivity Trend UOS (Unit of Service) Worked Hrs Paid Hrs Salary Cost Per Stat Avg Hrly Rate Agency / Contract Hrs & % Overtime Hrs & % Orientation Hrs & %

Daily Productivity Trend • Totals hours used for Pay Period • Total hours used in prior Pay Period • Total hours used month to date

Daily Productivity Trend Focused mainly on the management of actual hours Worked Hours Paid Hours Agency Hours/Part time – OT –Per Diam Provides trended view of hours used during a given pay period Allows one to see improvements or failures in labor resource management from day to day

Daily Productivity Trend • Totals hours used for Pay Period • Total hours used in prior Pay Period • Total hours used month to date


Ex. Key Performance Areas Patient care Quality of care improvement Staffing Cost control Increase Productivity Improved patient&staff satisfaction Innovation &Long-range planning

“Emphasis on quality, Not costs” System Attributes & Relationships 1 2 3 4 5 Systems Atributes Quality Costs Productivity Profits Customer Satisfaction Systems Goal HIGH DOWN UP UP HIGH Due to: n. Fewer rework n. Fewer complaints n. Fewer medication /Diagnosis errors n. Higher Demand Due to: n. Reduced costs n. Increased Demand

Source: National Health Minister’s Benchmarking Category Working Group 1996 Indicator Efficiency Cost per casemix Cost of treatment per outpatient Average LOS for top 20 DRGs Productivity Cost per case-mix Labour cost per case-mix Quality Re-admit rate within 28 days Rate of hospital acquired infection Rate of unplanned return to theatre Pt. Satisfaction Access Waiting time Variations in intervention rates

Directional arrows indicate performances that are higher than the nursing service organization benchmark. and lower

- Slides: 45